Excel: Evaluating questionnaires and surveys - statistics using a practical case study
Do you have the results of a survey or questionnaire in front of you? Now you want to evaluate the data in order to optimize processes, offers or services? Then learn how to derive specific recommendations for action from your tables using various statistical methods in this three-hour video training course. A practical Excel and statistics training course by Fabio Basler - including raw data, tasks and solutions as well as a helpful collection of formulas.
- Statistics in Excel using the case study of a customer survey for a webshop (e-commerce)
- Learn how to analyze and interpret your own data
- Gain targeted insights from surveys and questionnaires
- Almost three-hour video tutorial on the practical application of descriptive and inductive statistics
- Among other things: Pivot tables, correlation matrix, outlier analysis and boxplot
- Included: Excel raw data for practicing, exercises and solutions, collection of formulas
There are countless opportunities for improving your business lying dormant in your data. Uncover them now - with the help of this instructive Excel statistics training course!
- Usable with:
- content:
3 h Video training
- Licence: private and commercial Rights of use
- Bonus: including working material
Intro to the video training
Introduction
Descriptive statistics
Inferential statistics
Details of the content
Descriptive and inductive statistics in Excel: How to read your data correctly!
What is more important to your customers? Quality or customer service? How do they rate the prices of products or services? Which adjustments should you make to generate even more sales? Such questions about the optimization of business processes as well as offers and services can be answered with the help of questionnaires and surveys .
However, the value of the data obtained only becomes apparent when you analyze and interpret it correctly using suitable methods . In this three-hour training course, you will learn about important descriptive and inductive statistical elements. You will also learn how to implement these in Excel. Whether you want to evaluate the results of surveys and questionnaires or other data - with this training course, you will certainly know more after taking an analytical look at your tables!
Practical learning: Analyzing data from surveys and questionnaires
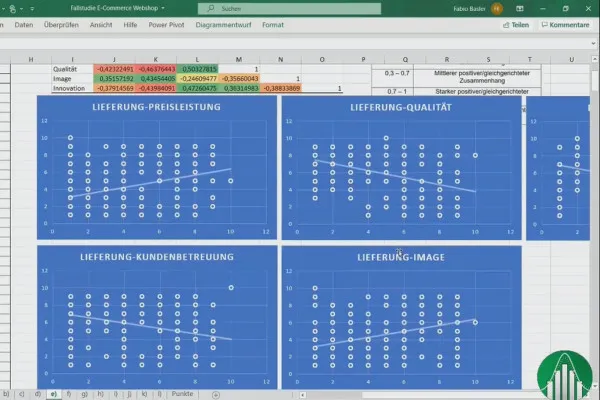
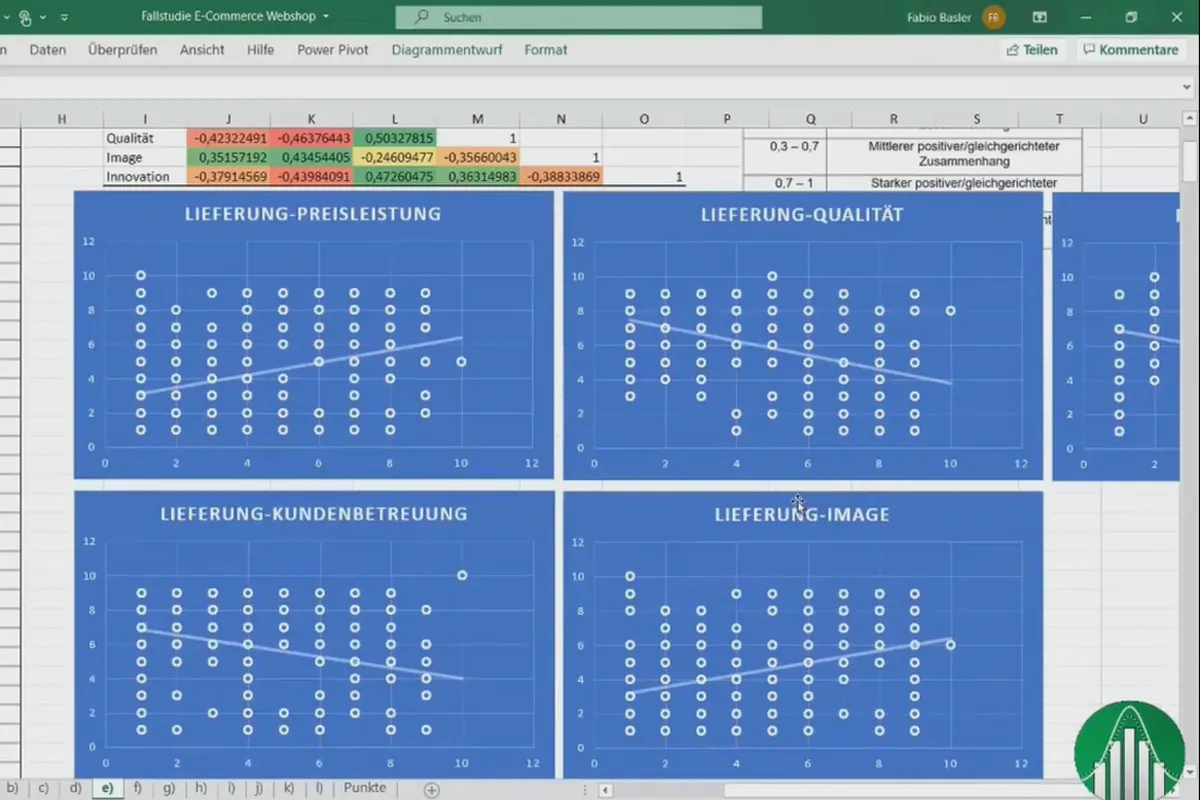
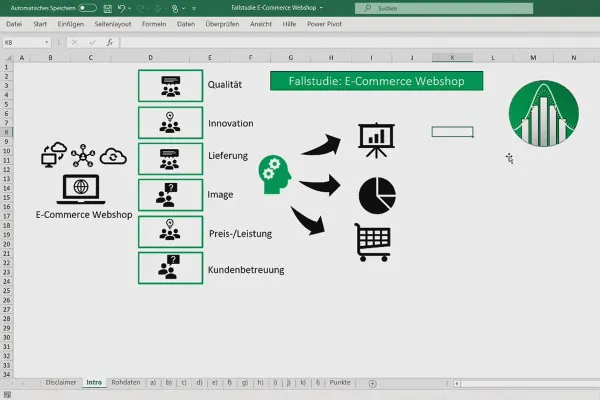
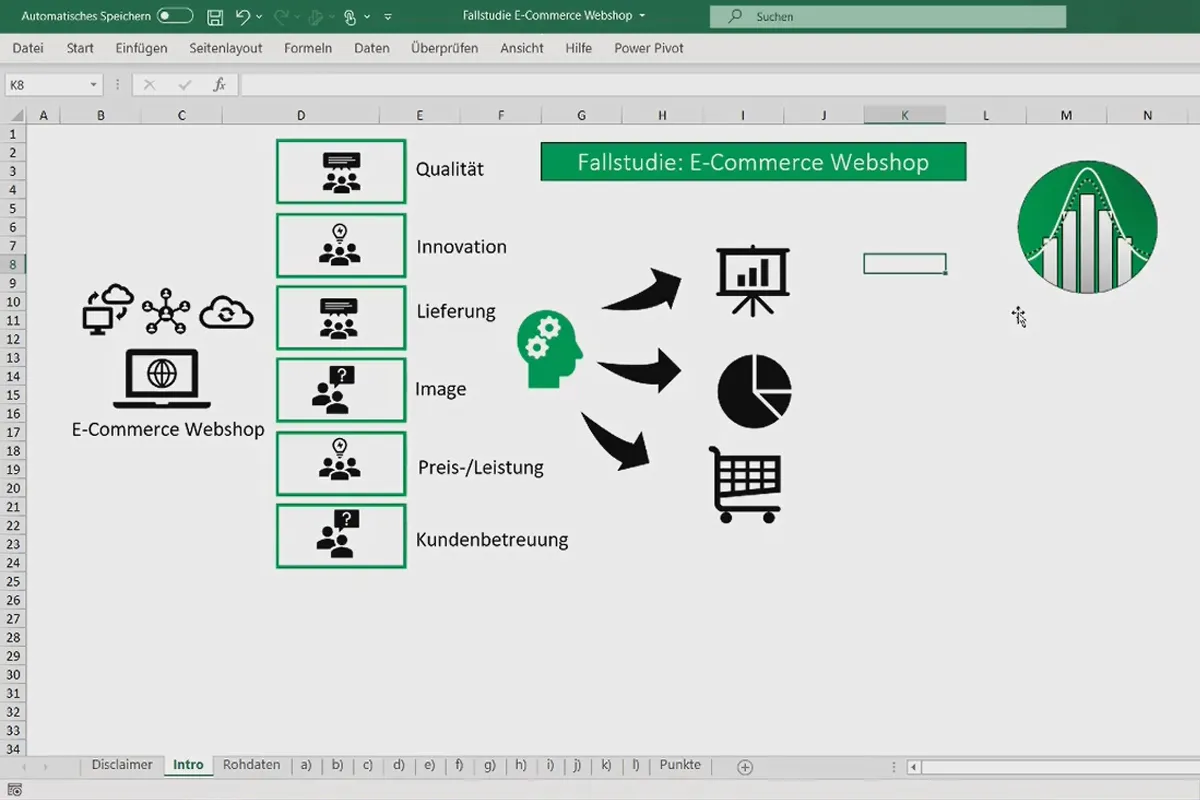
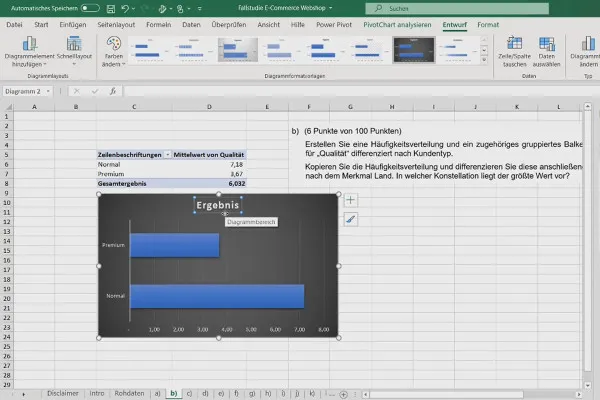
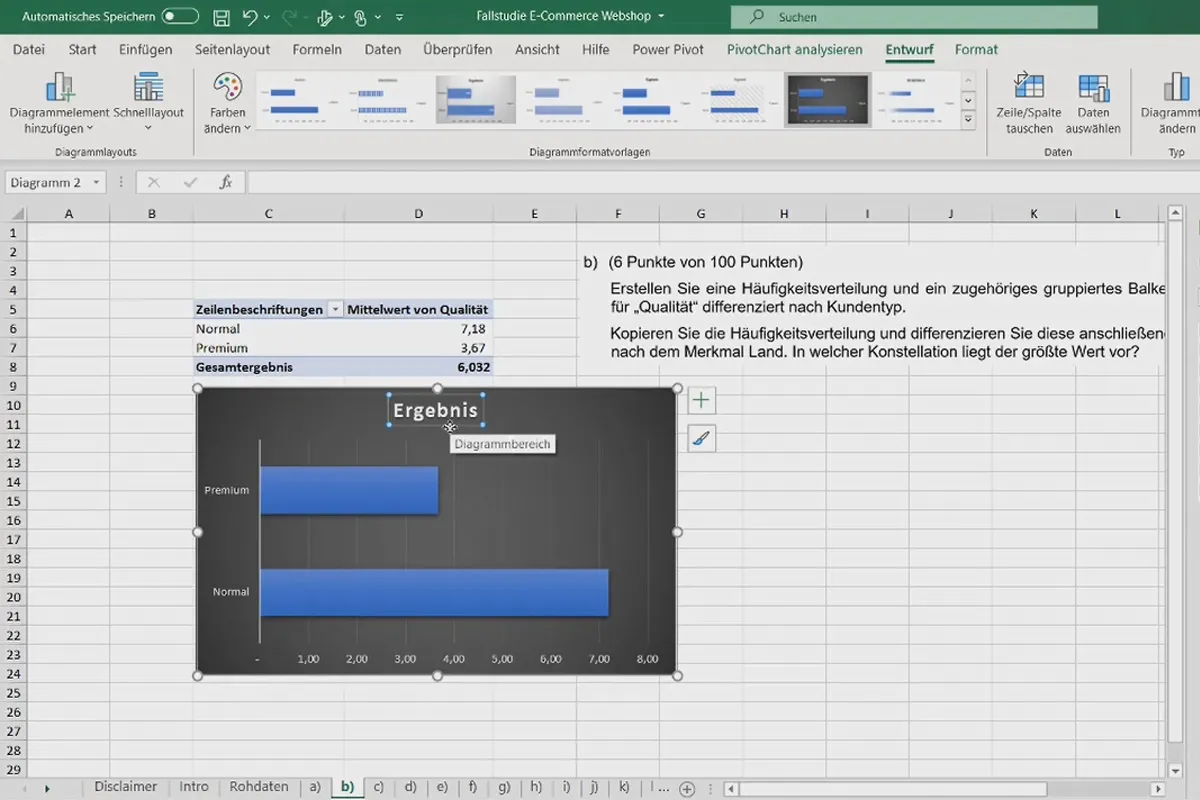
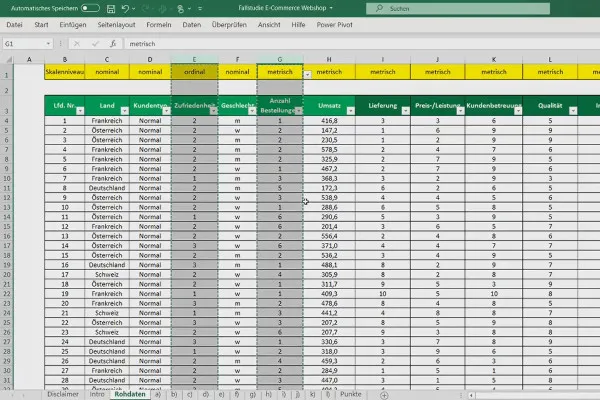
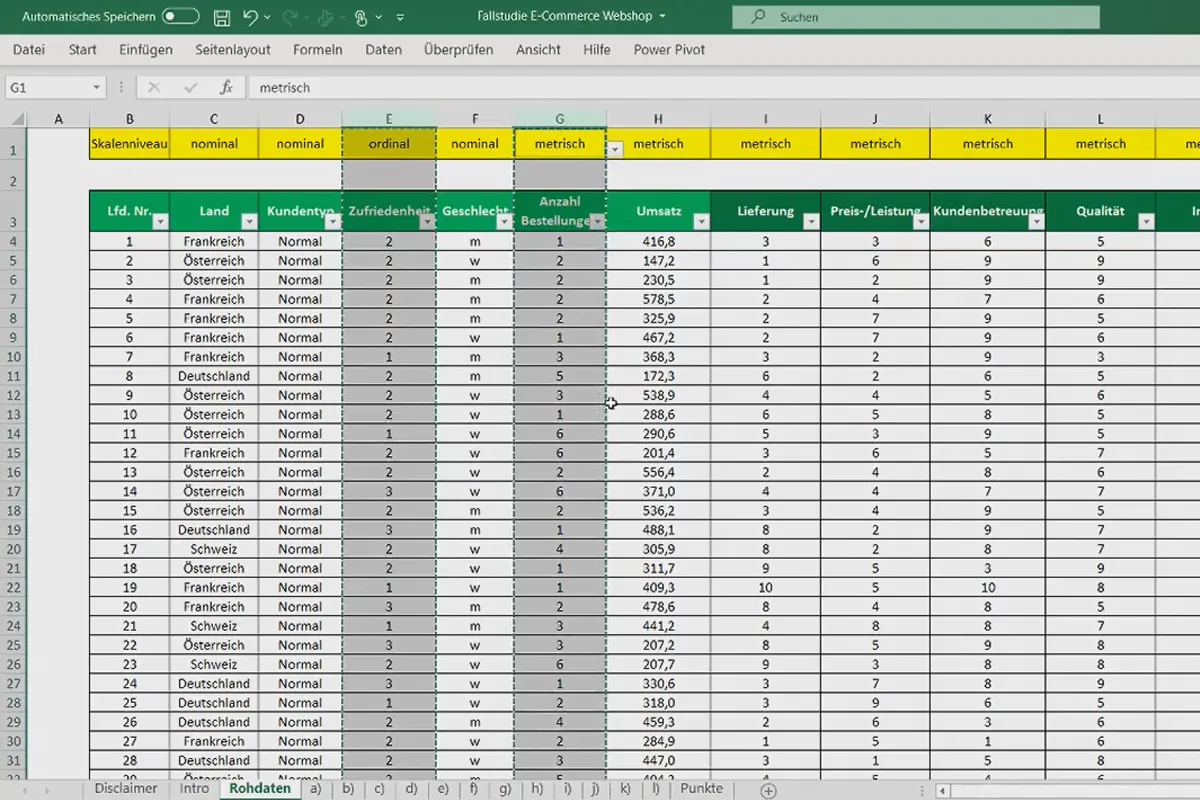
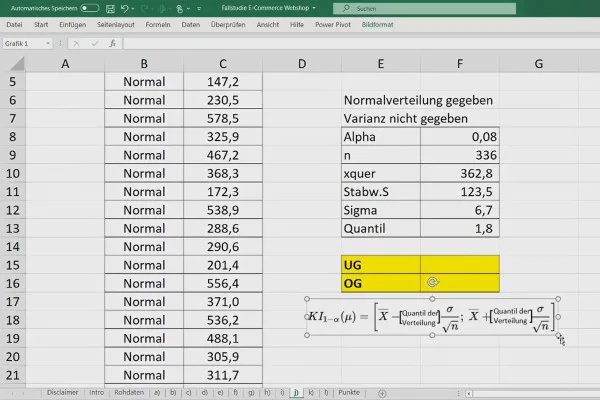
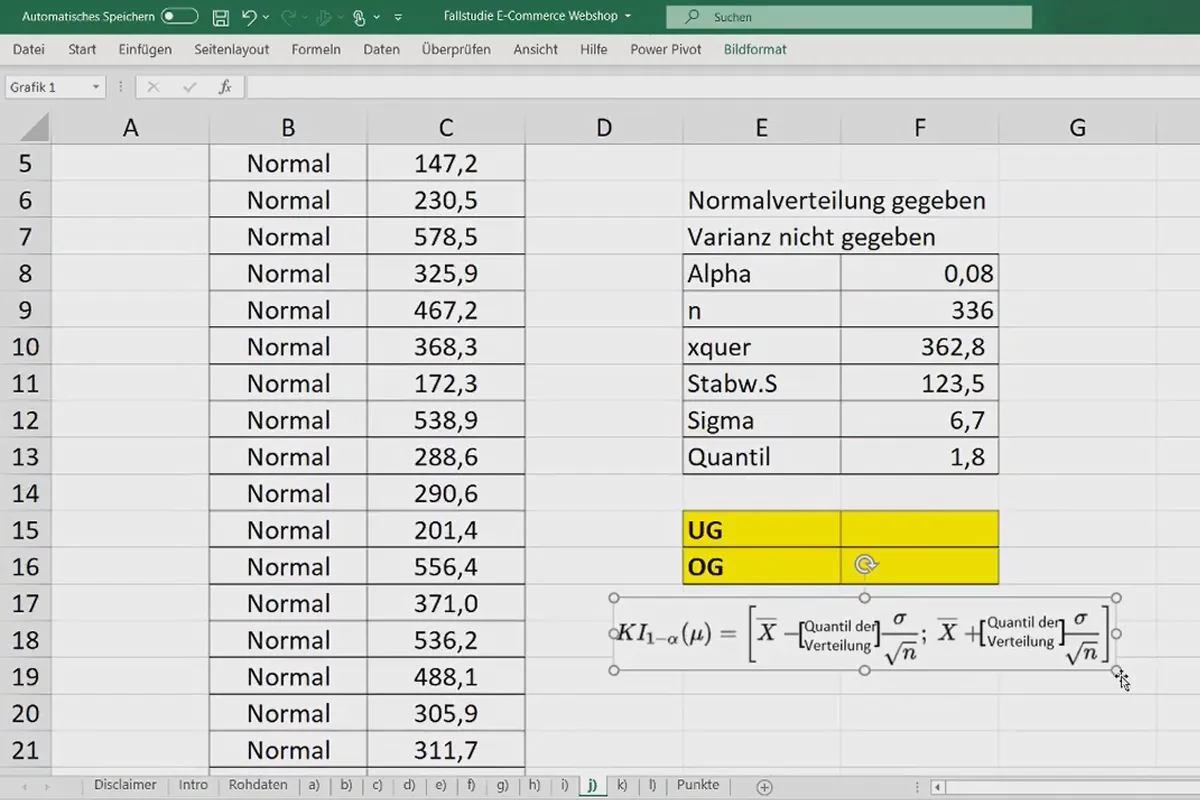
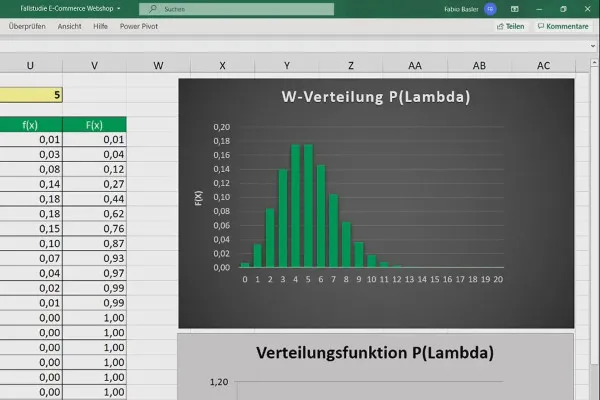
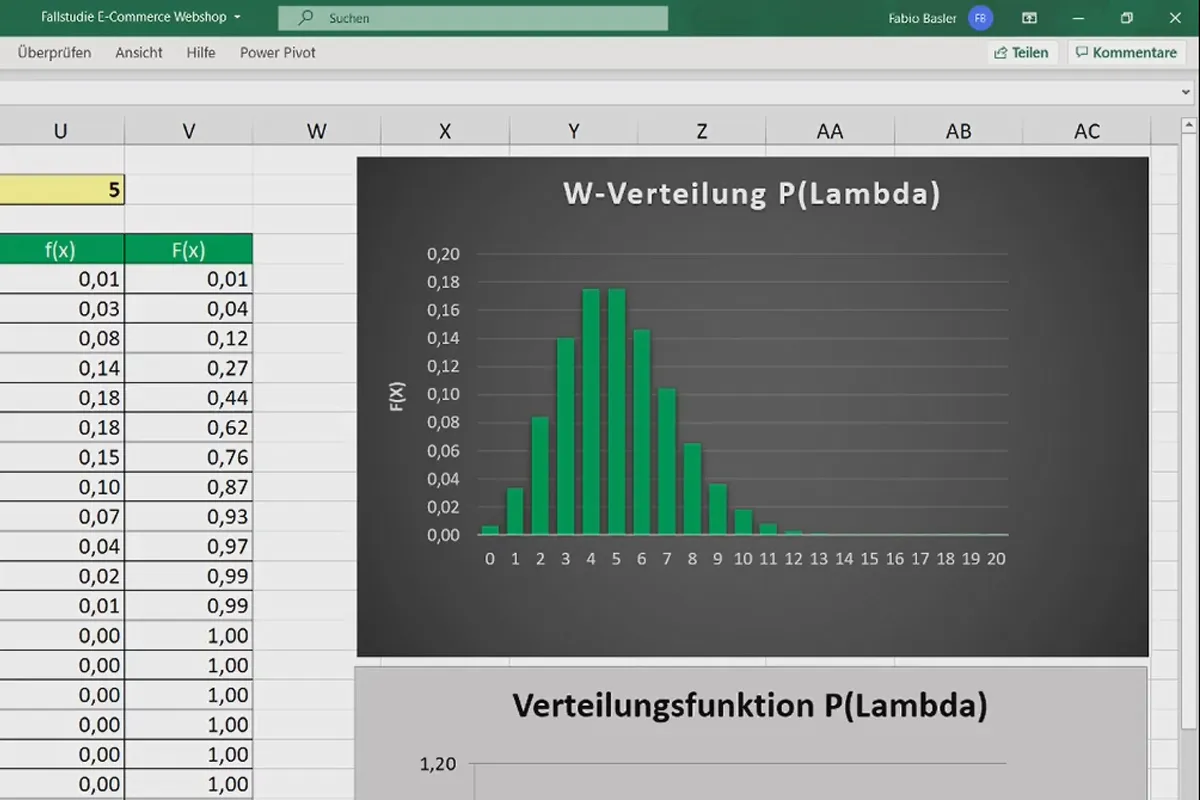
The practical scenario of the training: A survey was conducted for a web store. Your task: You evaluate the results of the survey using pivot tables, time series, regression and rank correlation, among other things.
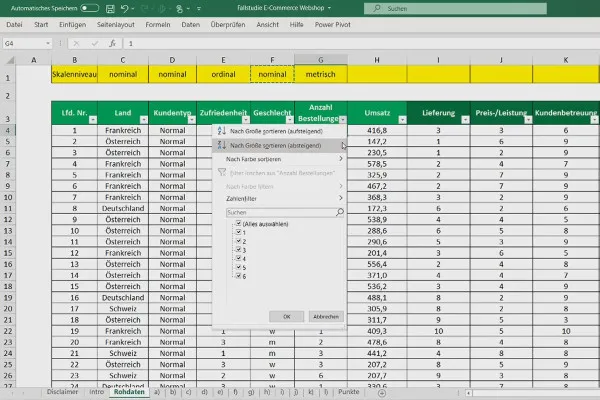
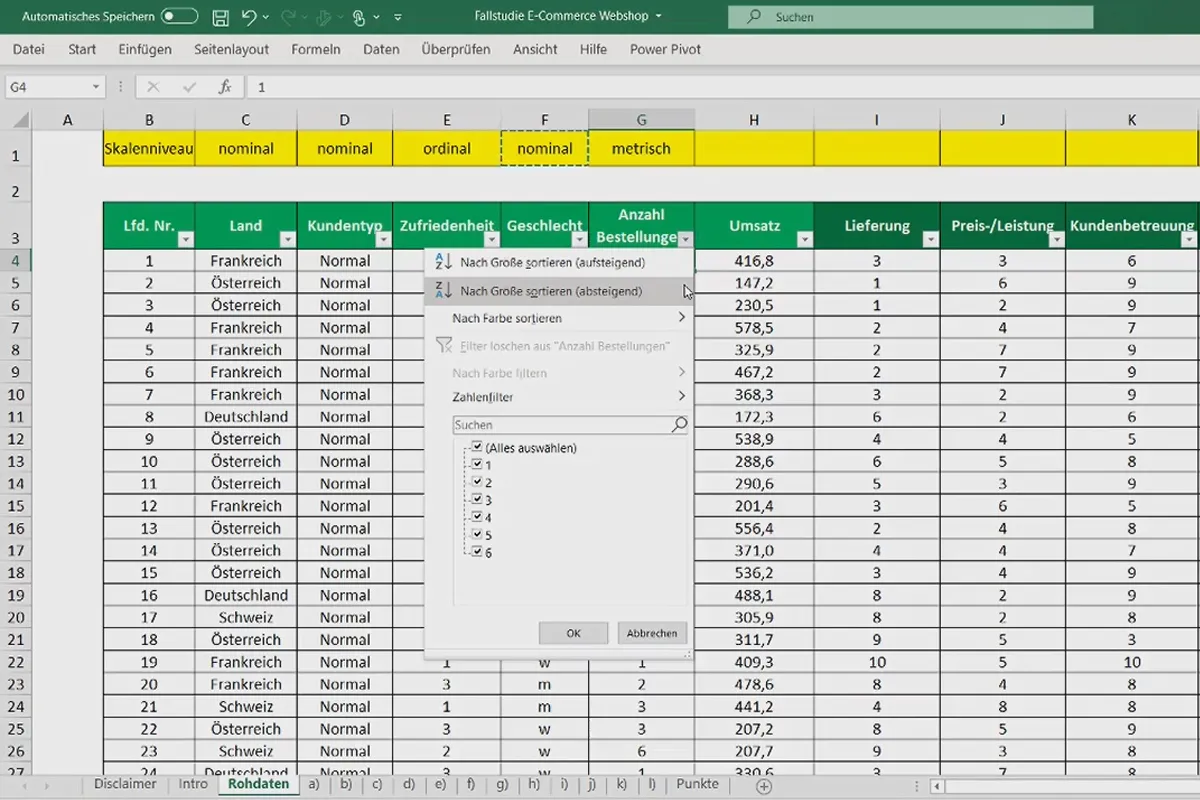
You can follow each individual step yourself during the training using the raw data table provided in Excel . You will receive the corresponding solutions for each task. A PDF summary and a clear collection of formulas also support you in learning and later applying your knowledge in practice.
Excel practice: excellent for your studies - perfect for your job!
Is Excel your professional companion? In your job, do you constantly come across data that you need to analyze? Then make your work easier by acquiring knowledge in the areas of correlation, regression and stochastics . As a result, you will find important key statements for optimized processes in your company in your tables.
This course is also ideal for students. Develop a practical understanding of descriptive and inductive statistics - ideal for consolidating your learning content and preparing for exams, for example.
Start Excel, open the raw data and start analyzing directly
During the course, you will learn how to use descriptive and inductive statistical methods . Among other things, the following aspects will be covered:
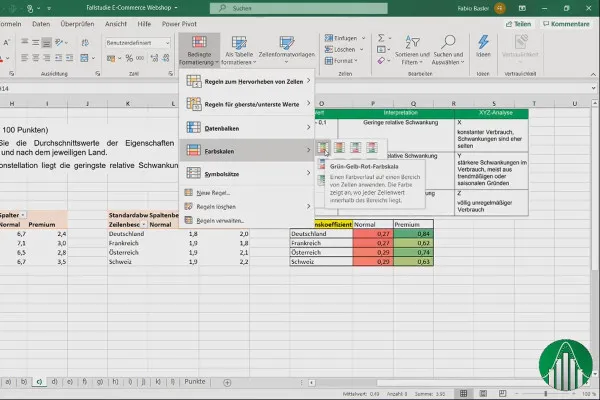
- Perform multidimensional data analysis with pivot tables.
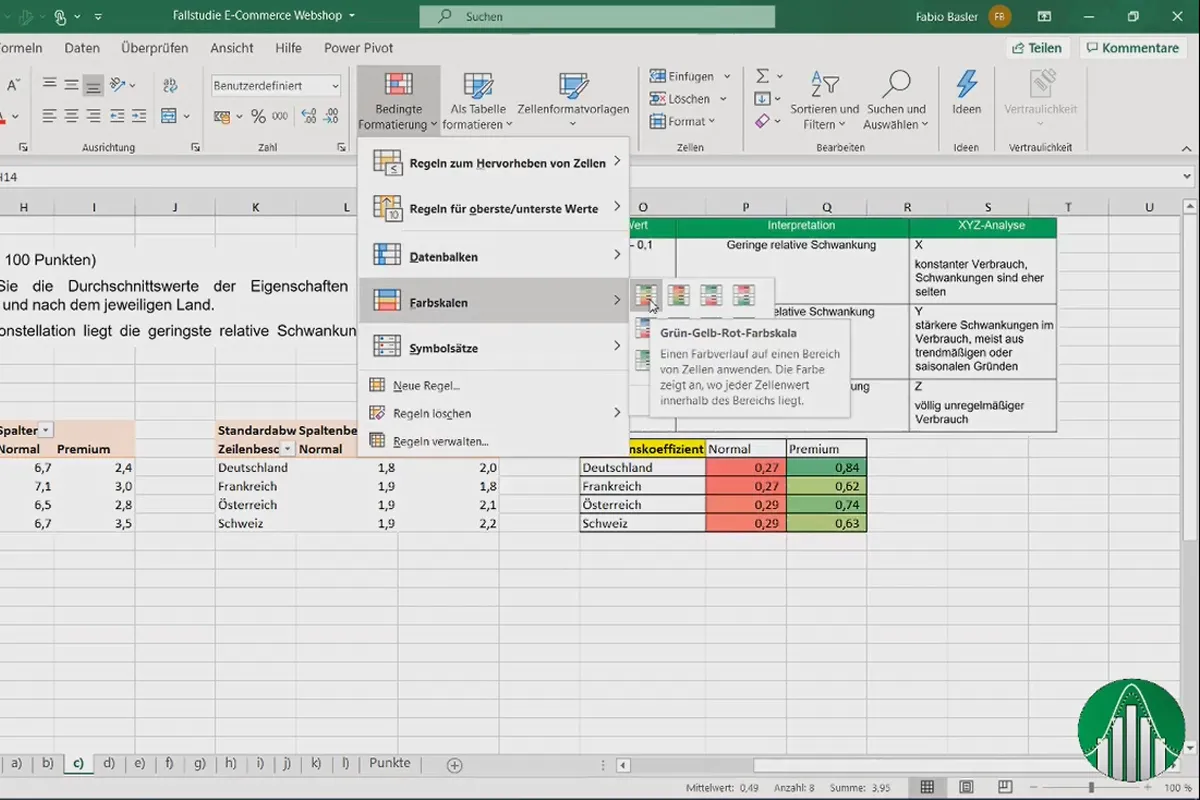
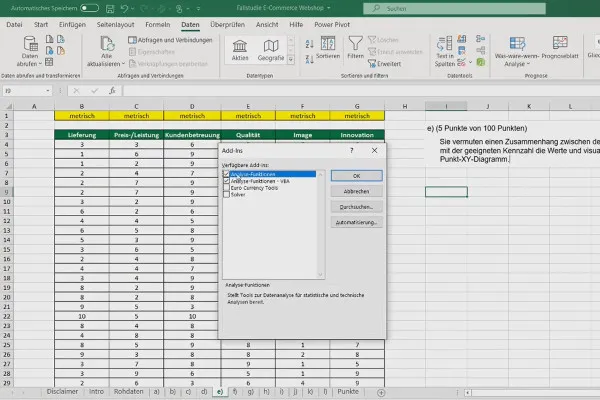
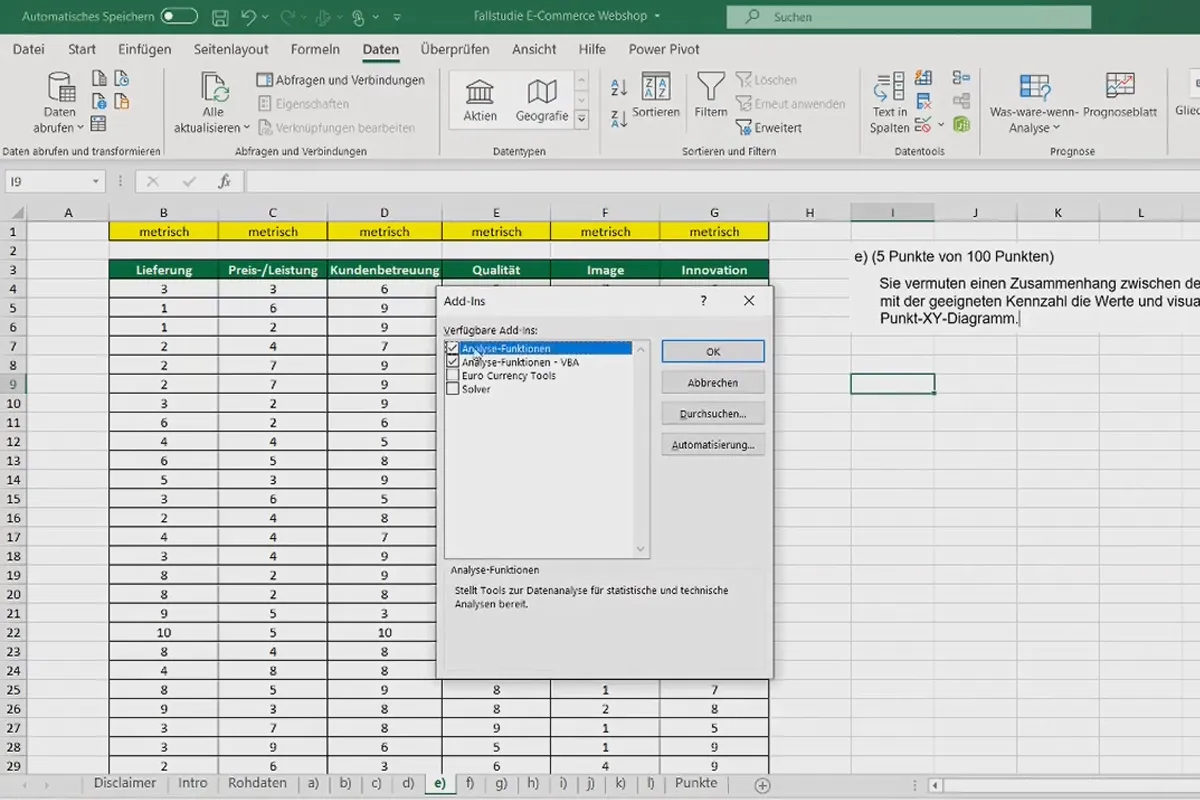
- Create an outlier analysis and a correlation matrix.
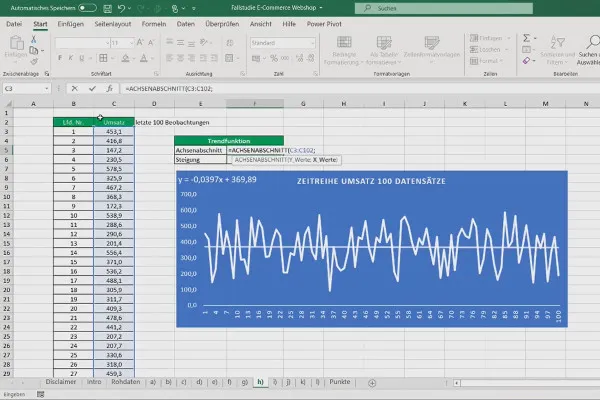
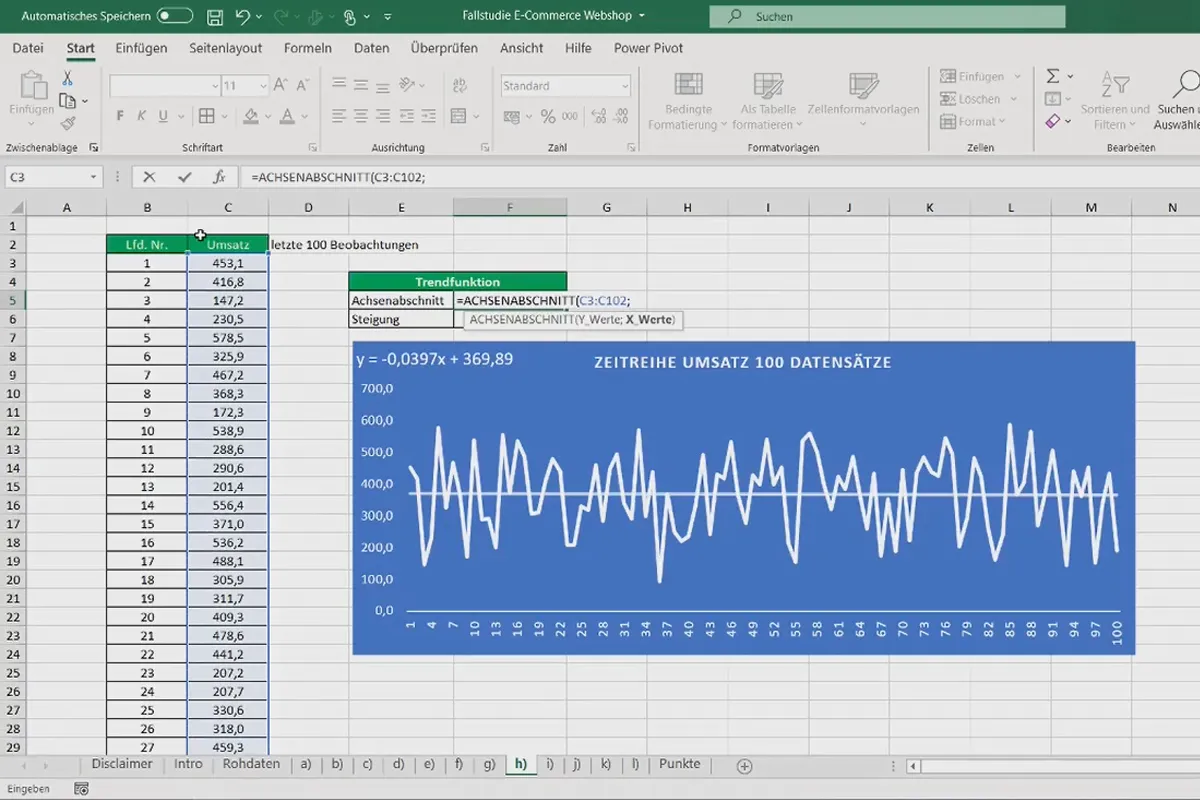
- Learn how to graph time series and create trend functions for forecasts.
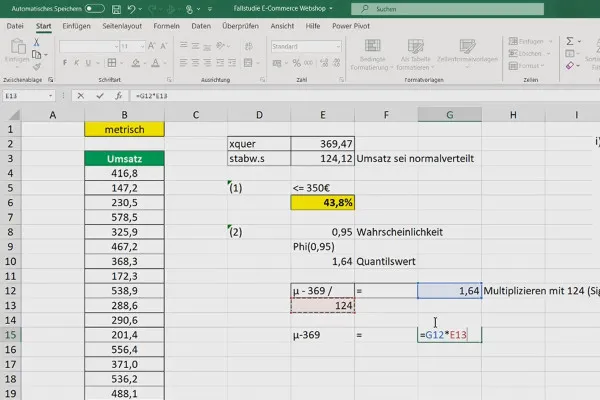
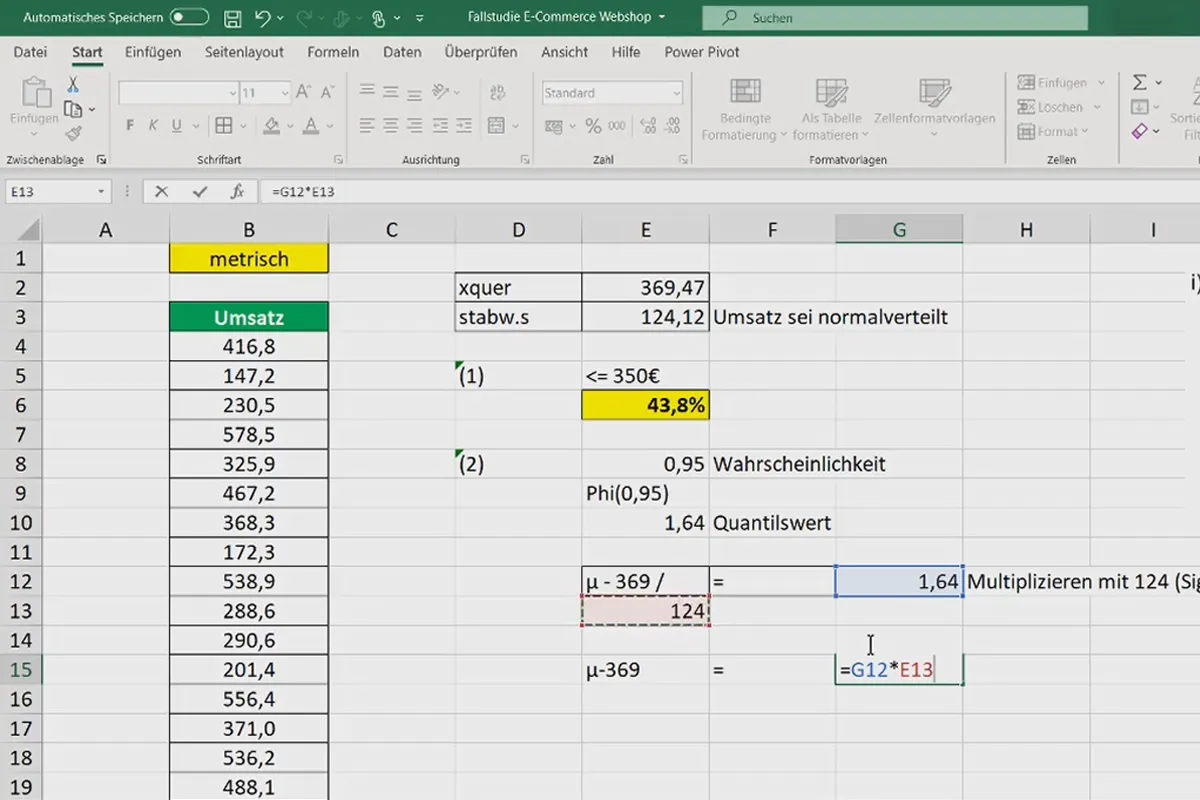
- Calculate a rank correlation and probabilities.
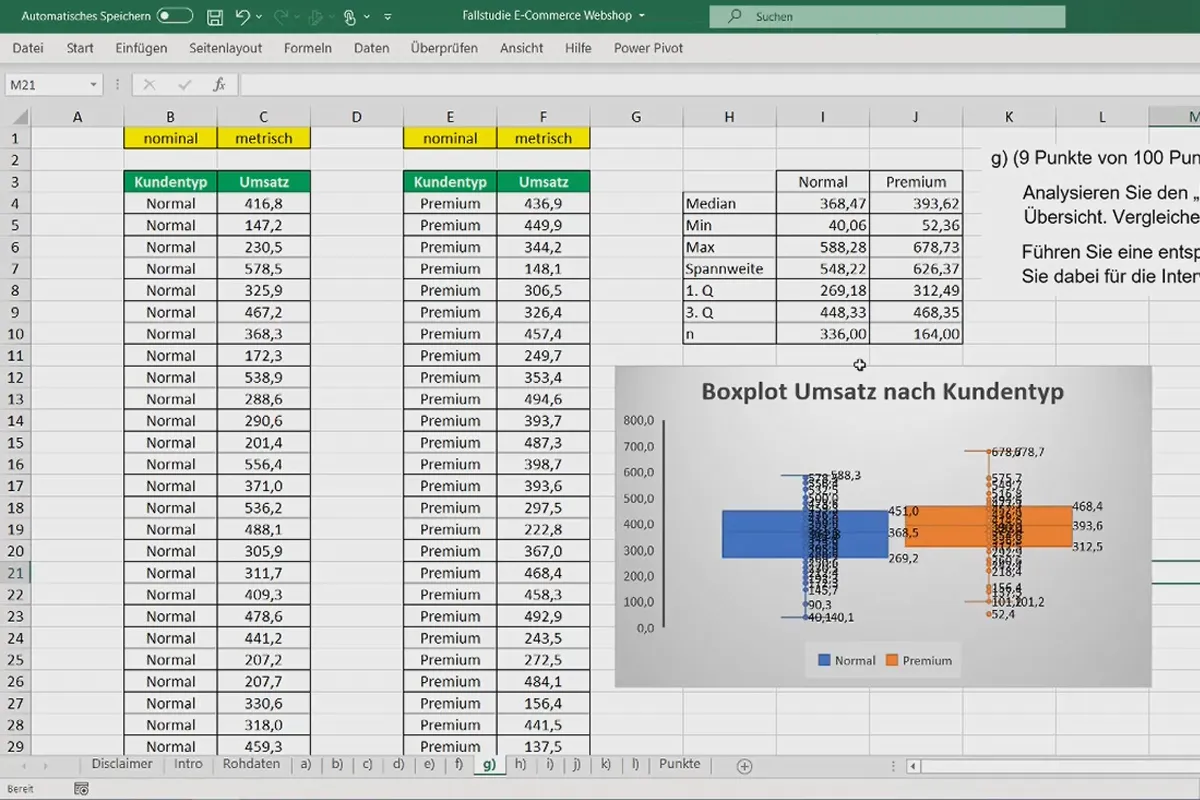
- Model a linear functional relationship and graph a box plot.
Other users are also interested

With flyer, business card & Co.

From the business card to the roll-up
How to build trust with customers
This saves you time and effort!

Effectively create modern slides
Faster results in your tables

Fully equipped from flyer to roll-up

For complete business equipment


