Data analysis with Excel for business and sales (video course)
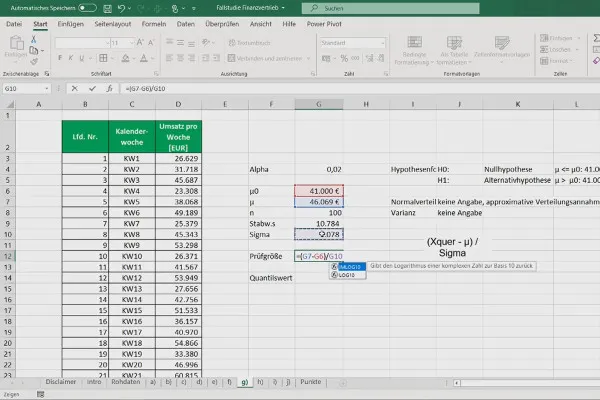
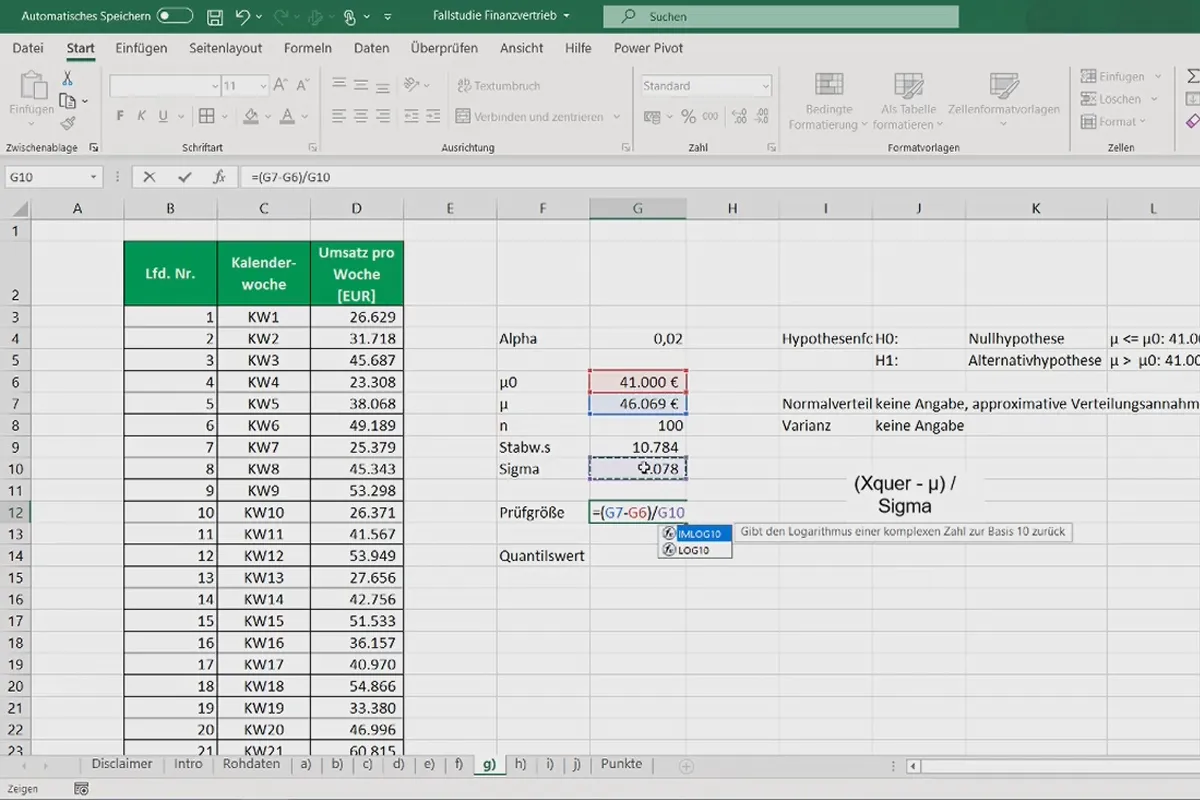
What works? Where is there room for optimization? Find answers to these questions by correctly analyzing your figures in Excel. Using a practical case study from the financial business and sales sector as an example, you will learn how to apply important methods of inductive and descriptive statistics in this course. One training course, two hours, including exercises - trainer Fabio Basler will teach you how to read your data correctly!
- Two-hour video course on data analysis with Excel using the example of financial sales
- Practical learning based on tasks, solutions and a points system
- Descriptive and inferential statistics: How to identify optimization potential in your figures
- Among other things: Frequency distribution, correlation matrix, regression analysis, 1-SP test, confidence interval
- Included: Excel raw data, collection of formulas and a summary
On the road to success! Recognize both strengths and weaknesses in your data to set up your business even better. Be smart now and start training right away!
- Usable with:
- content:
2 h Video training
- Licence: private and commercial Rights of use
- Bonus: including working material
Introduction
Descriptive case study part
Inductive case study part
Details of the content
Optimization is the order of the day? Then start Excel and your data analysis ...
Some things feel good, some feel bad. But how is your company actually doing? Learn important methods of descriptive and inductive statistics now so that you can work with clear facts in the future. Start this two-hour video course on data analysis with Excel now !
Work materials included: Practise data analysis with Excel straight away
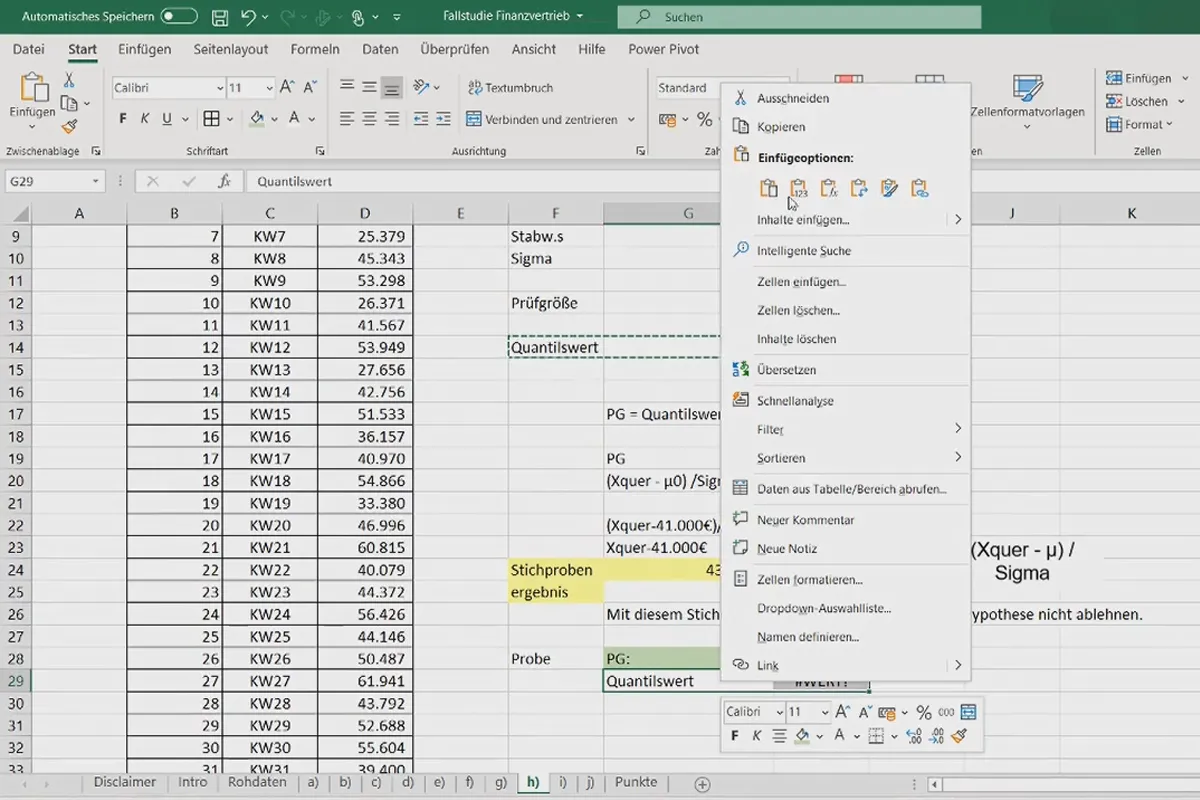
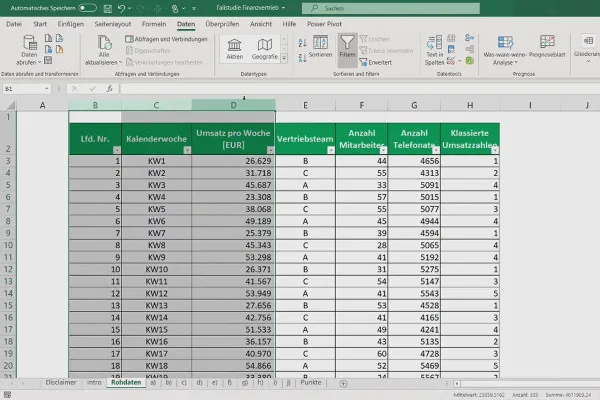
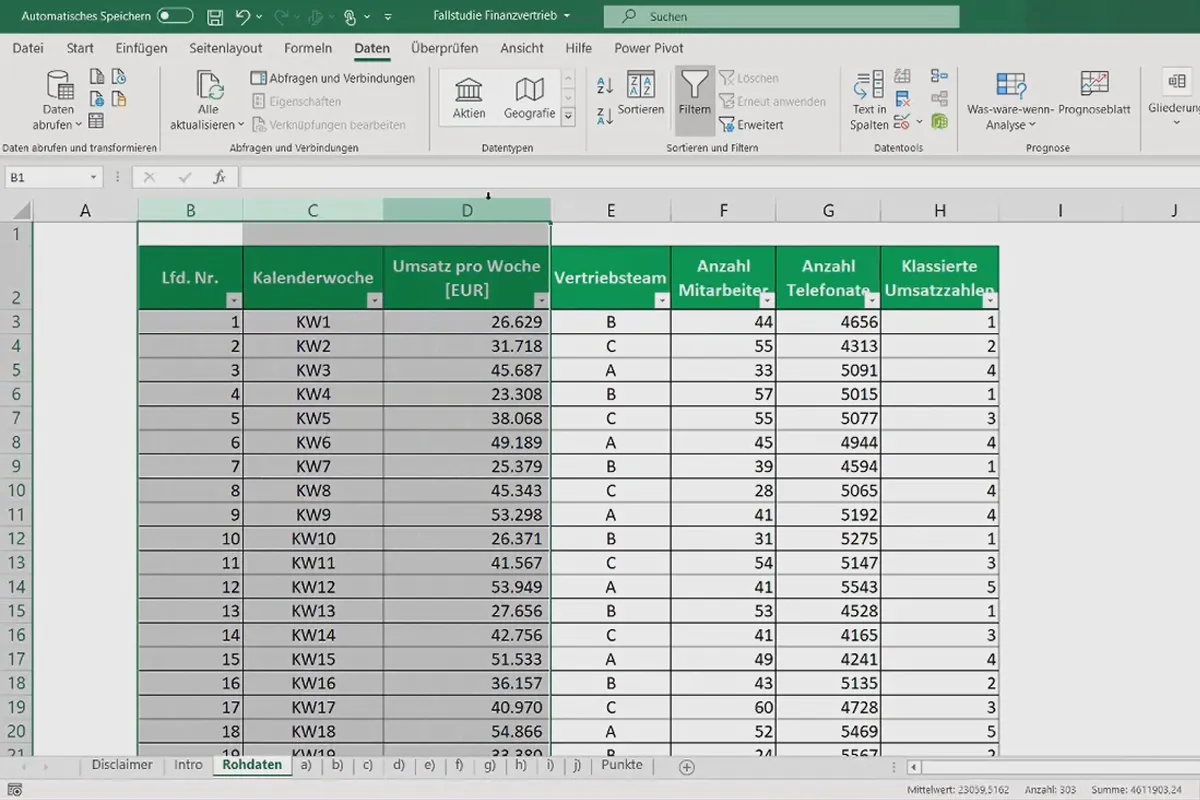
The training lets you work hands-on right from the start. Open the Excel spreadsheet provided with all the raw data you need to practise and understand what you've been shown. If you get stuck, pause the tutorial, go back a step or take a look at the included formulas and summary. A points system helps you to monitor your own learning success. In this way, what you have learned quickly turns into knowledge - which you can use for your own purposes tomorrow.
Ideally suited for controlling, for students and all optimization enthusiasts!
Whether for your studies or your job - this video course is aimed at anyone who sees much more in Microsoft Excel than simple lists and spreadsheets. Link your data skillfully and methodically until you can derive target-oriented recommendations for action from it.
Do you want to improve your company's sales? Are you looking for an effective way to get into controlling? Do you see huge columns of figures as the key to successful optimization? - Then welcome to this Excel training course!
A real-life example: data analysis in financial sales
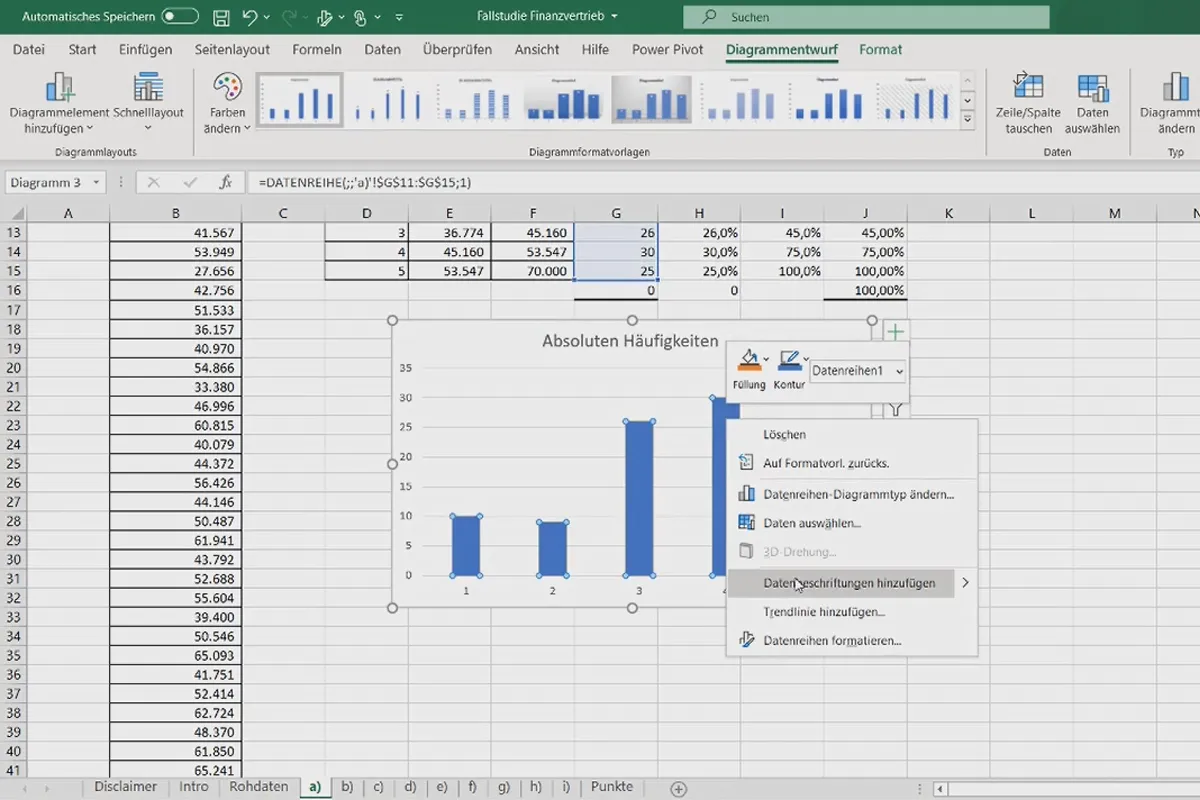
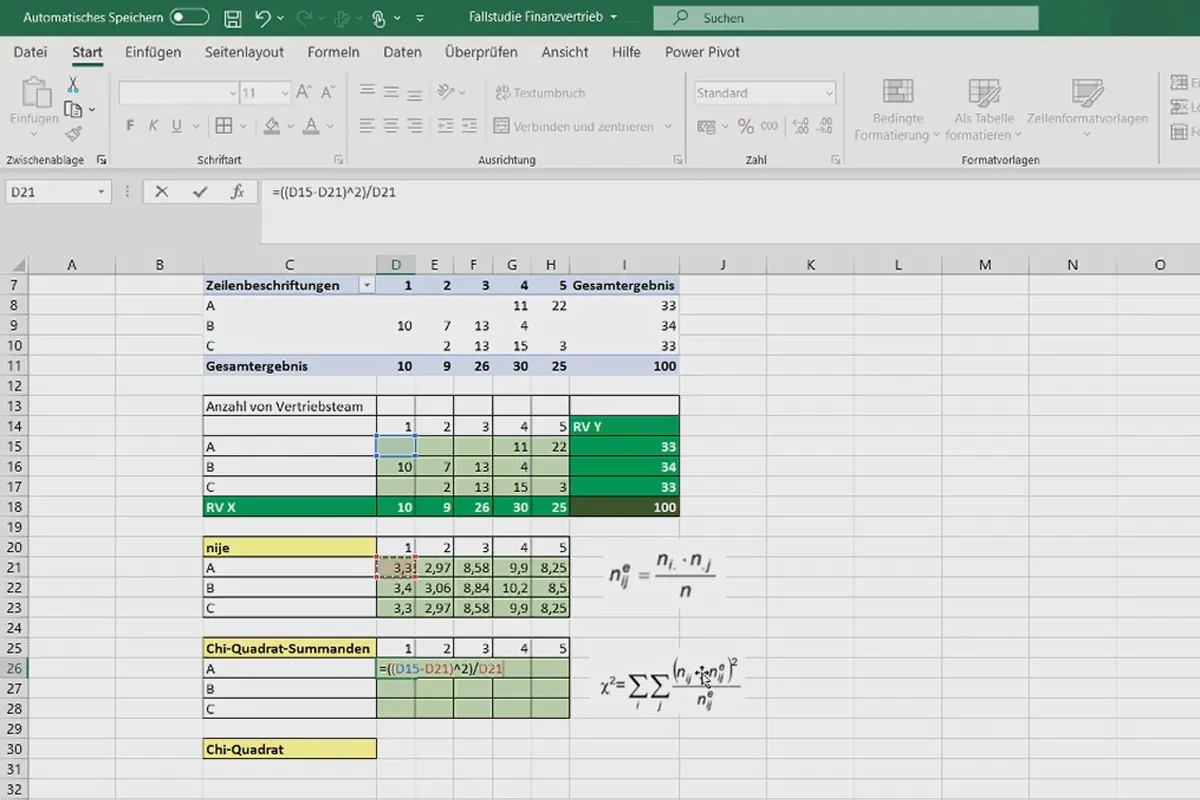
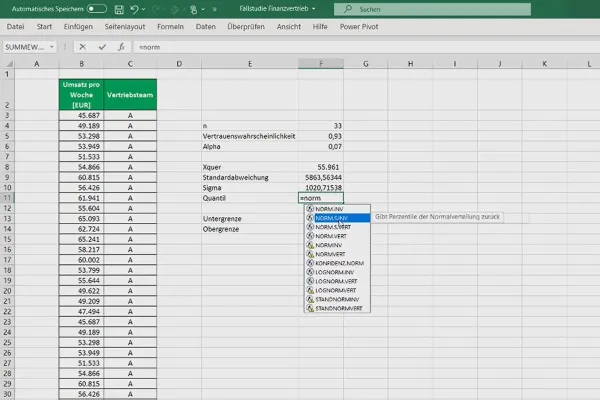
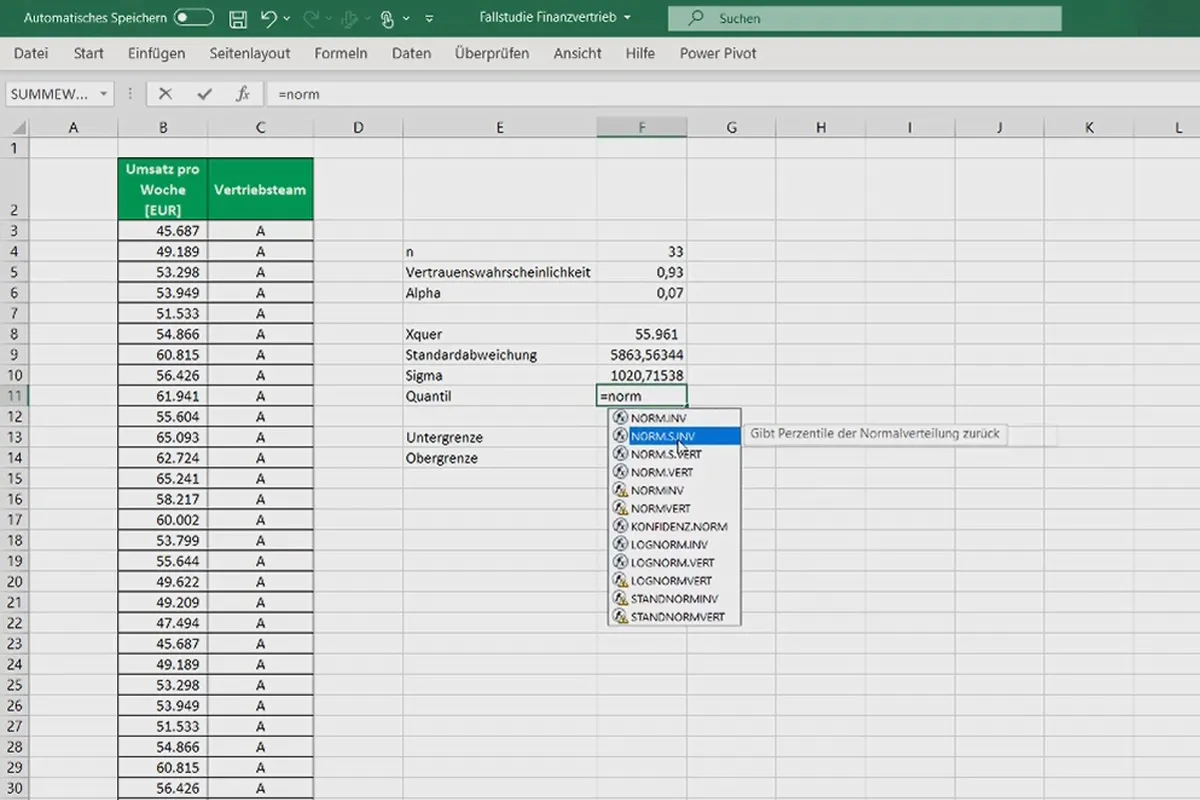
The case study on which you will carry out your data analysis exercises relates to an investment bank in which three teams are responsible for sales. You now have various data from the last 100 weeks that you need to analyze. Your learning curve towards comprehensive data analysis includes the following aspects:
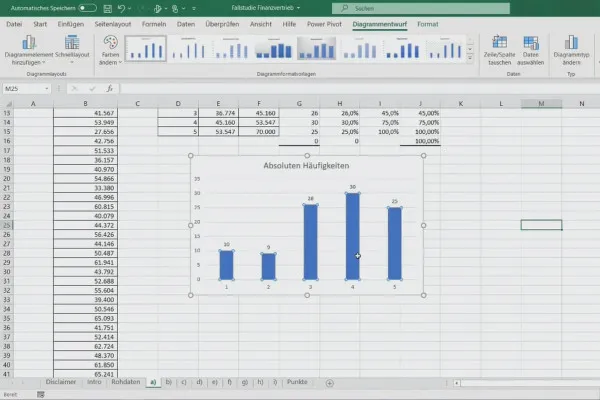
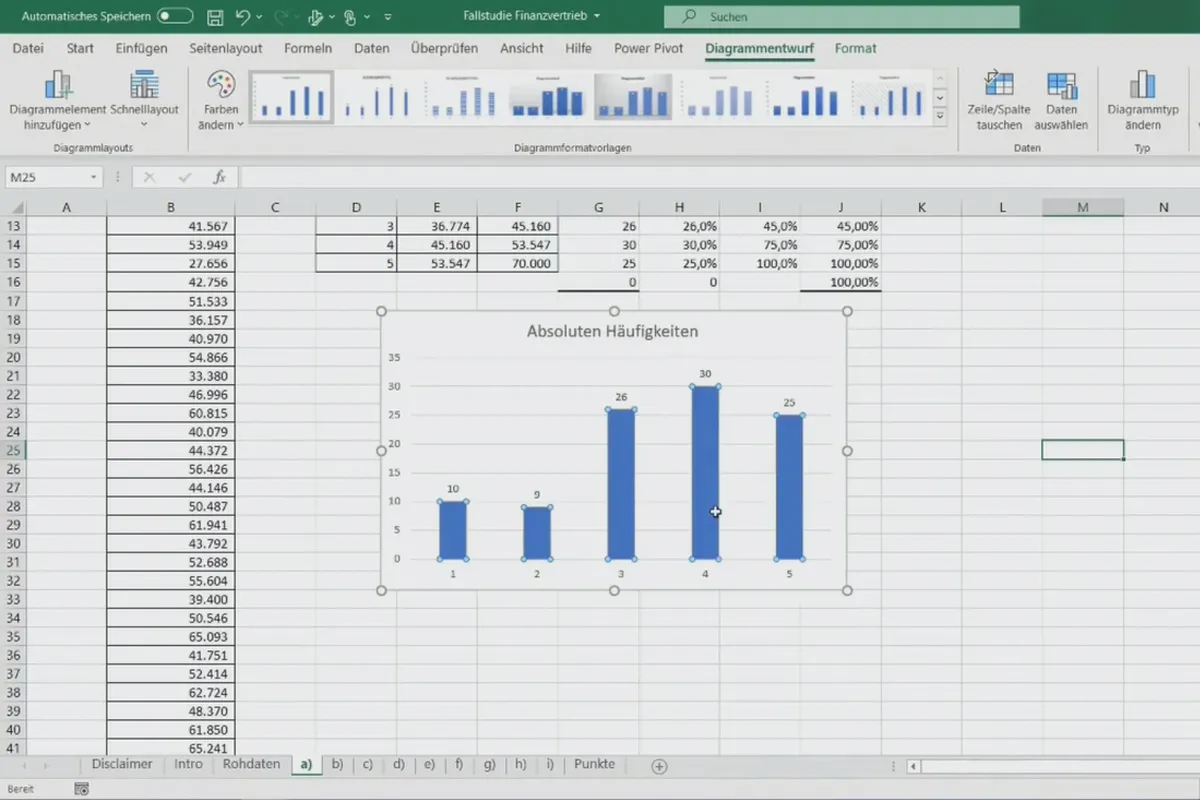
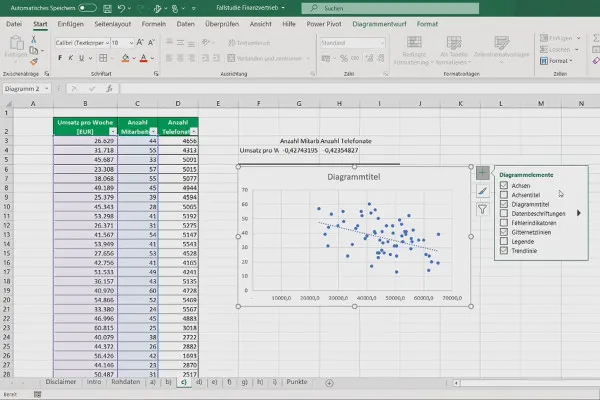
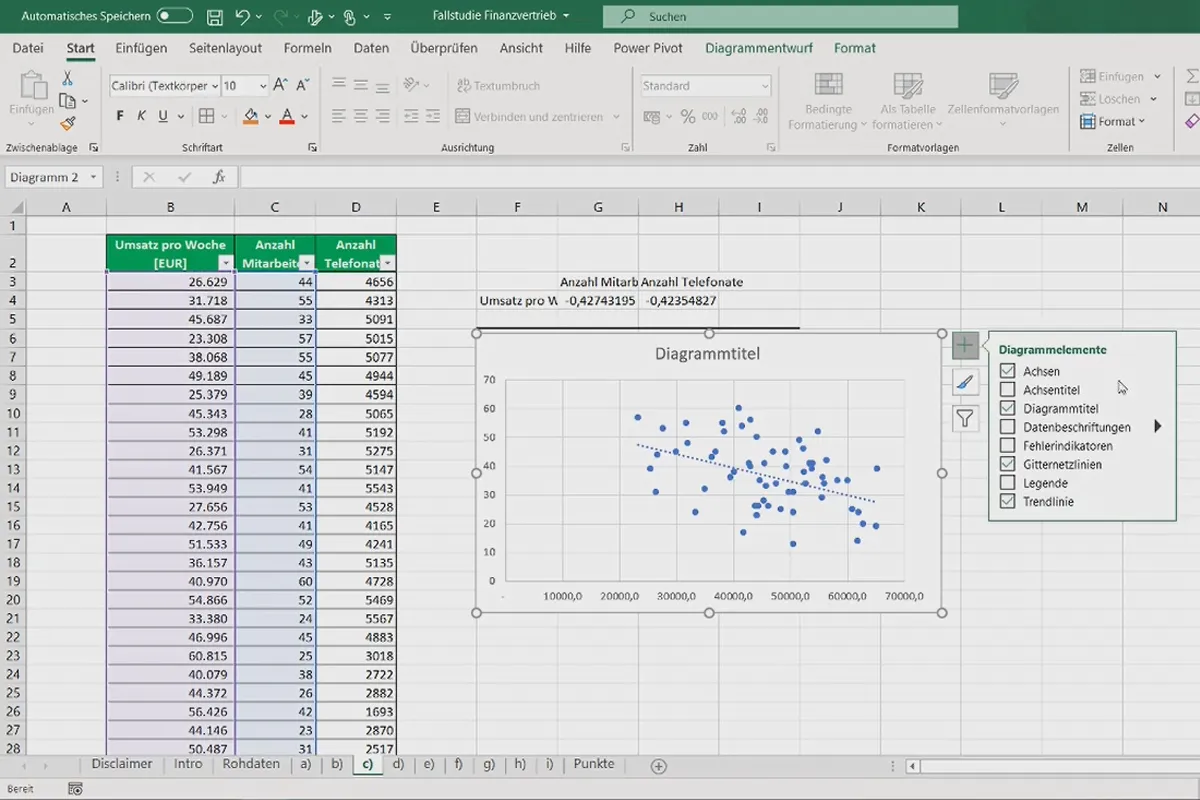
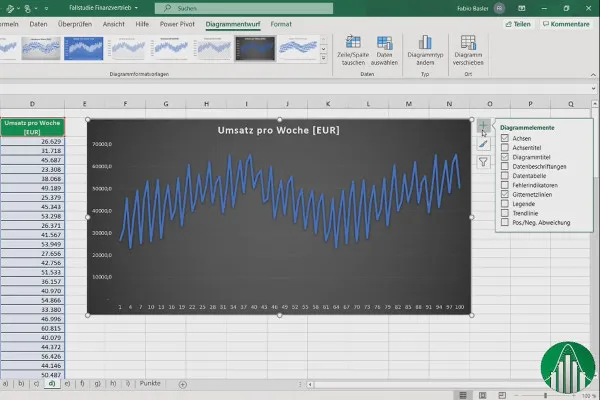
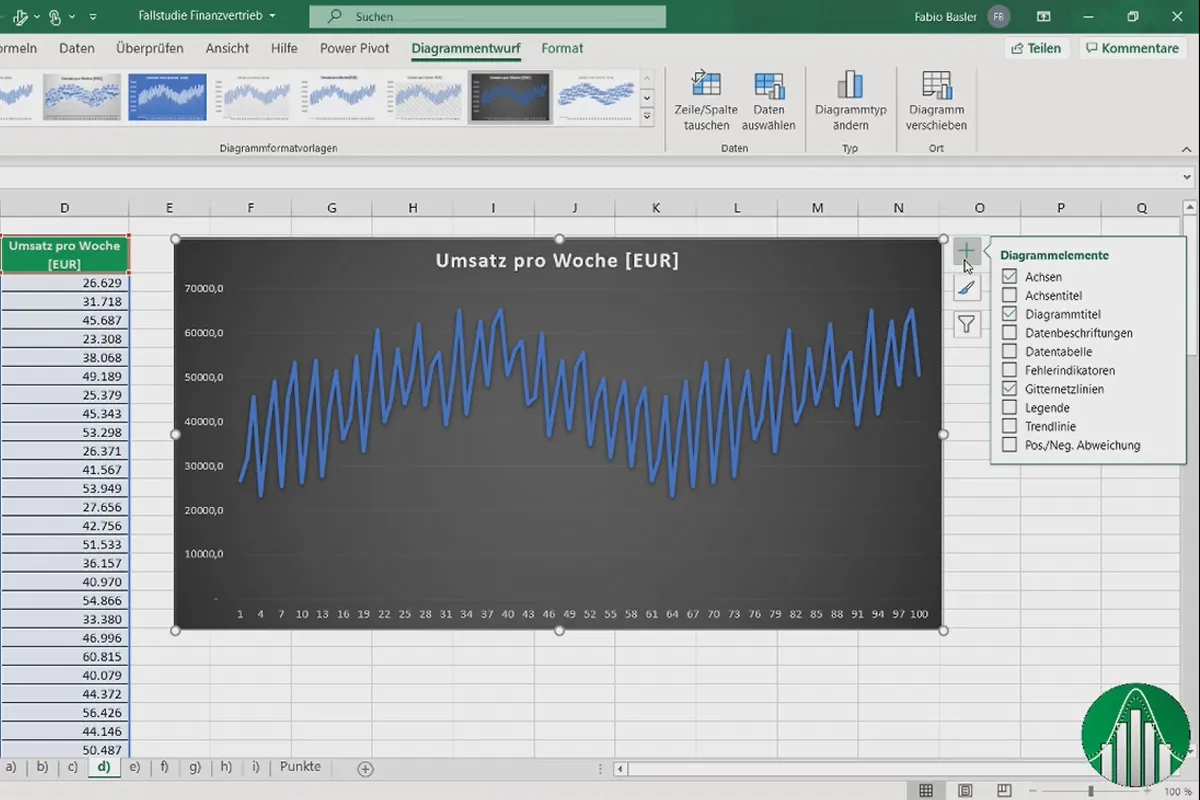
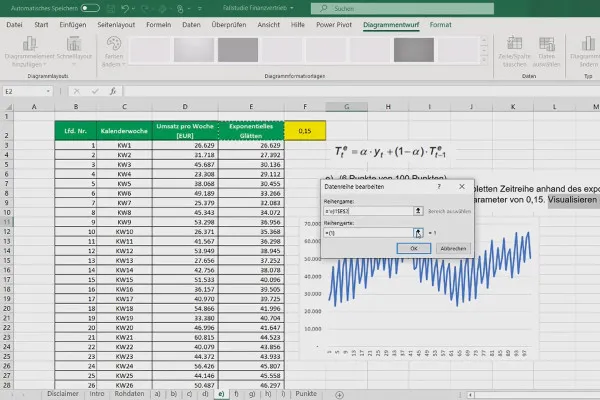
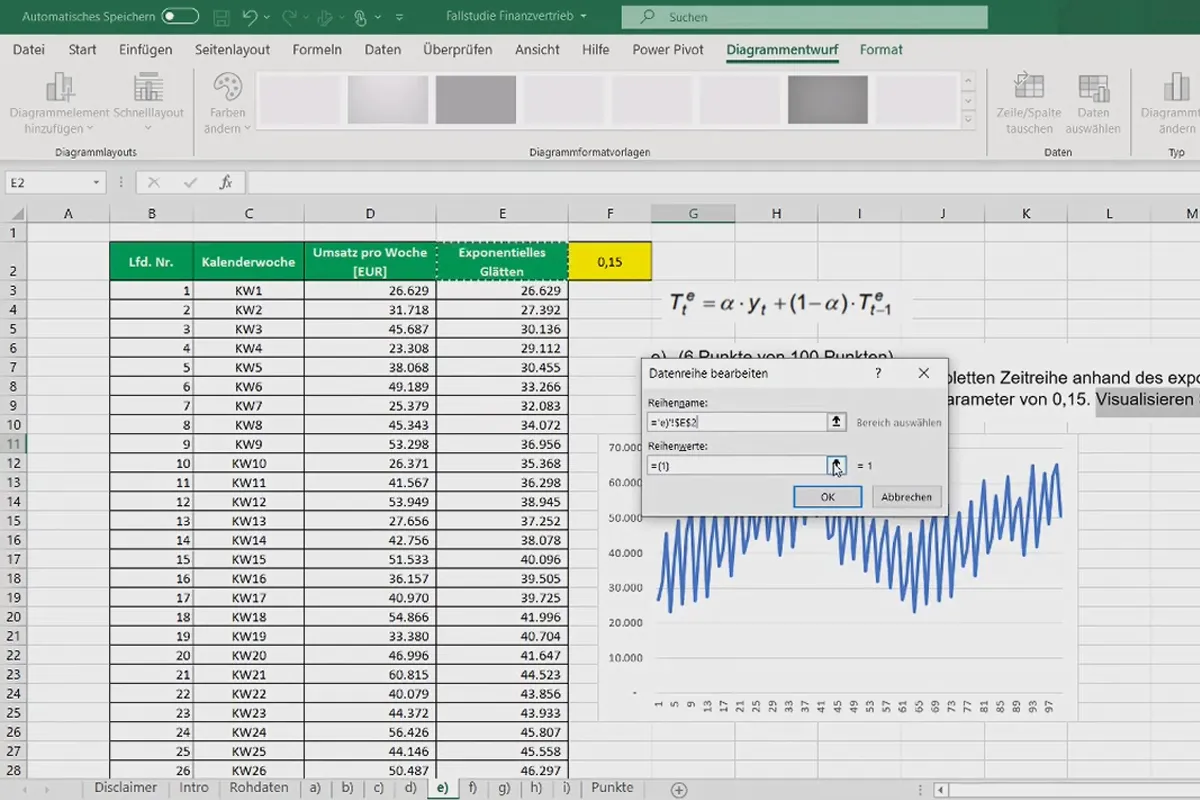
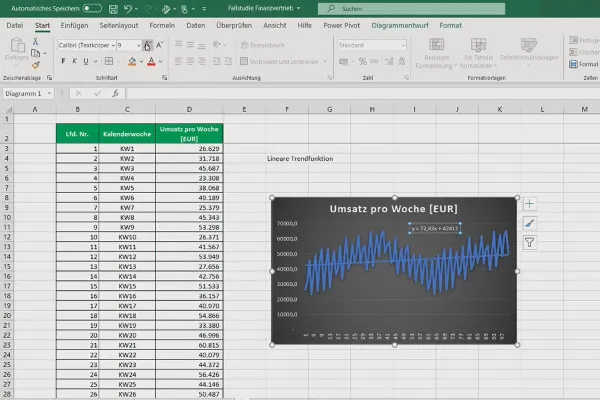
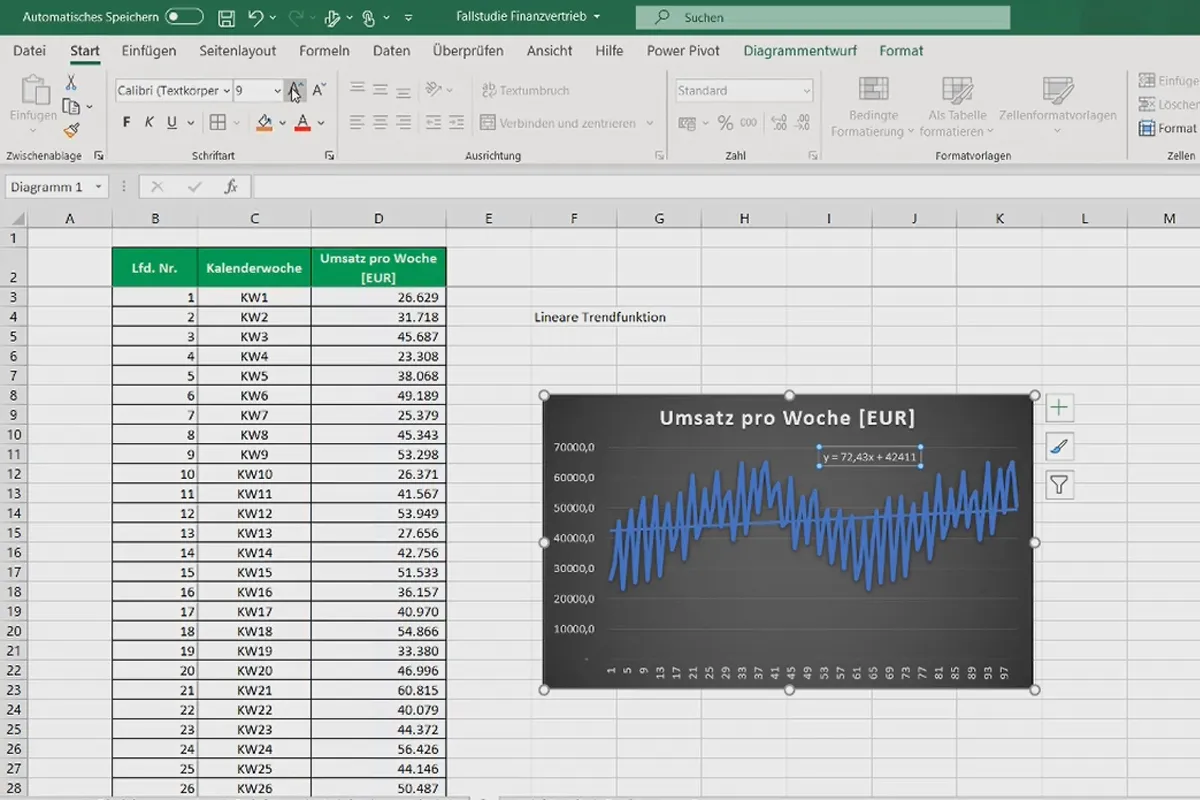
- Descriptive statistics: classification of data, frequency analysis, distribution functions, correlation analysis, regression analysis, visualization of time series, trend determination after exponential smoothing, determination of trend function
- Inductive statistics: statistical parameter tests, 1-SP test case for the expected value, 2-sided confidence interval, two-sample F-test
Other users are also interested

Effectively create modern slides
How to build trust with customers

Fully equipped from flyer to roll-up
Faster results in your tables
Create, set up & optimize online advertising

For complete business equipment

With flyer, business card & Co.
This saves you time and effort!


