Statistics with Excel - learn and practice in practice
The goal is to reach 100 points! Will you accept the challenge? Start this four-hour Excel course by Fabio Basler. Learn important methods of descriptive and inductive statistics using three practical case studies. And: test yourself with the help of the included work materials! What you learn now, you can apply directly in your studies and job tomorrow.
- Statistics with Excel using three practical case studies
- Practical learning and practicing: point system for learning control, collection of formulas, raw data and solutions
- Descriptive and inductive statistical methods examined in detail in over 4.5 hours by Fabio Basler
- Among other things: Time series, forecasts, distribution tests, mean and dispersion, normal distribution test
Data sets with dozens of parameters and hundreds of values? With this training, you can manage them and draw valuable insights from them ... get started right away.
- Usable with:
- content:
5 h Video training
- Licence: private and commercial Rights of use
- Bonus: including working material
Introduction
Case Study Portfolio Management
Case study automotive supplier
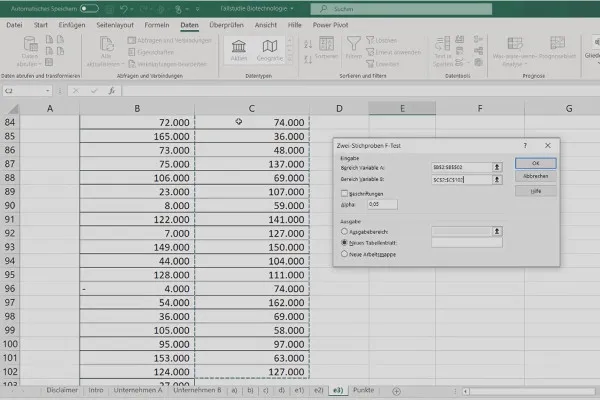
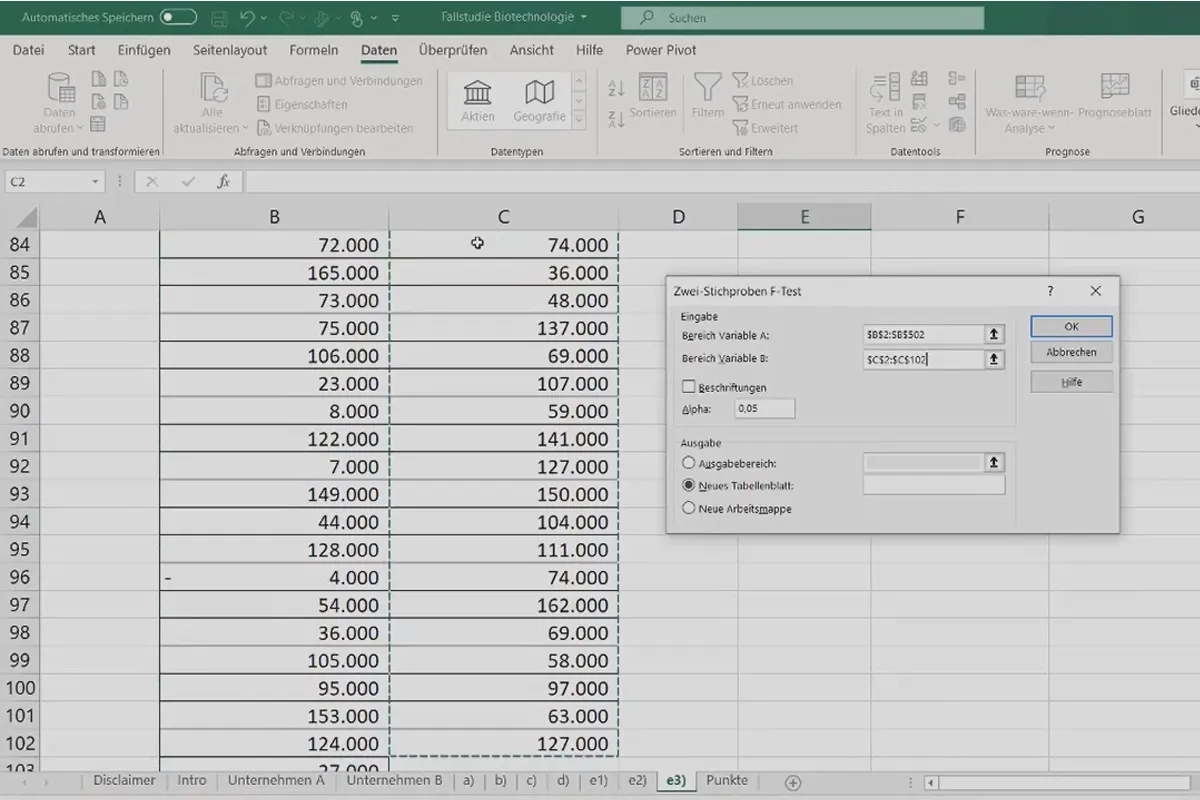
Case study biotechnology
Outro
Details of the content
Perfect for your studies and job: Statistics with Excel using three case studies
Do your university exams require knowledge of statistics? Would you like to uncover even more optimization potential for your company in your job? Then you've come to the right place! Firstly, you will learn how to apply important statistical techniques . And secondly, you'll get hands-on practice from the very first tutorial. Start this Excel course now !
Learn and practise with practical exercises
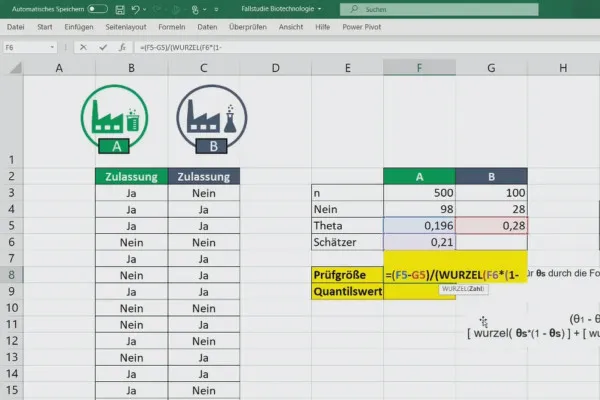
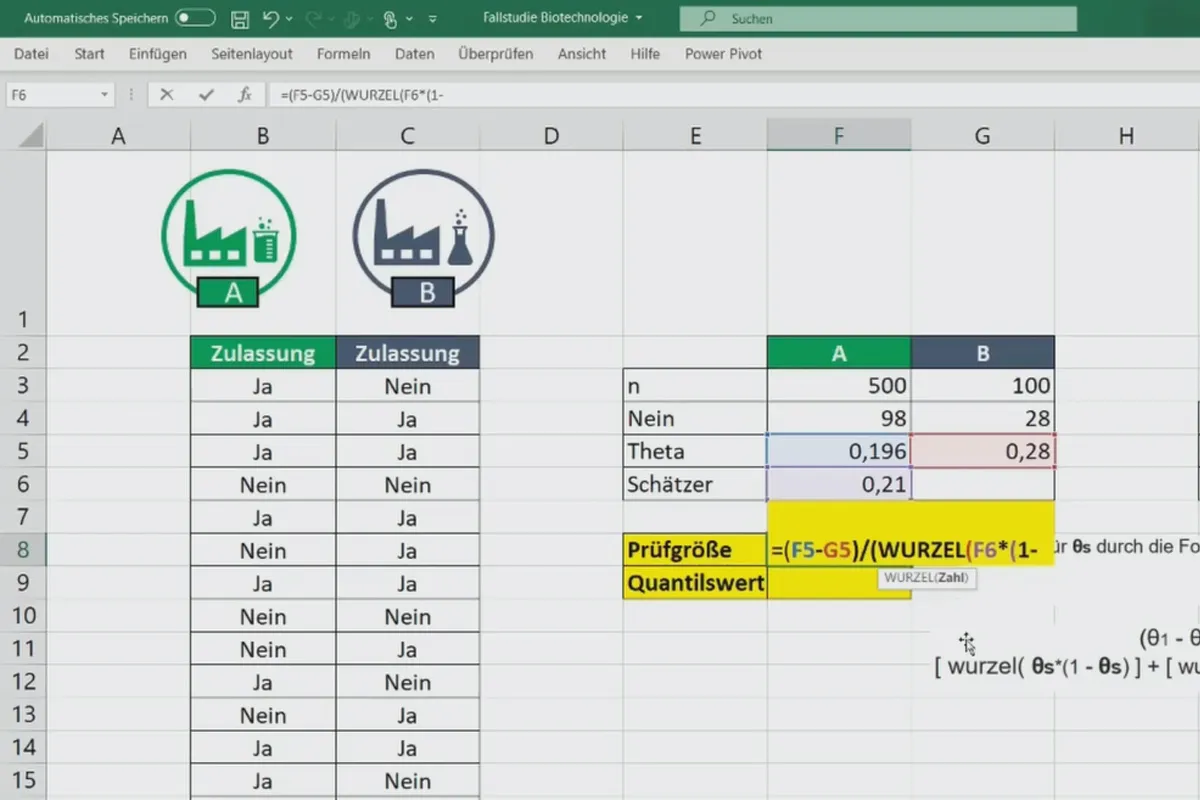
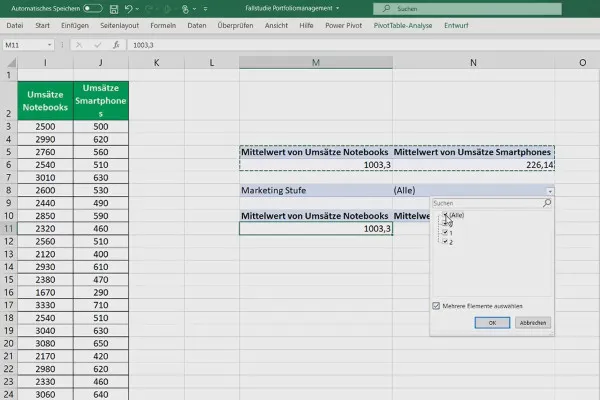
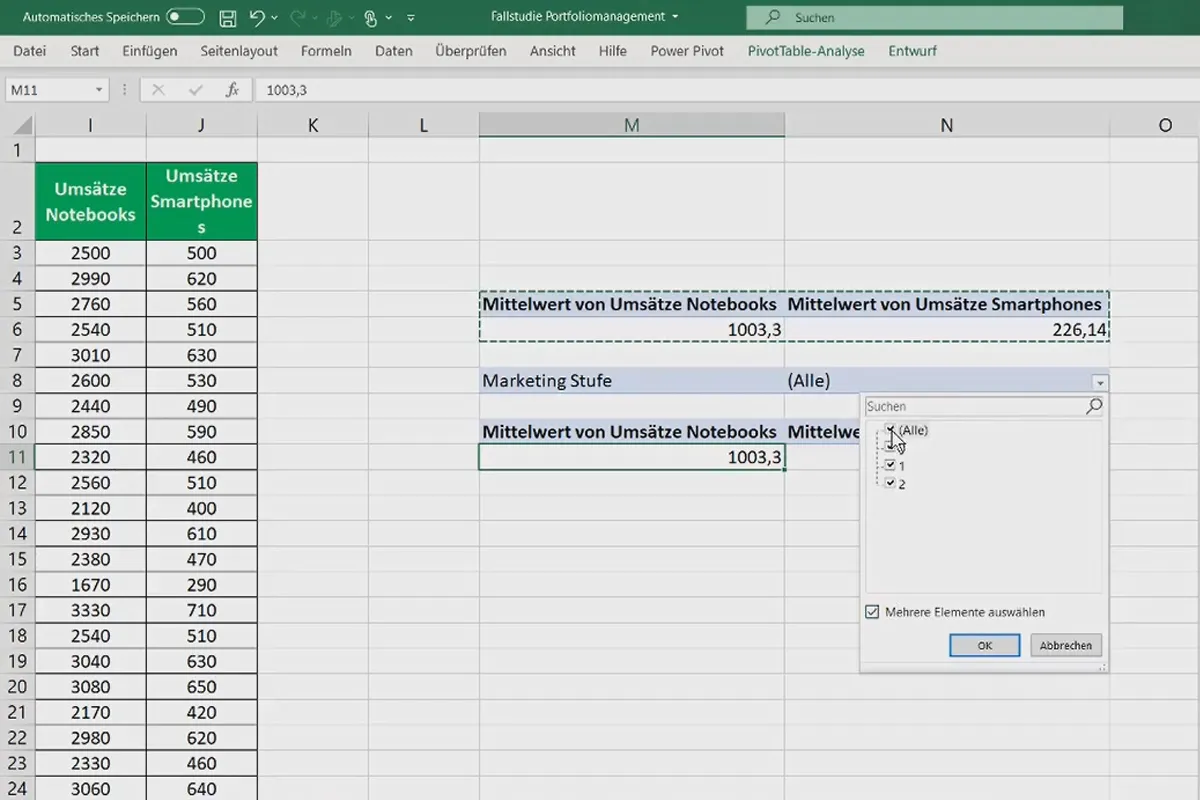
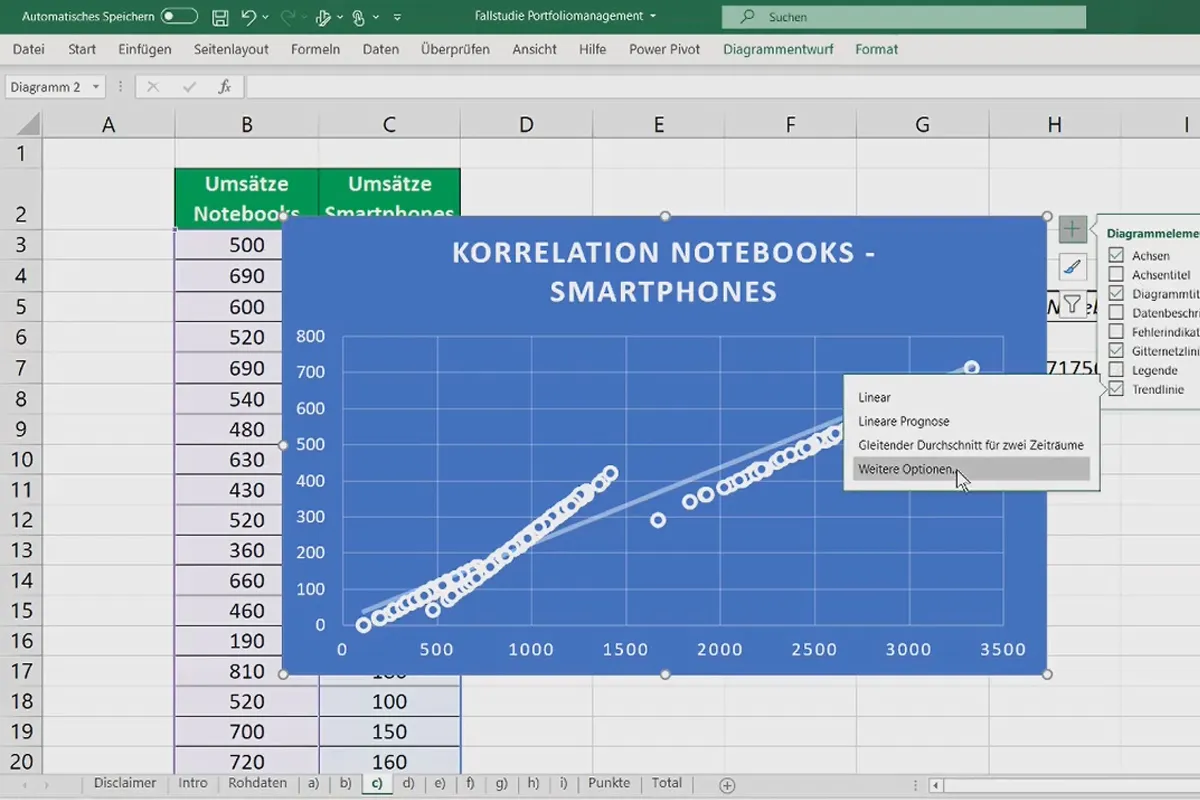
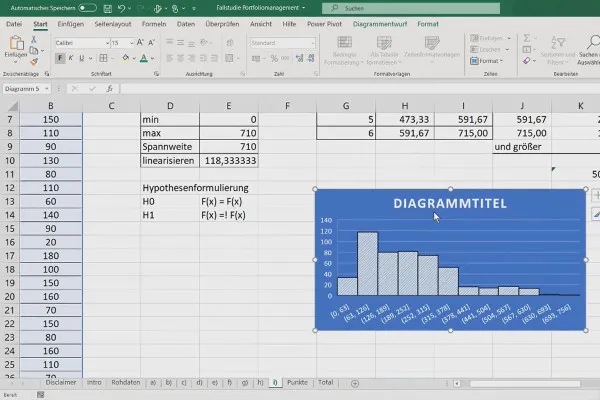
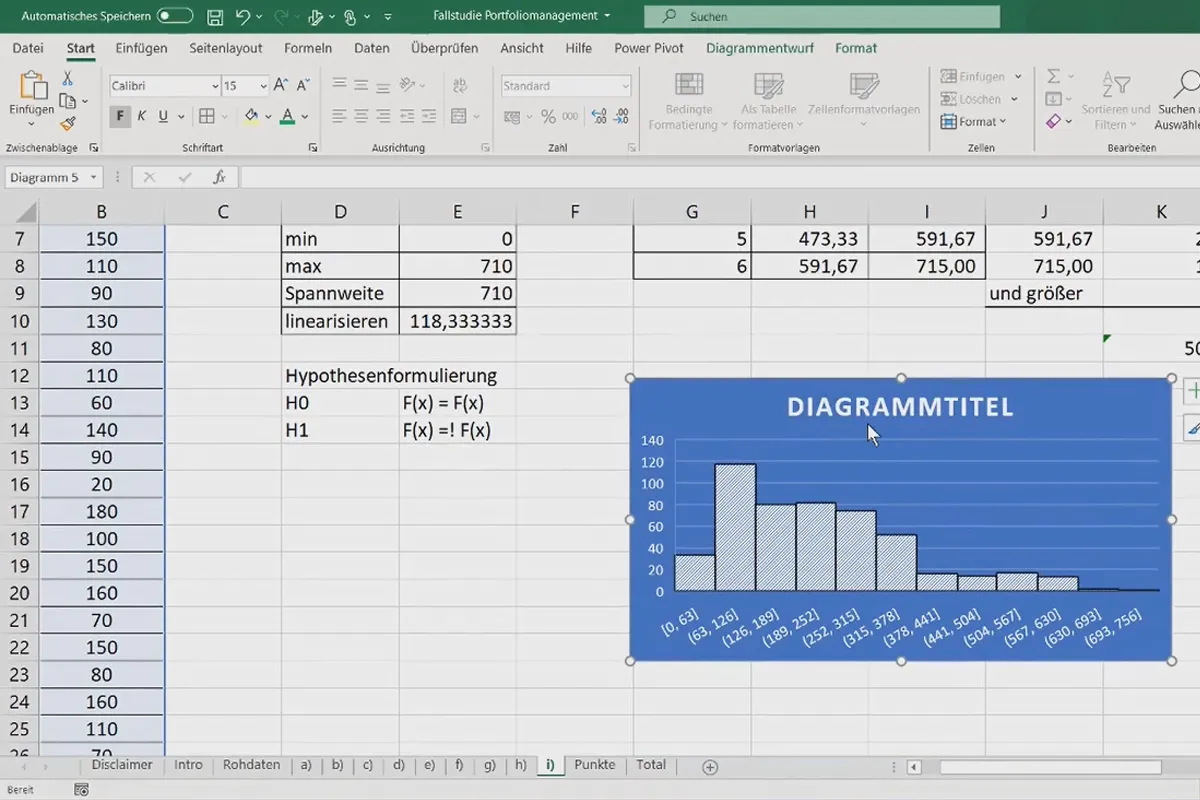
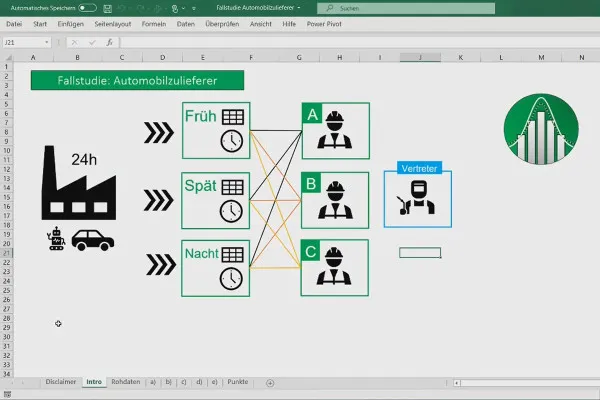
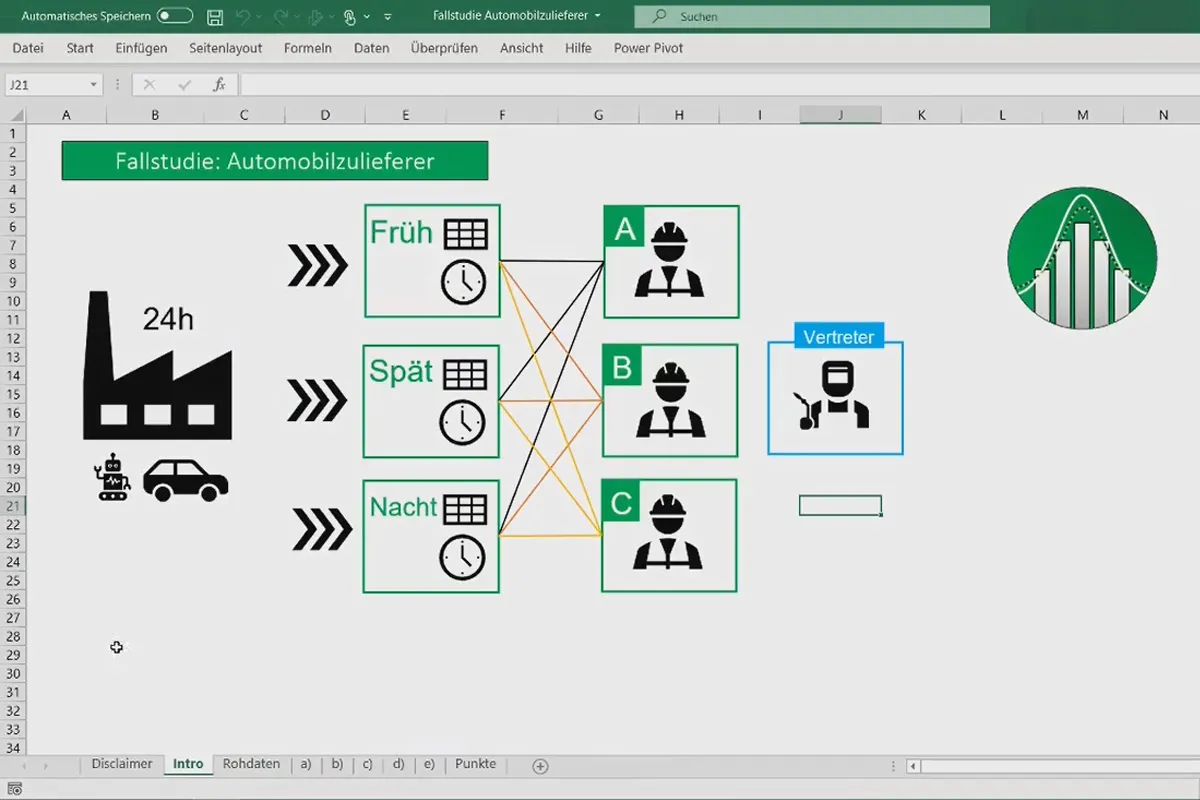
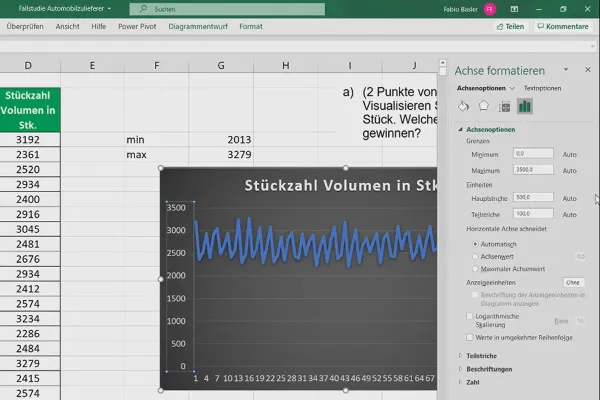
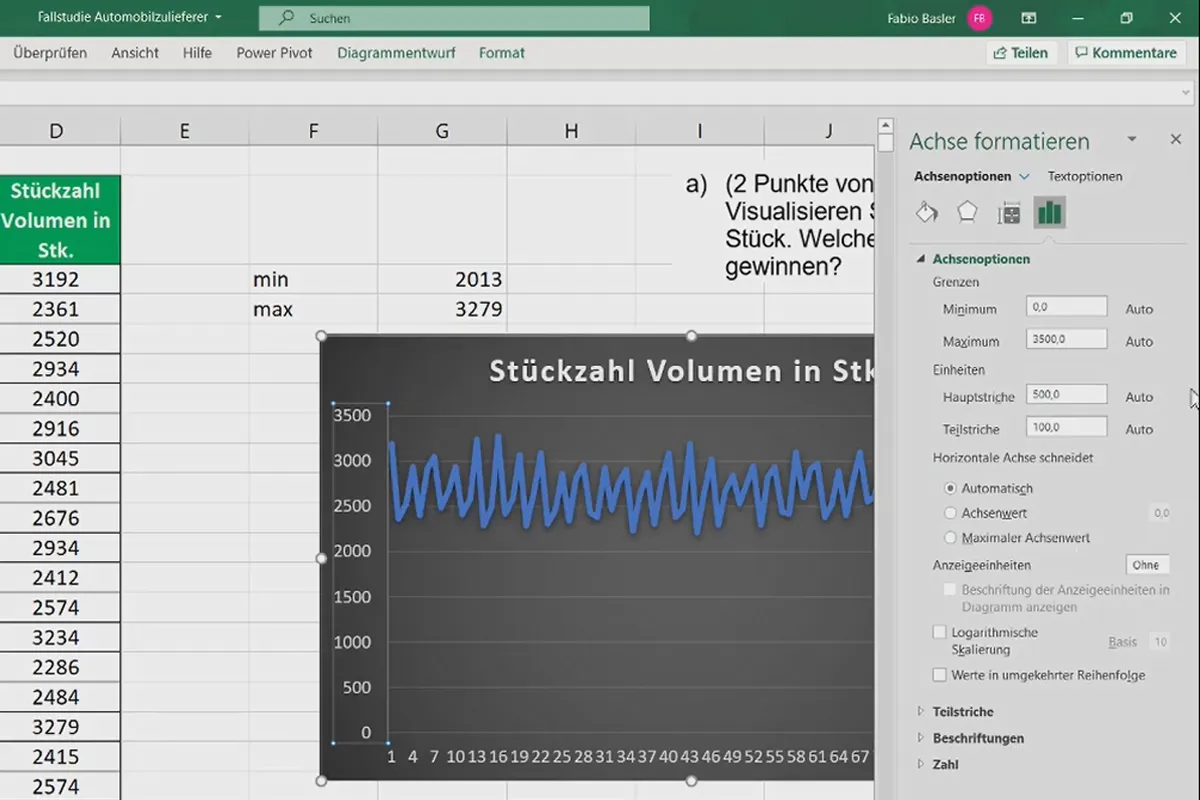
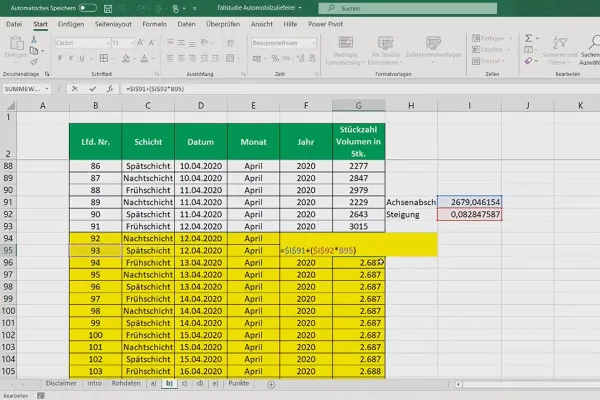
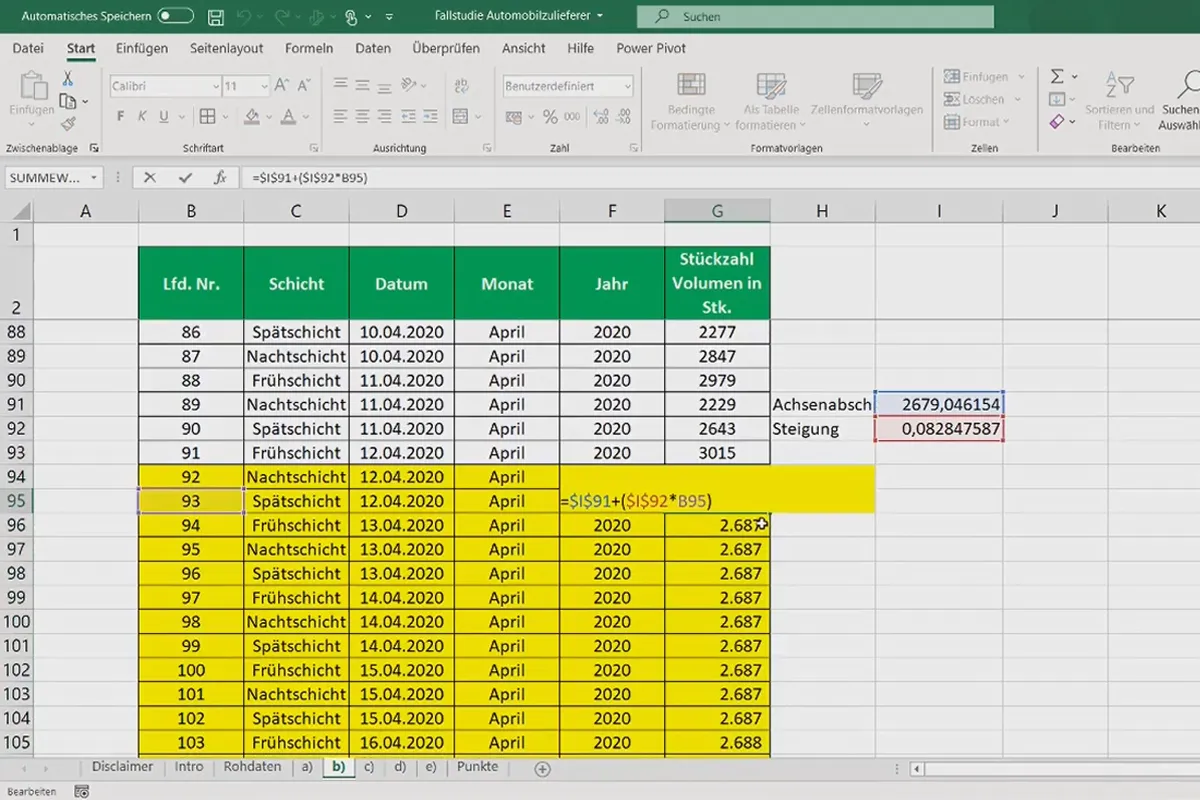
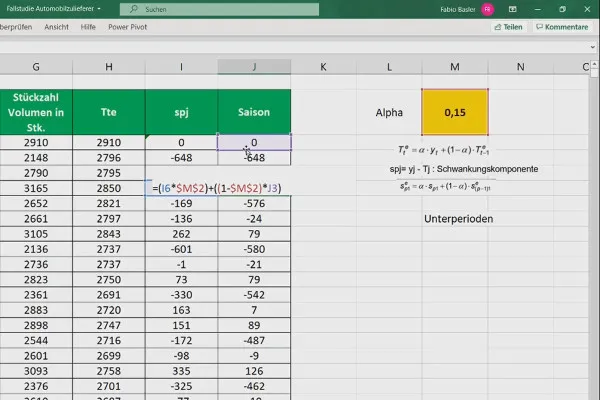
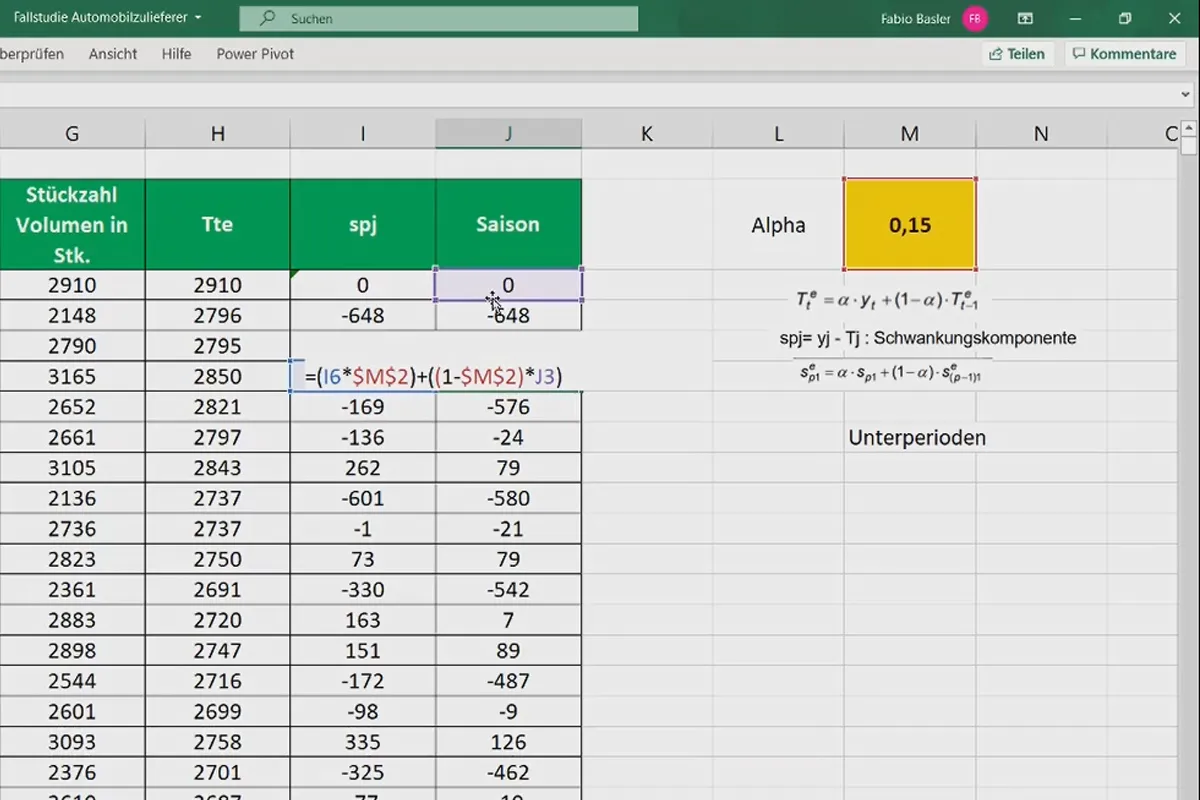
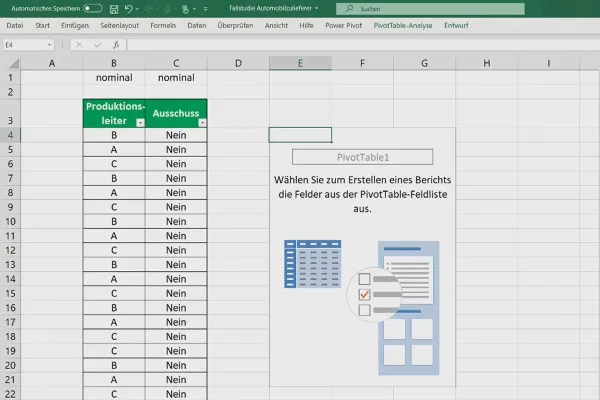
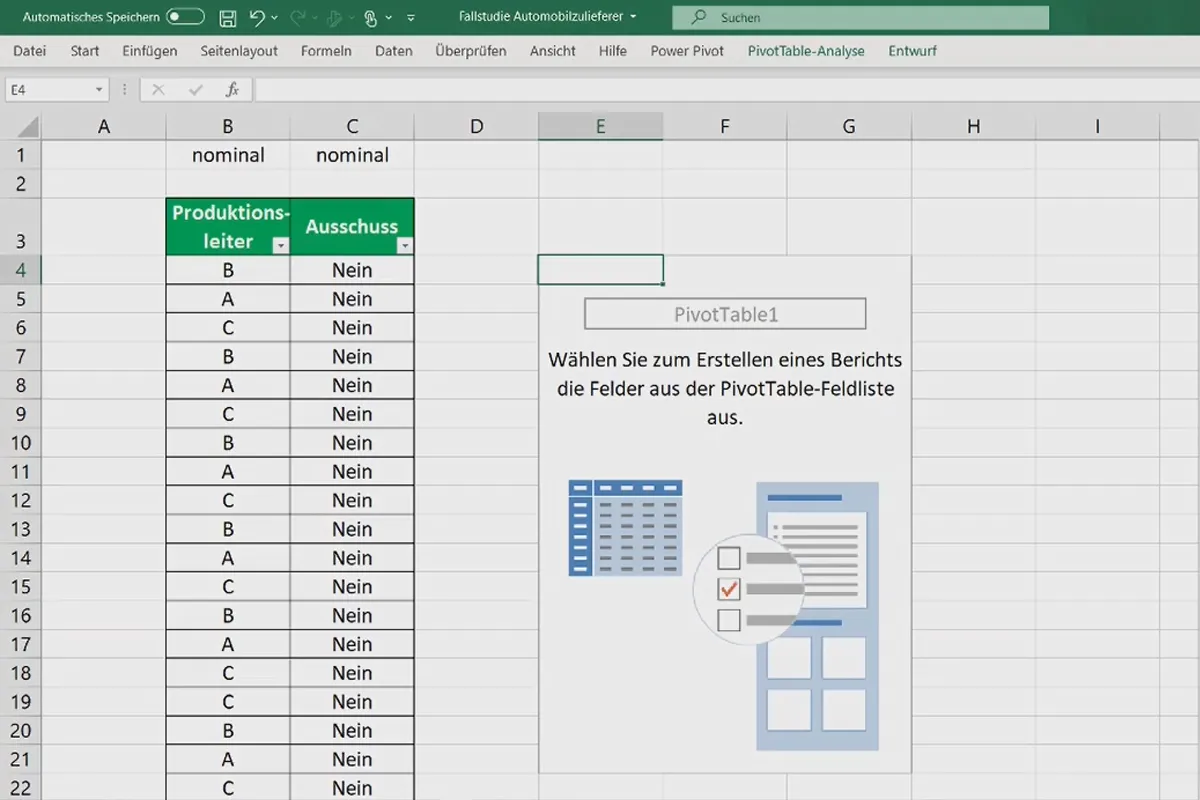
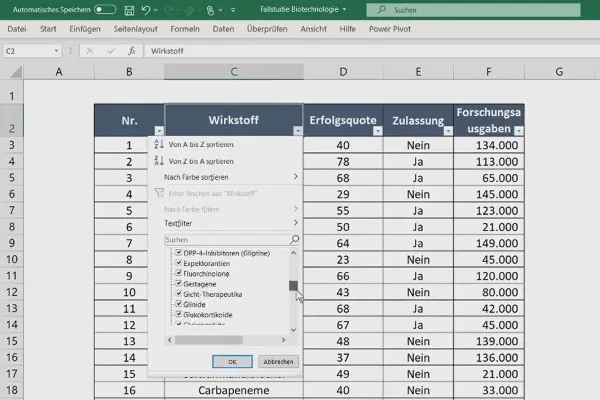
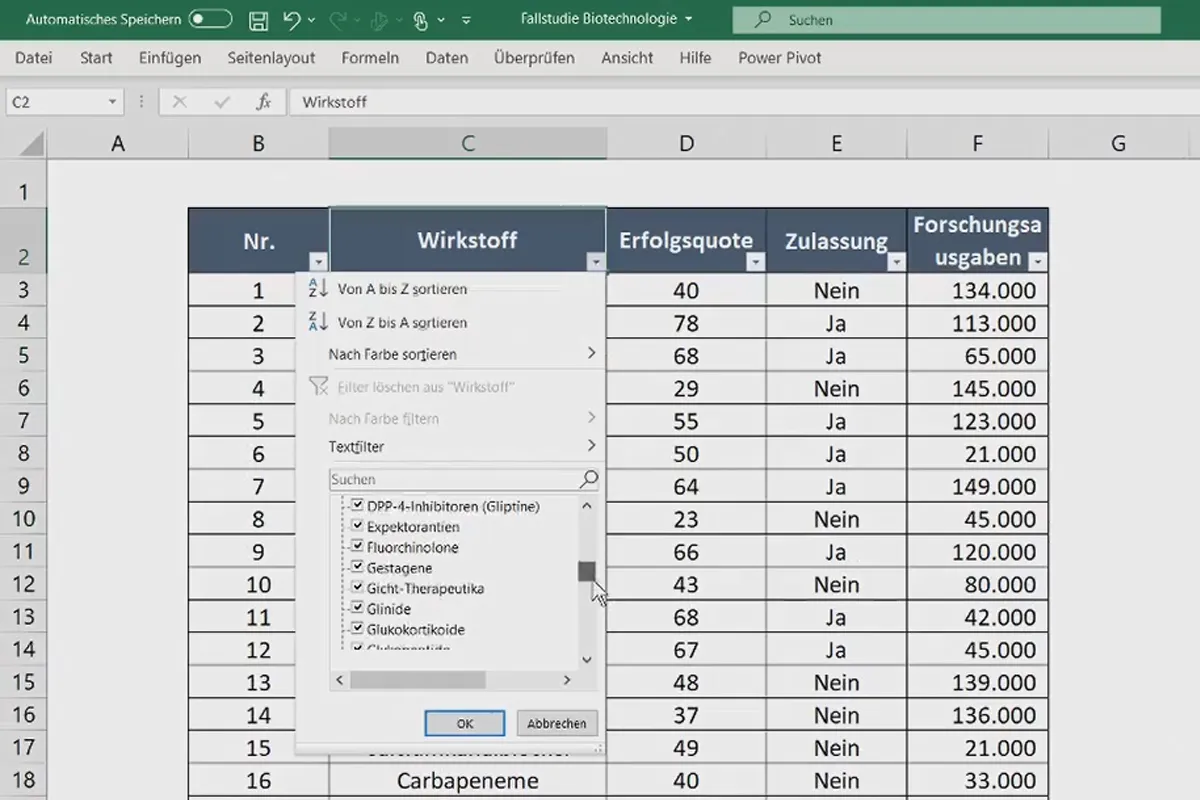
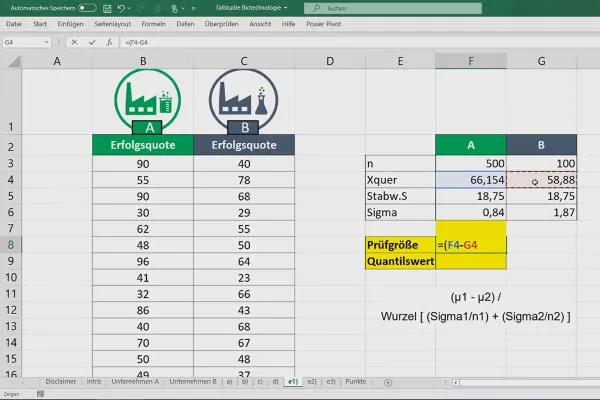
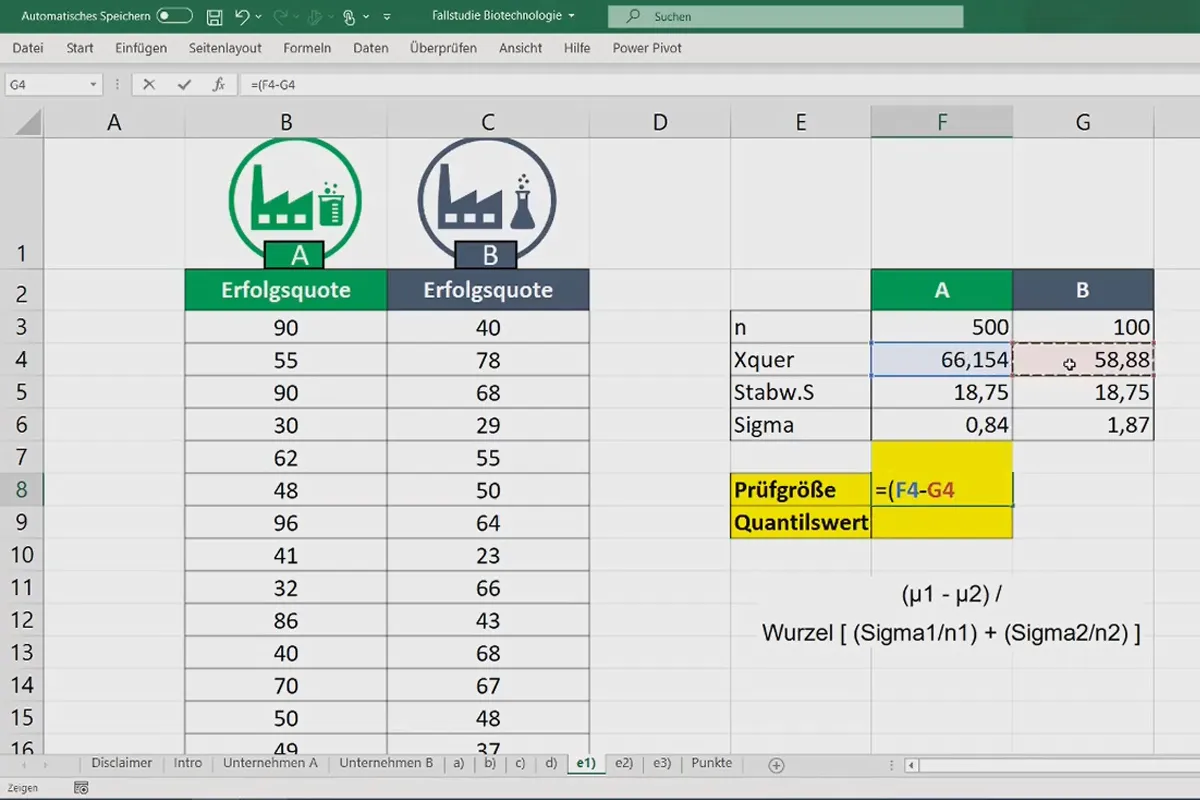
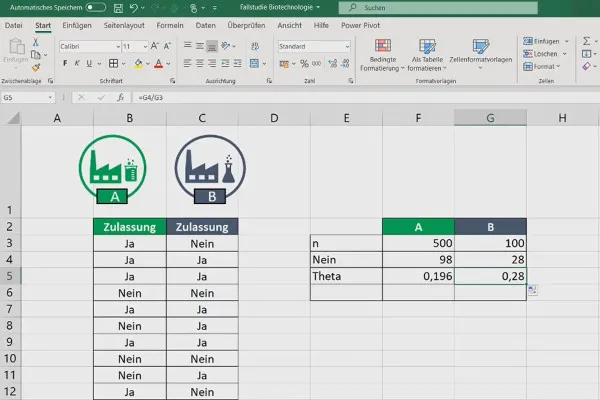
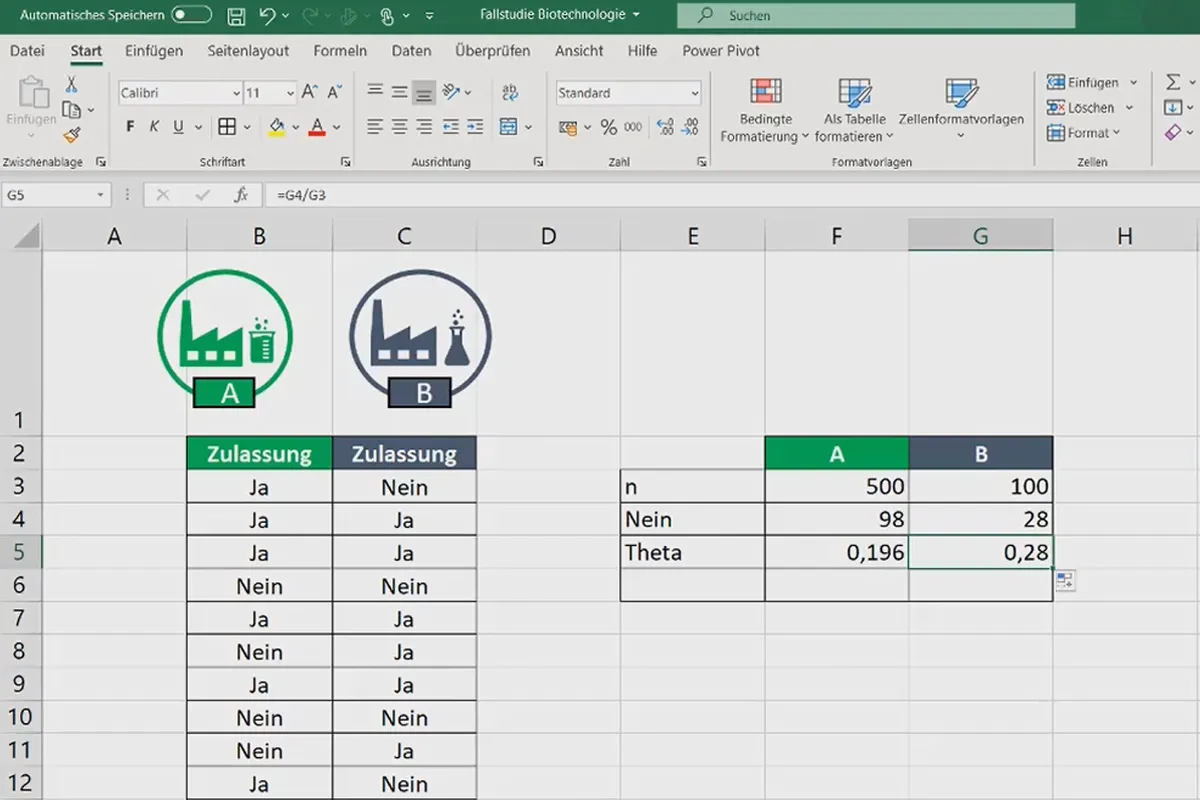
The case studies in the Excel statistics training course are consistently geared towards practice. For example, you will delve deep into the portfolio of a hardware company to analyze sales figures from 500 stores. At an automotive supplier, you will look at the production figures of various teams over several years. Finally, you will take a detailed look at the key figures for active ingredients at a biotechnology company.
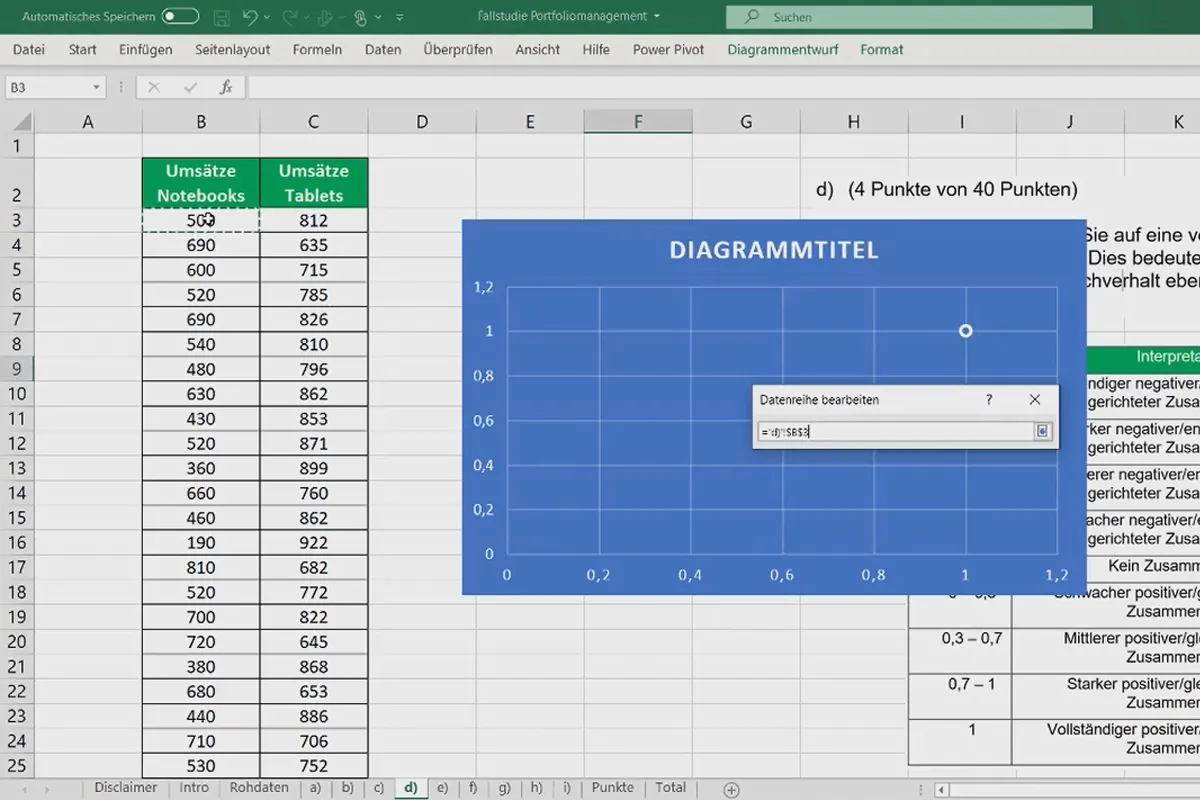
Whether it's product range analysis, sales success or process optimization - work through the case studies step by step and apply what you've learned directly for your own purposes. To make this quick and easy for you, you will receive a summary of the topics, a collection of formulas, the exercises and all raw data as well as the solutions to the exercises to accompany the course. On top of this, a points system serves as a personal learning success control.
Descriptive and inductive statistics with Excel
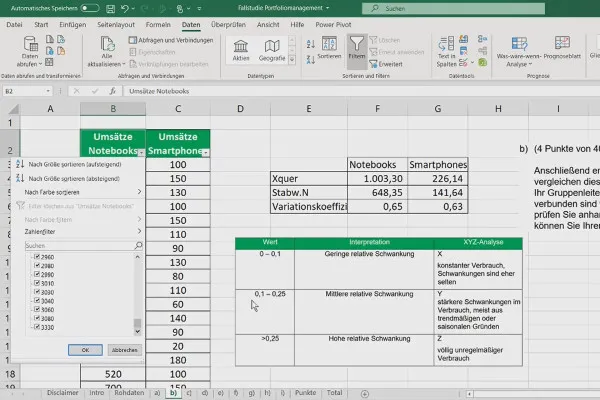
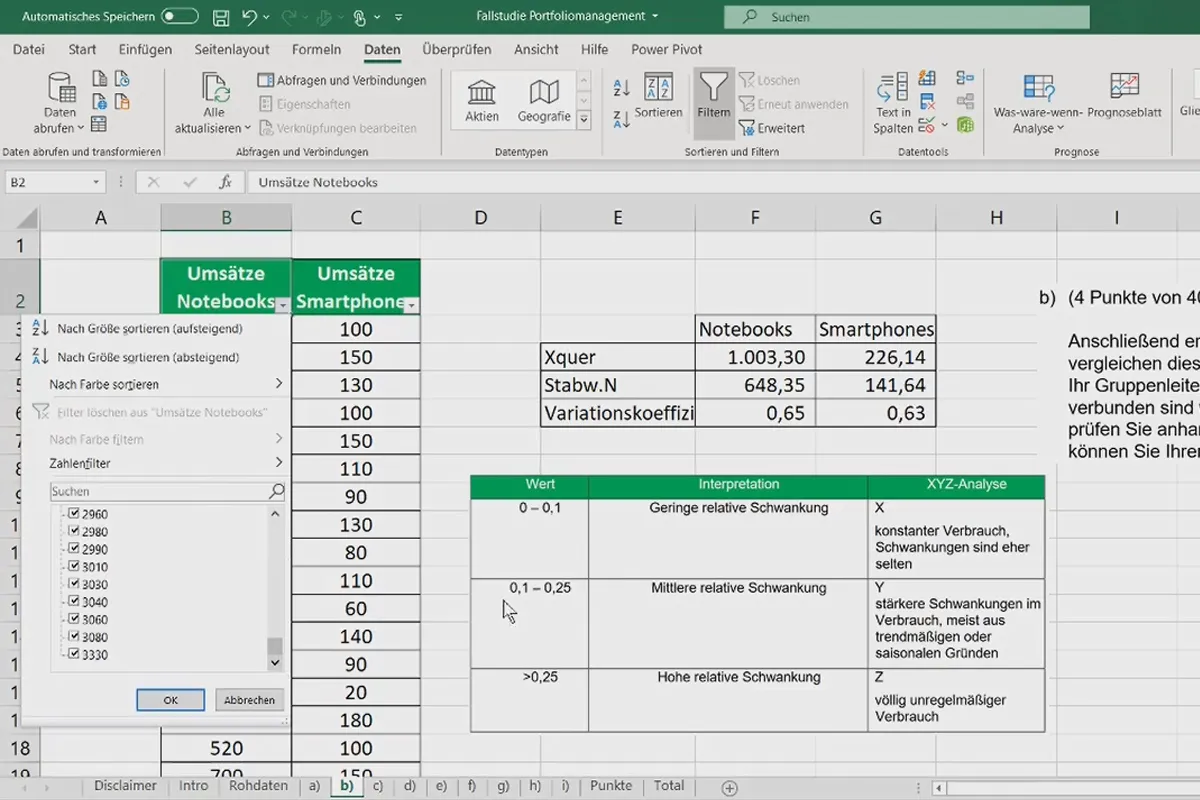
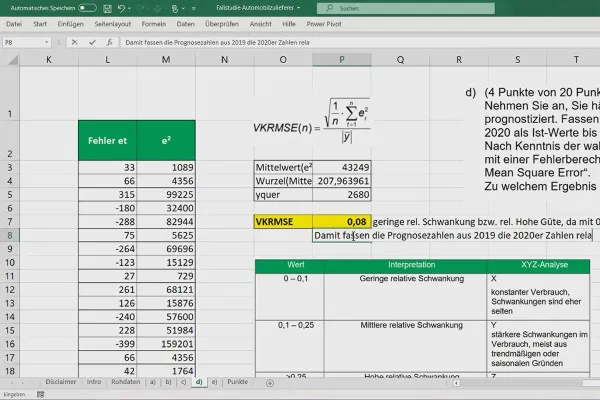
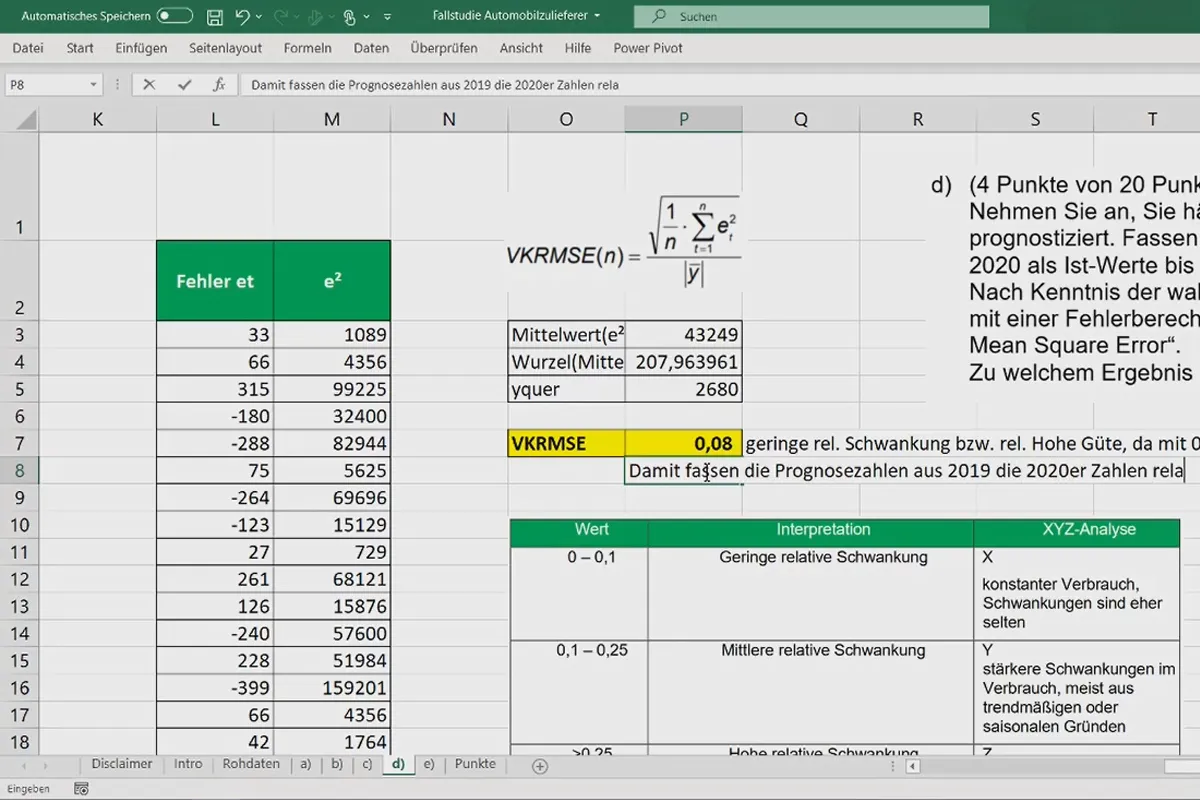
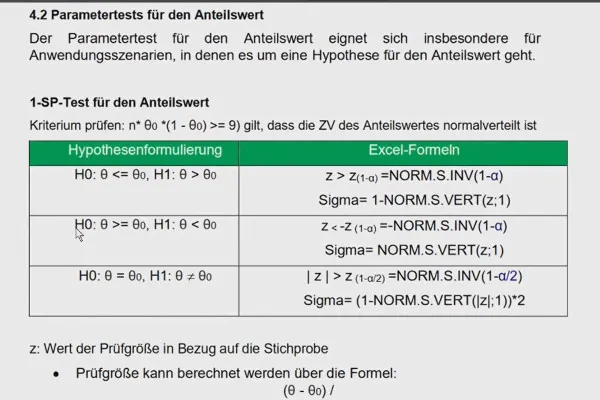
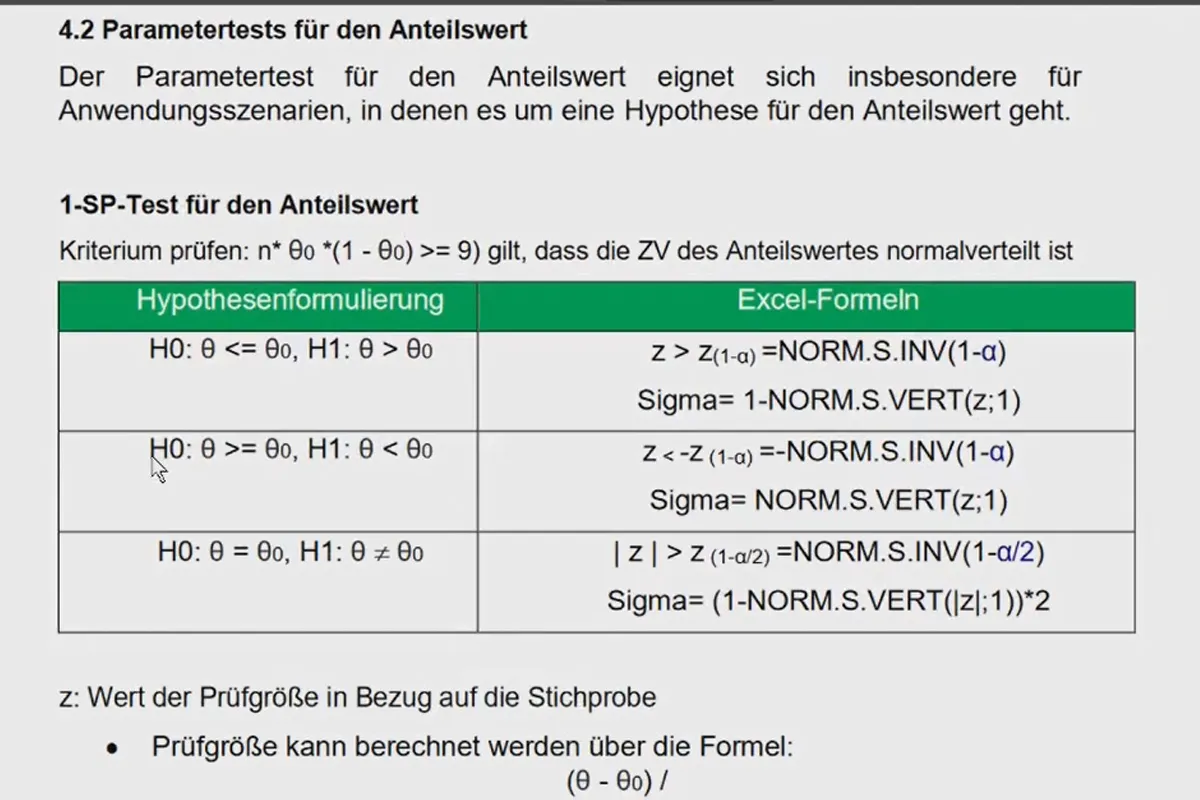
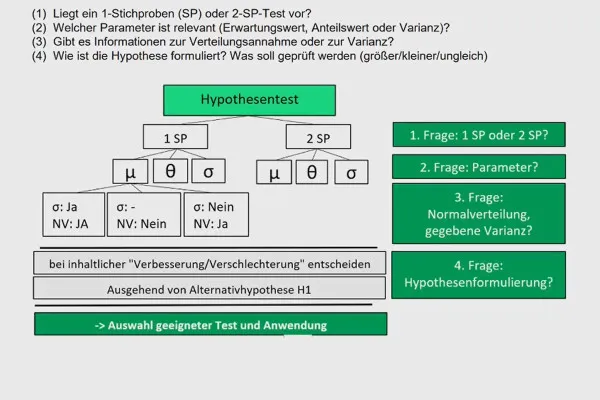
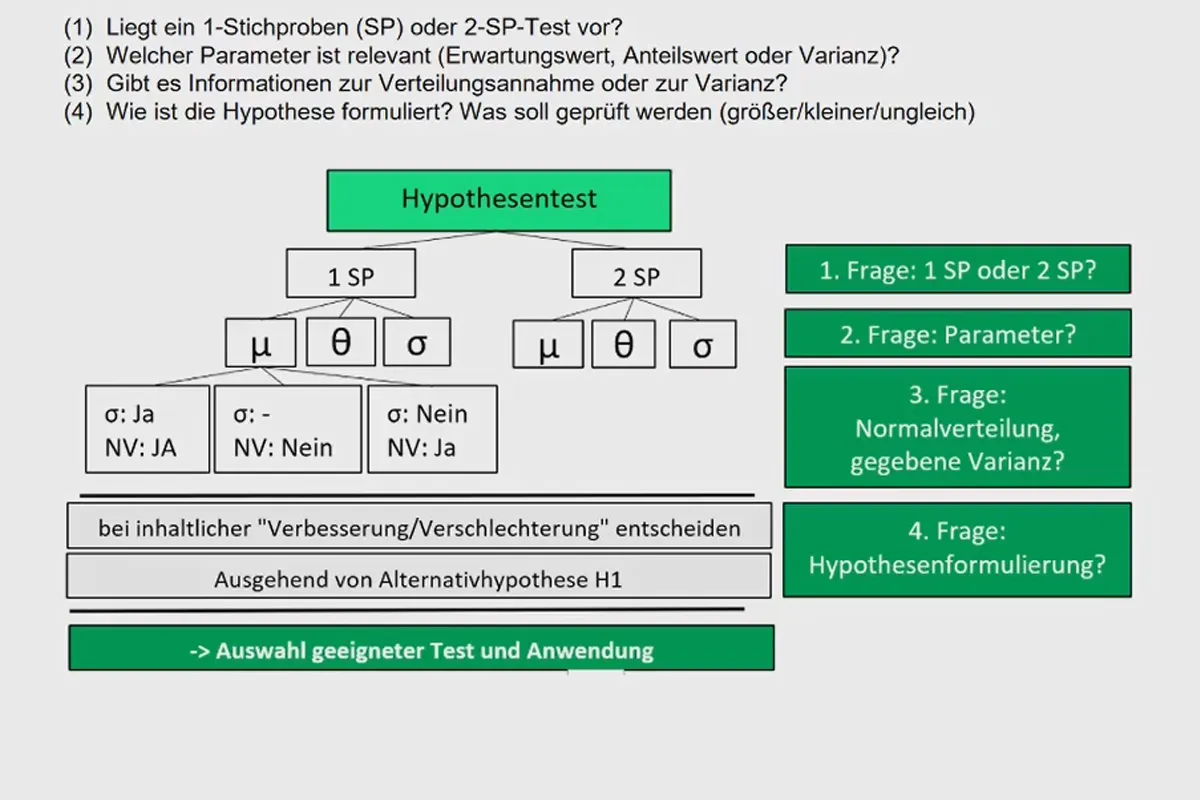
In the area of descriptive statistics , you will encounter mean value and scattering figures, among other things, during the training. You will focus on regression analysis, establish correlations and look at correlation measures. In the field of inductive statistics , you will carry out time series analyses as well as hypothesis and distribution tests. You will also evaluate the quality of error estimates and determine trends, for example.
Use the video course to get started in statistics with Excel , to deepen your existing knowledge or to refresh it. This will prepare you efficiently for statistics exams and teach you how to read your company's data correctly in order to optimize processes and evaluate the portfolio.
Tip: If you would like to delve deeper into the subject, take a look at our Excel training courses on data analysis and evaluating questionnaires.
Other users are also interested
Faster results in your tables
How to build trust with customers

Effectively create modern slides
This saves you time and effort!

Fully equipped from flyer to roll-up

With flyer, business card & Co.

For complete business equipment
Create, set up & optimize online advertising


