Creating and formatting pivot tables in Excel: from analysis to dashboards
Would you like to evaluate and visualize your data without changing the initial values? Here's your next Excel step: pivot tables. Fabio Basler will take you from creating and formatting your first pivot table to displaying your key figures in clear dashboards. In just 5 hours with practical exercises, you will acquire Excel knowledge that you will need again and again.
- Learn how to create and format pivot tables in Excel in a 5-hour training course
- Excel expert Fabio Basler shows you how to keep track of even vast amounts of data
- Practical learning based on a case study and using exercises and practice materials
- Create informative and visually appealing reports in a short time
- Basics: What is a pivot table? How do you create it? What do you use it for?
- Preparation and analysis: Master the use of all important pivot functions
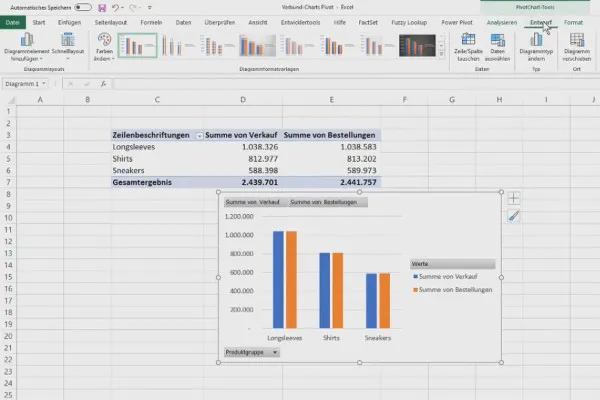
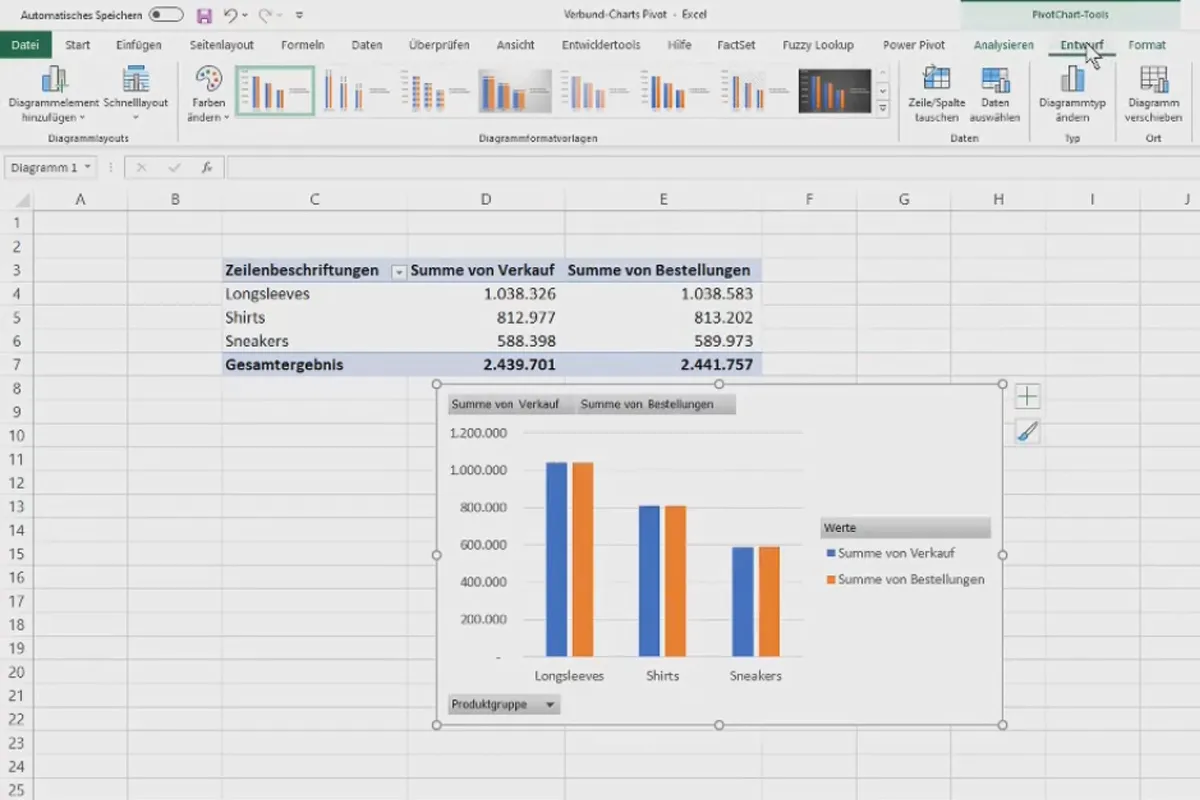
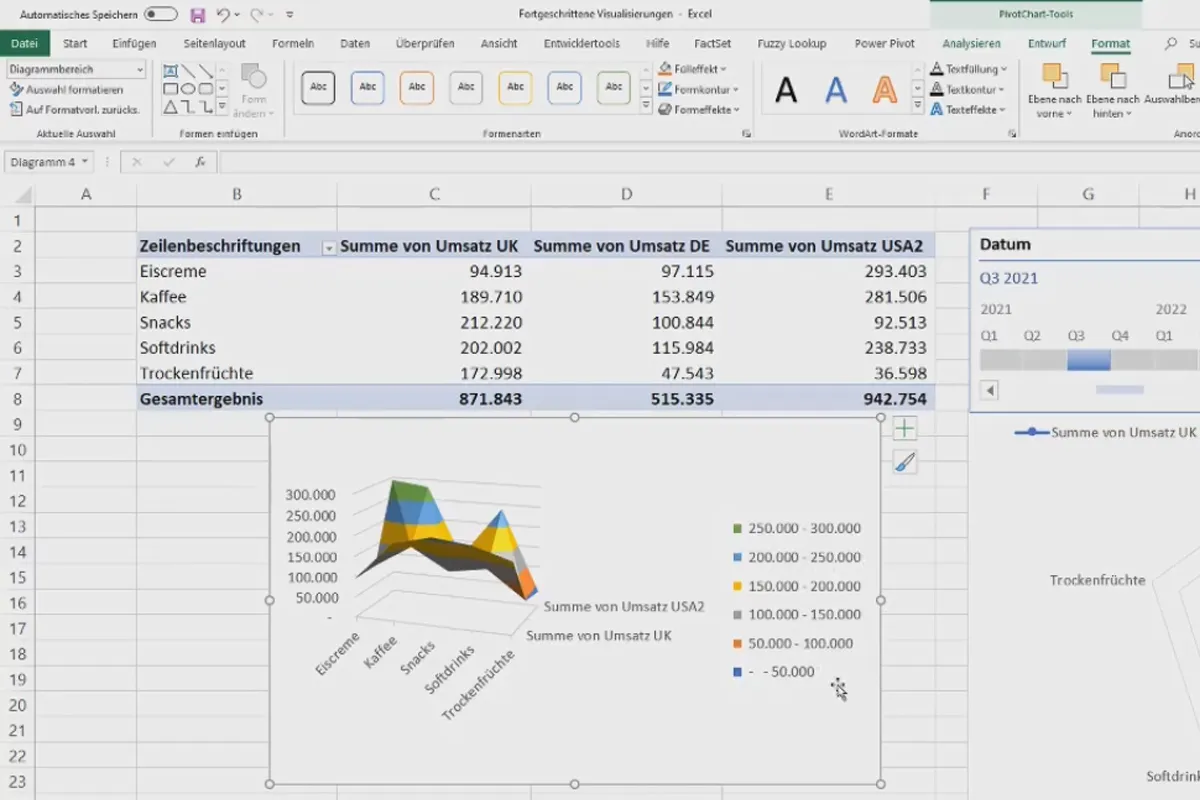
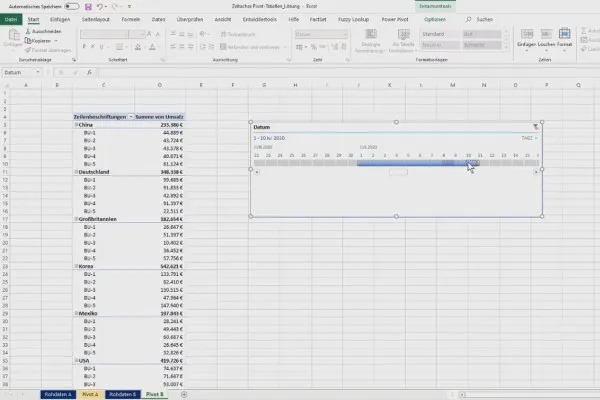
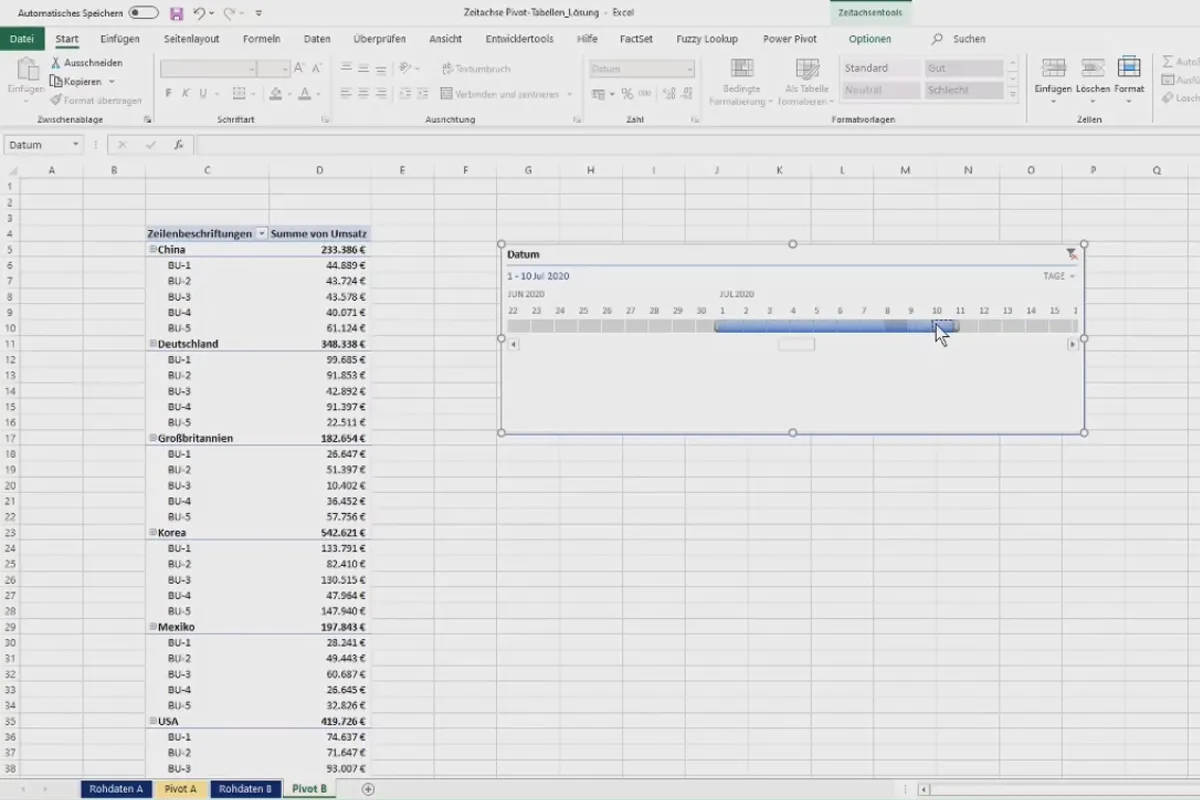
- Visualization: Create diagrams, compound charts, timelines and much more
How to find the key messages in your data even more effectively: Open Excel, start this pivot course and take your data analysis to a whole new level!
- Usable with:
- content:
5 h Video training
- Licence: private and commercial Rights of use
- Bonus: including working material
Intro to the video training
Intro
Basics of Pivot Tables in MS Excel
Visualization with pivot tables
Advanced pivot functions
Case study Pivot tables in Excel
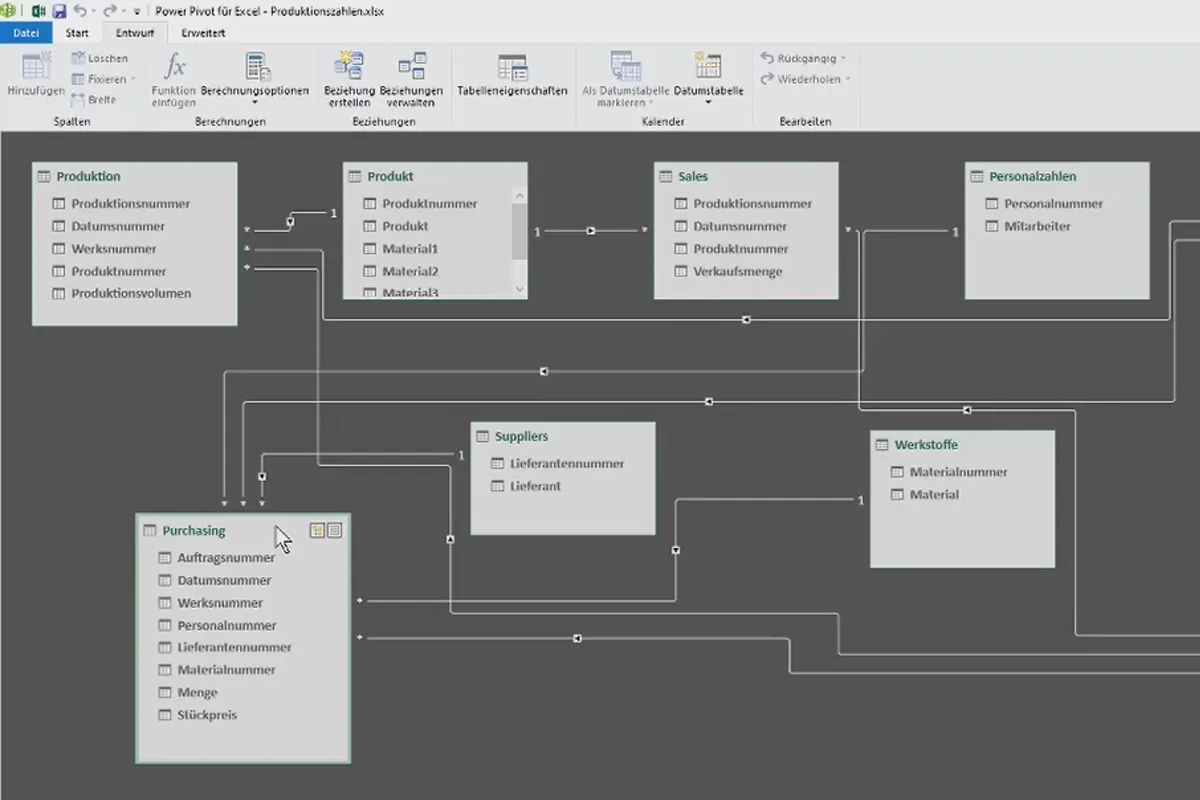
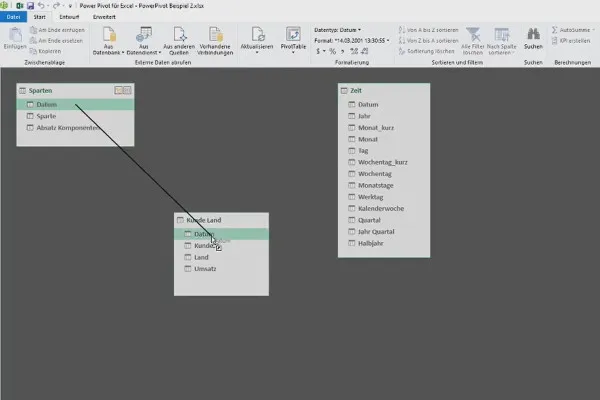
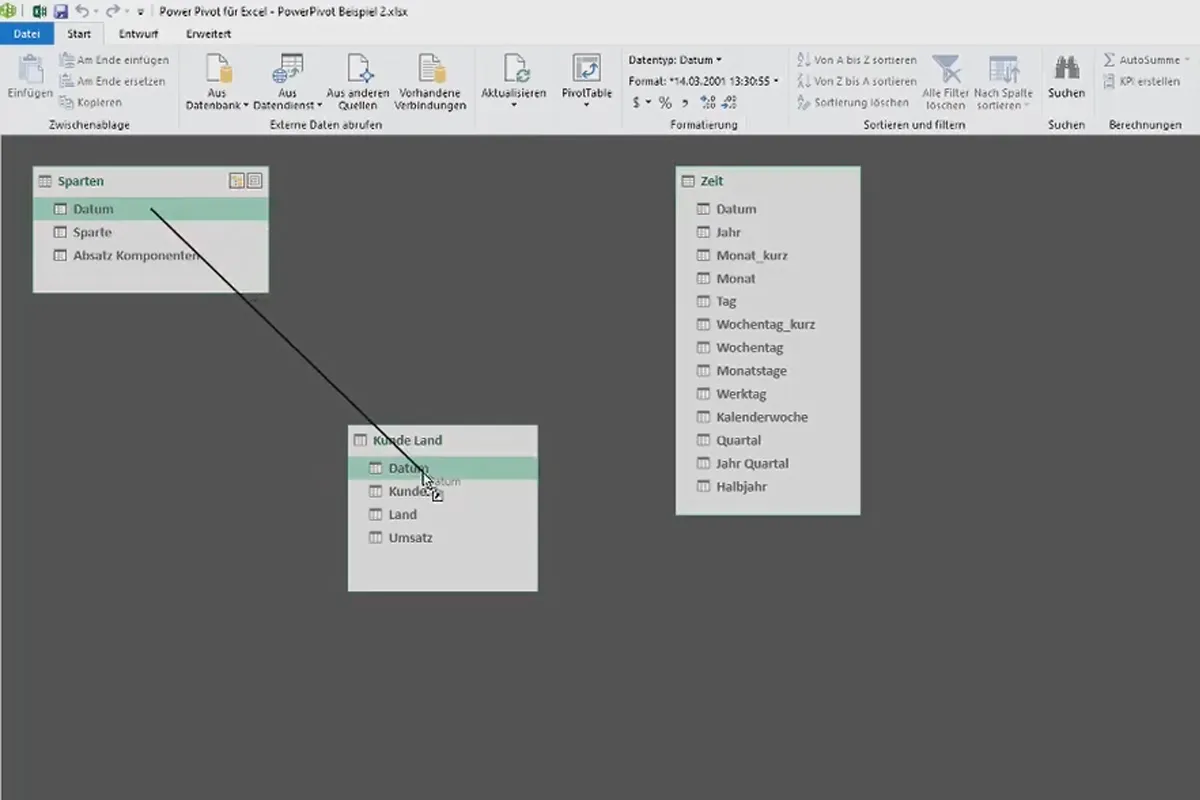
Bonus: Power-Pivot
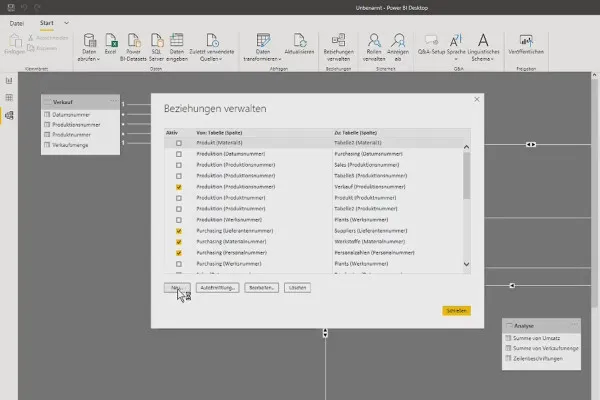
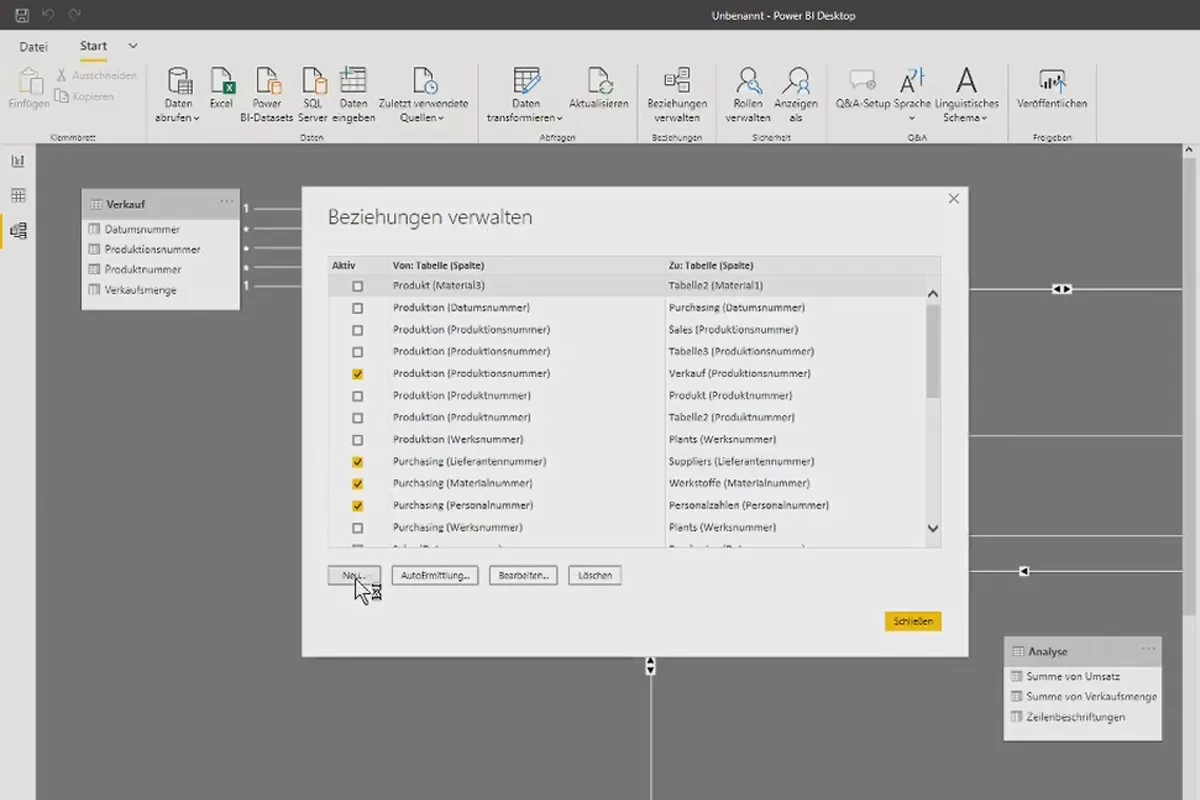
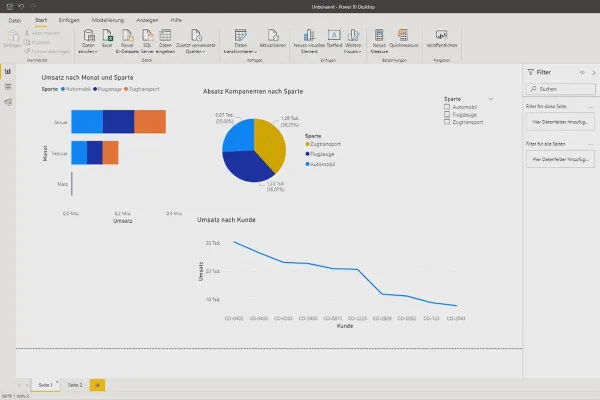
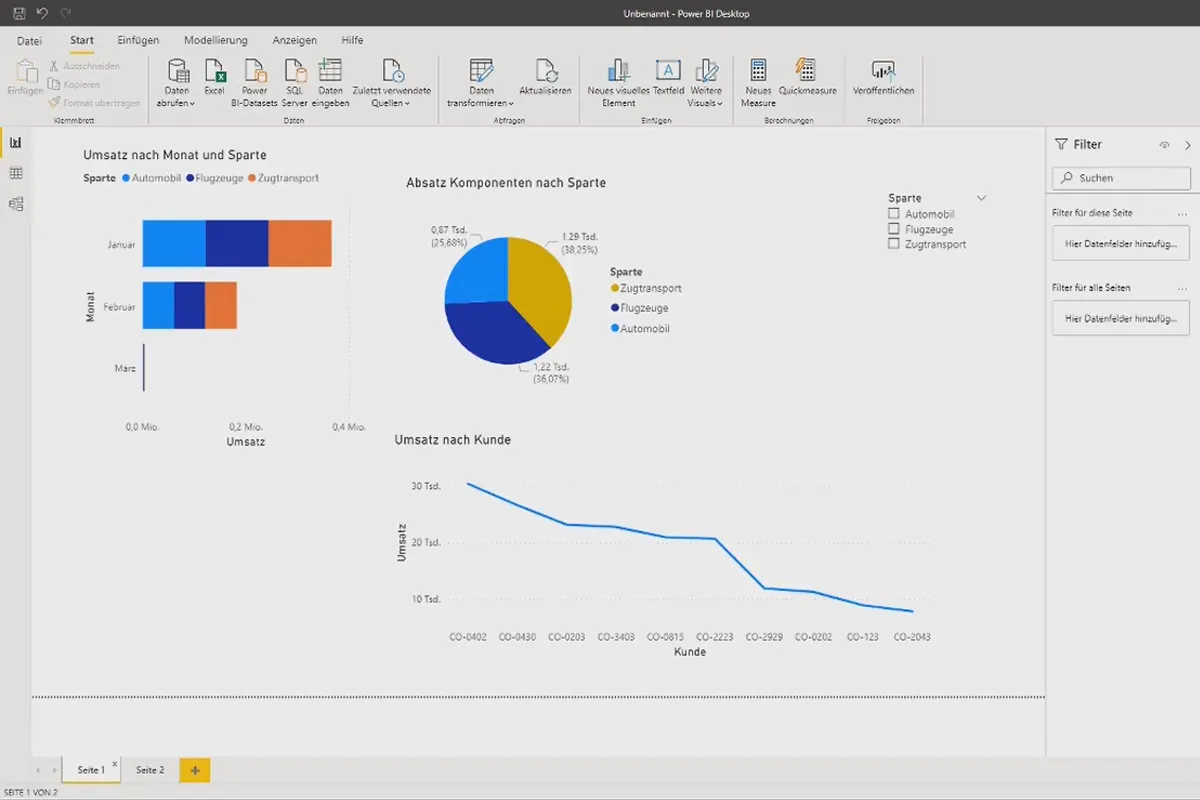
Bonus: Introduction to Power-BI
Outro
Details of the content
Pivot tables: the be-all and end-all when working with Excel
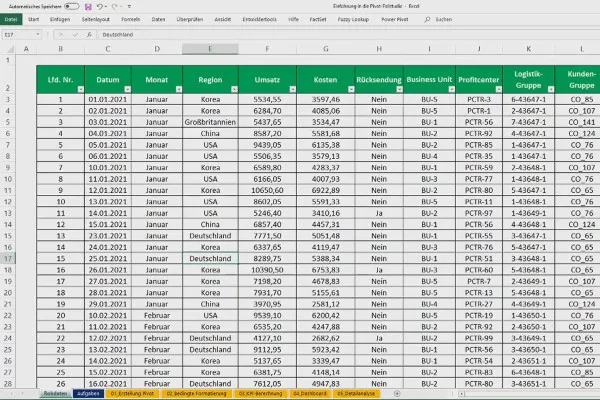
At the latest when your raw data exceeds a manageable number of columns and rows, you will learn to fully appreciate pivot tables. However, it is also worth using them for smaller data sets. This is because pivot tables allow you to summarize the key properties of your source data in a concise and clear way.
Take the opportunity now and teach yourself how to use pivot tables so that you can shine in your job with real Excel expertise . A 5-hour video course with 40 lessons from trainer Fabio Basler!
Create and format pivot tables and present them clearly in dashboards
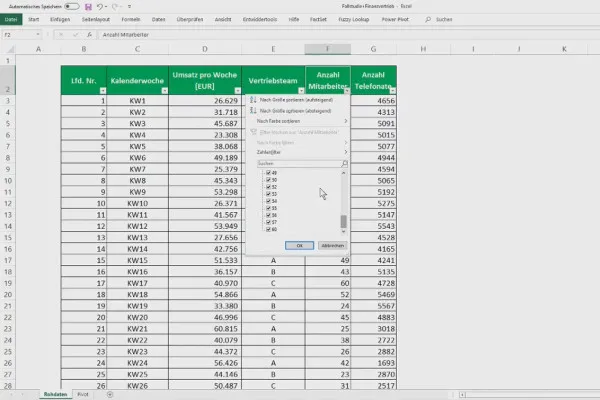
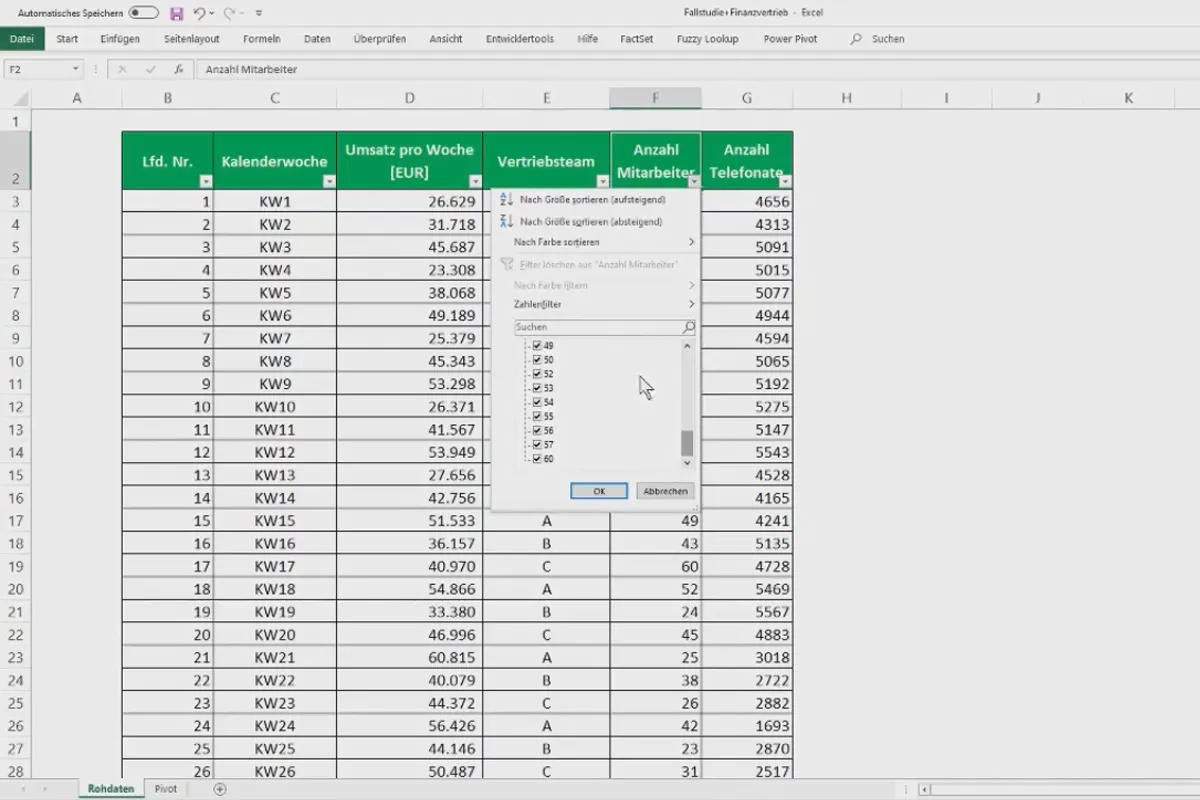
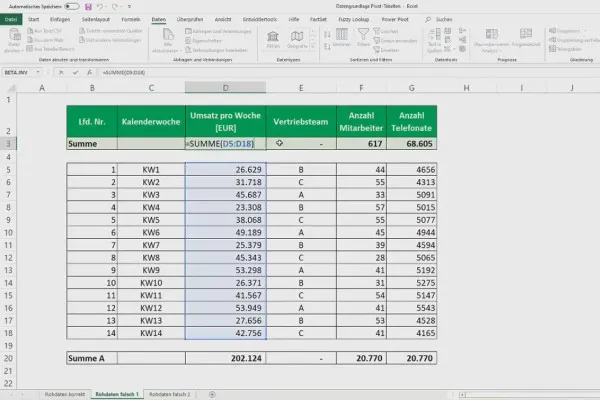
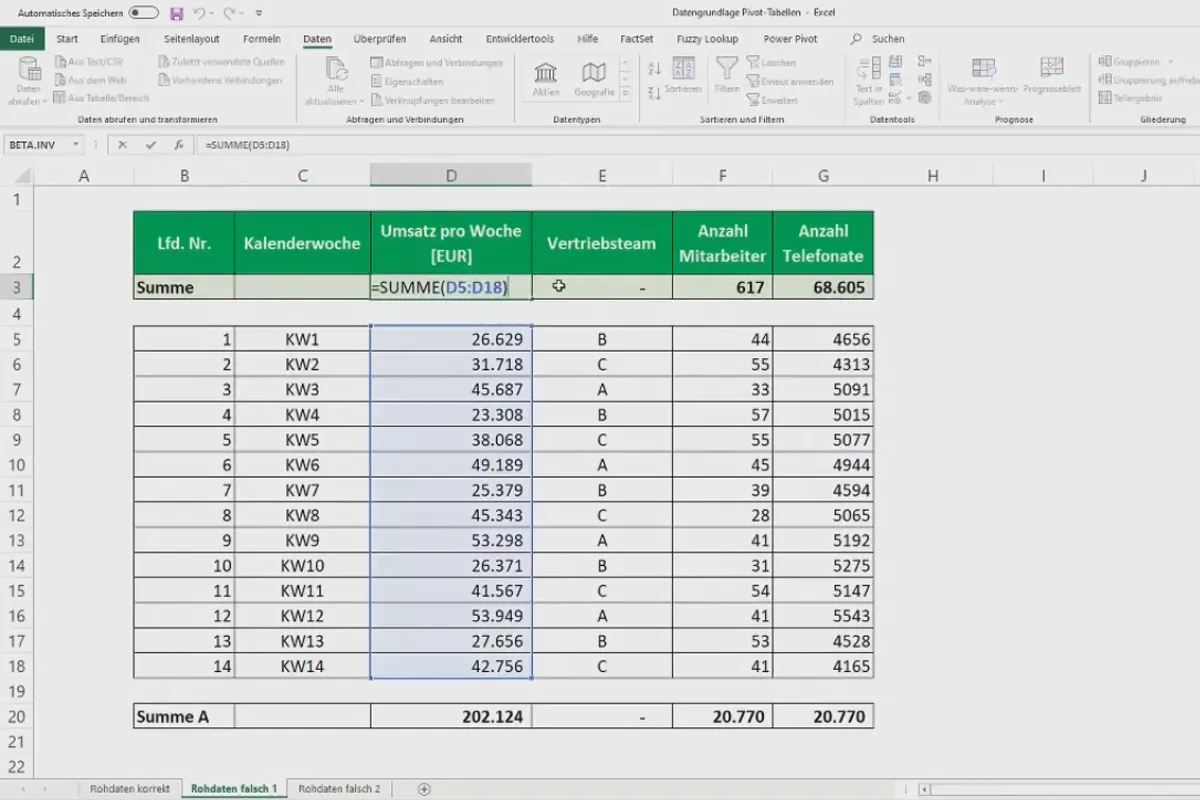
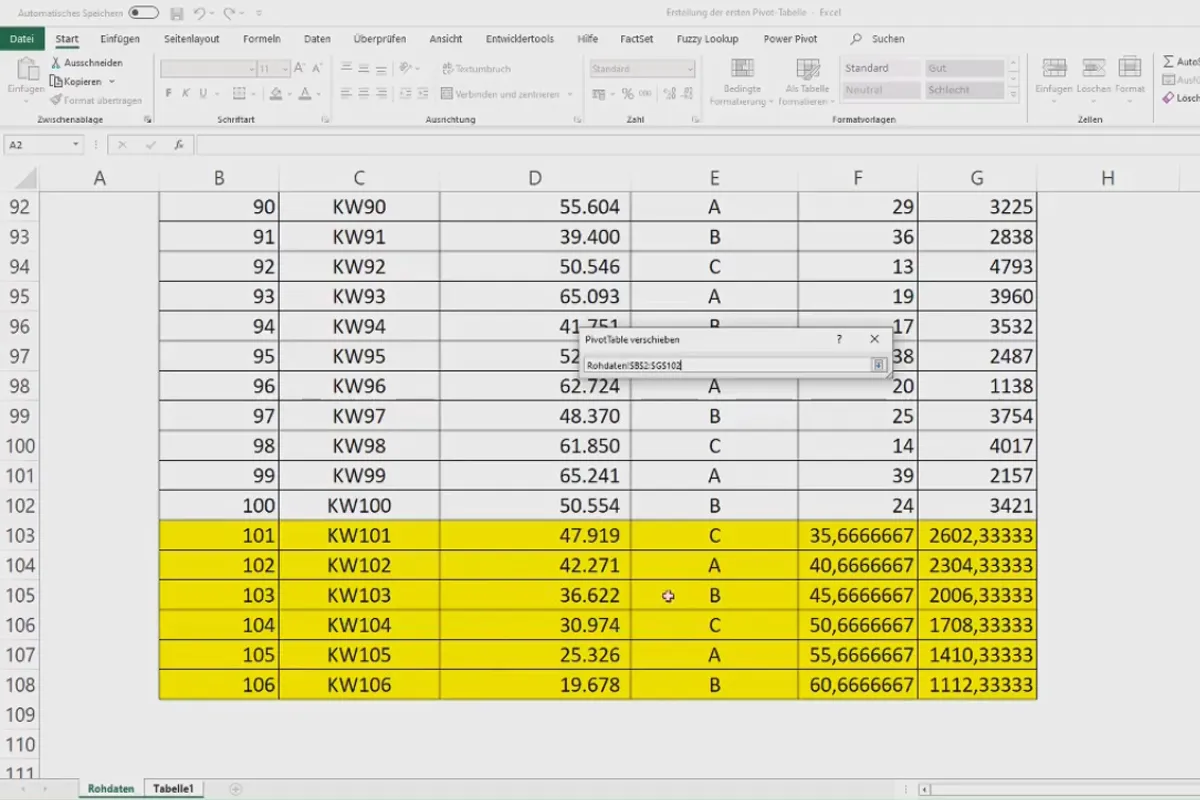
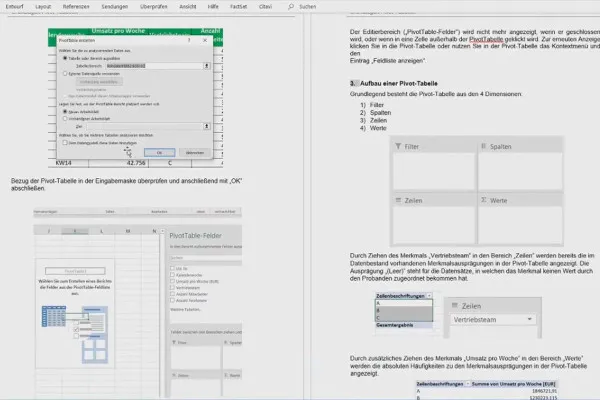
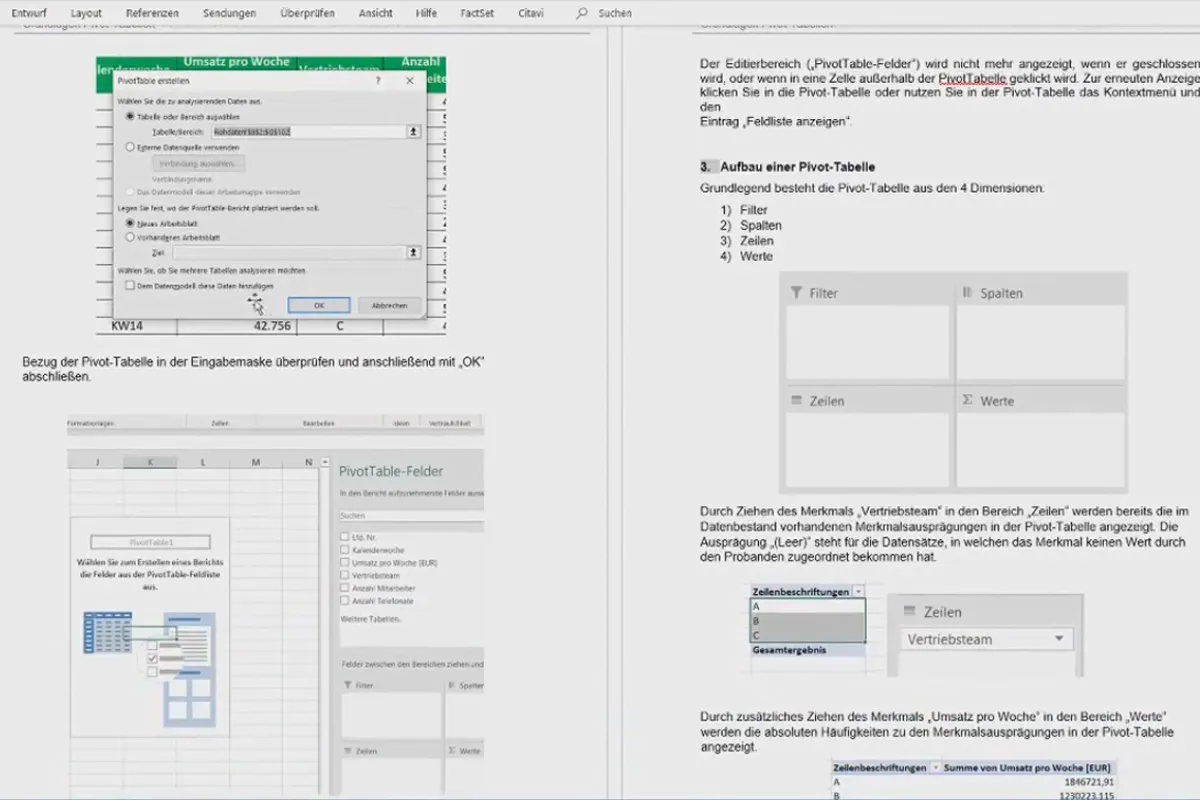
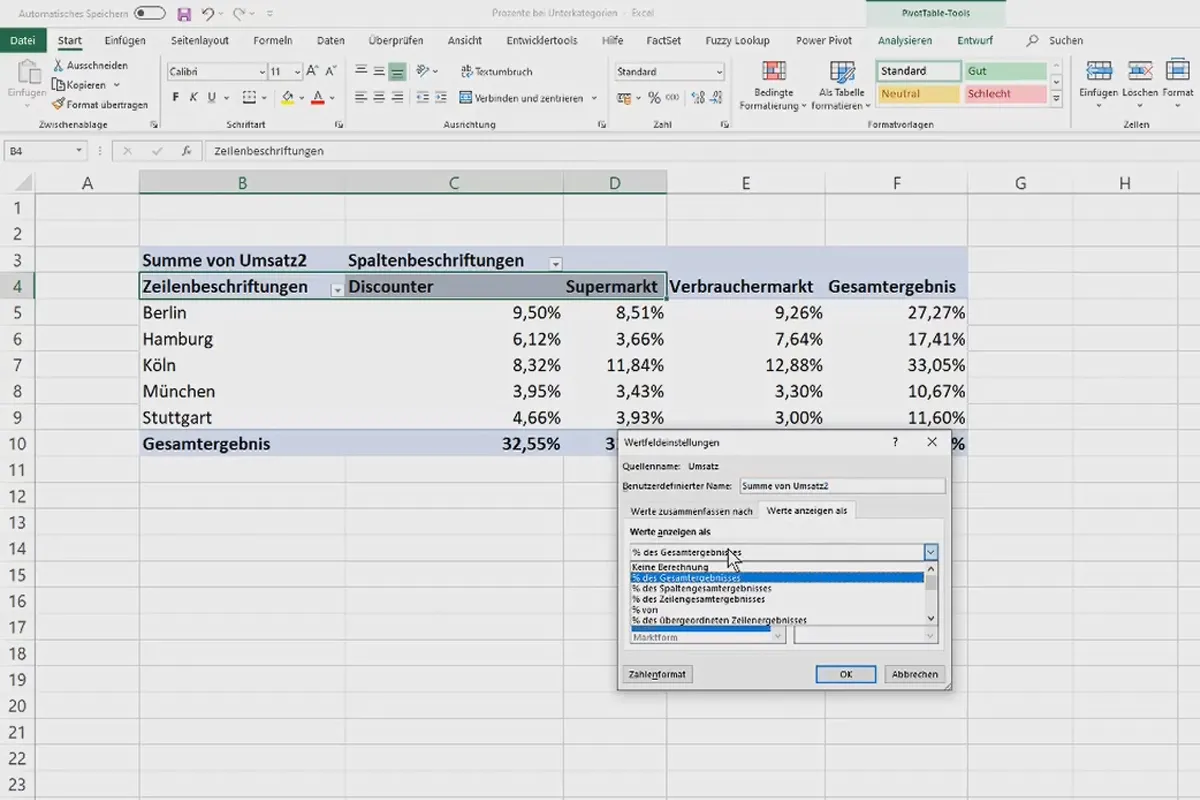
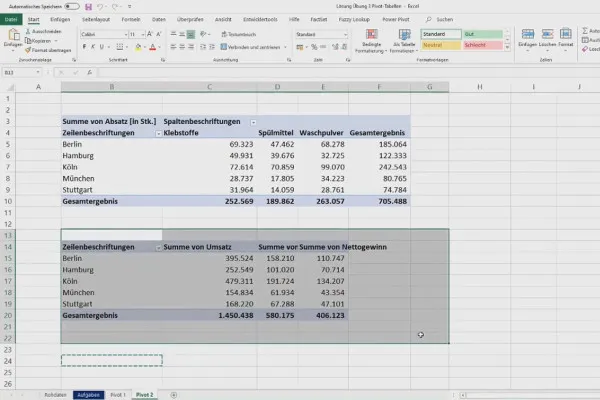
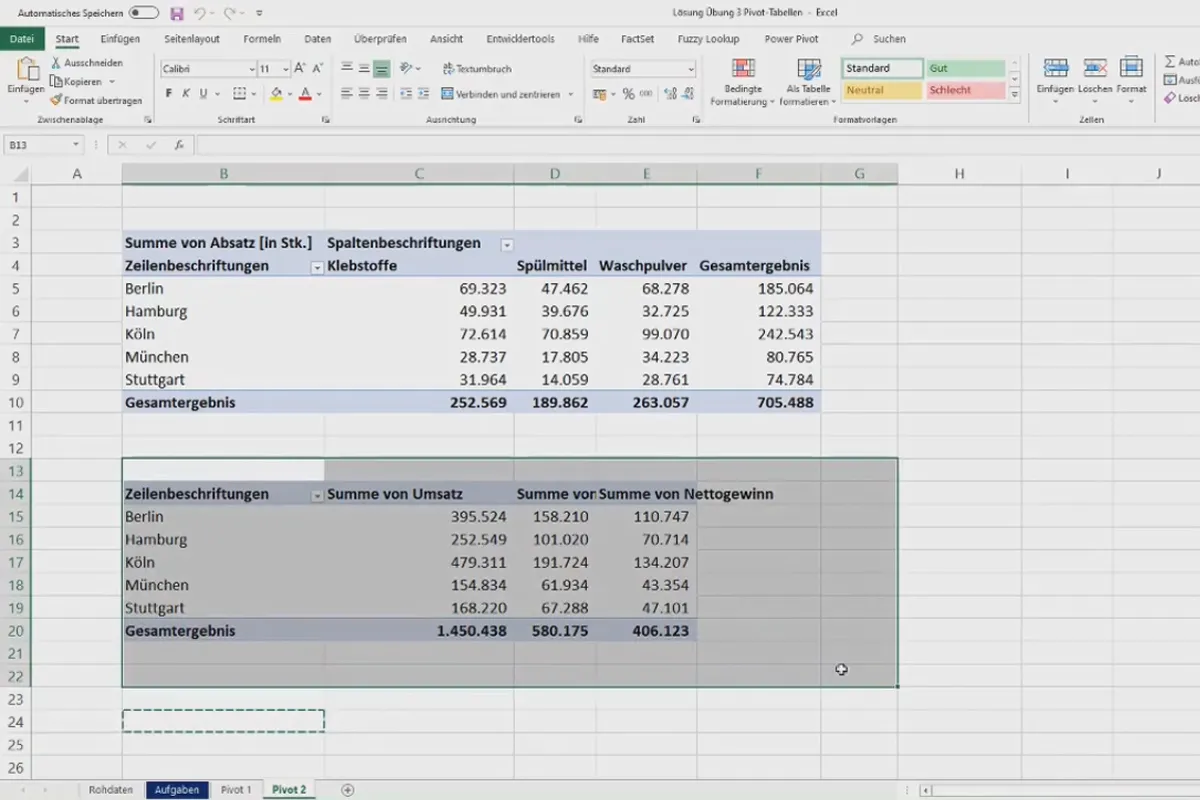
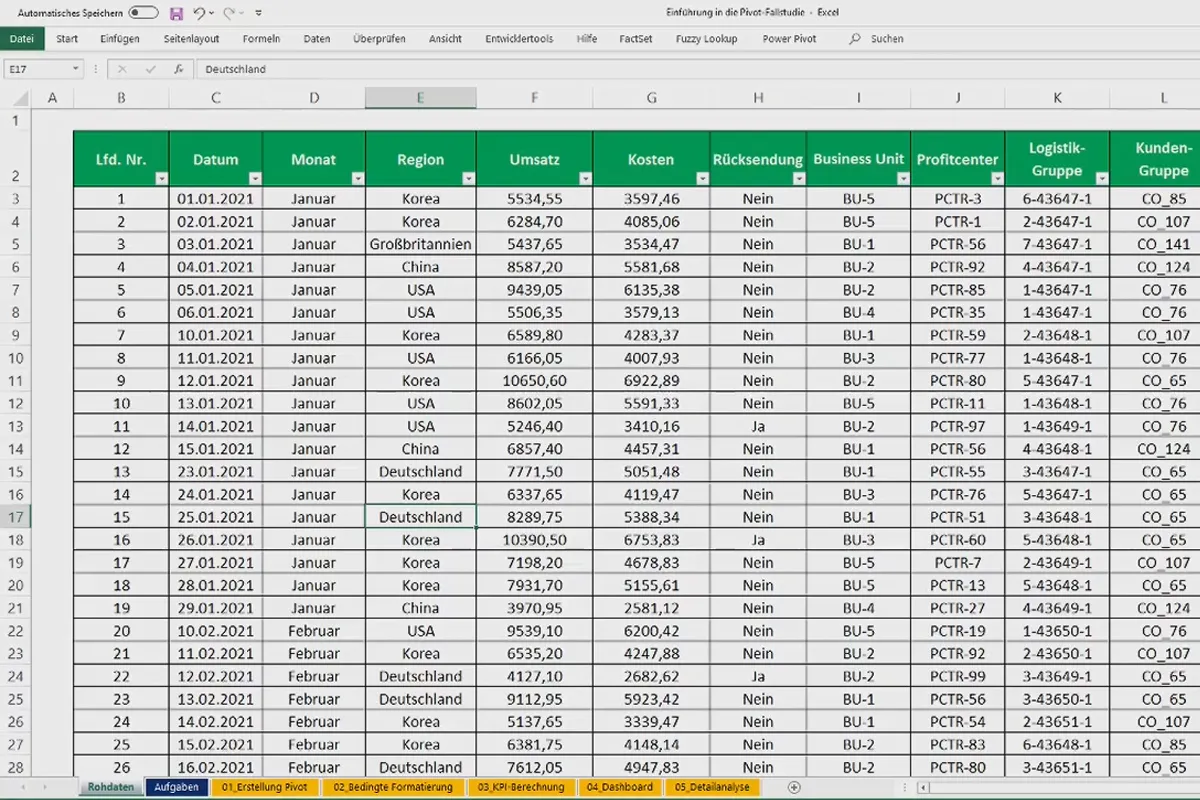
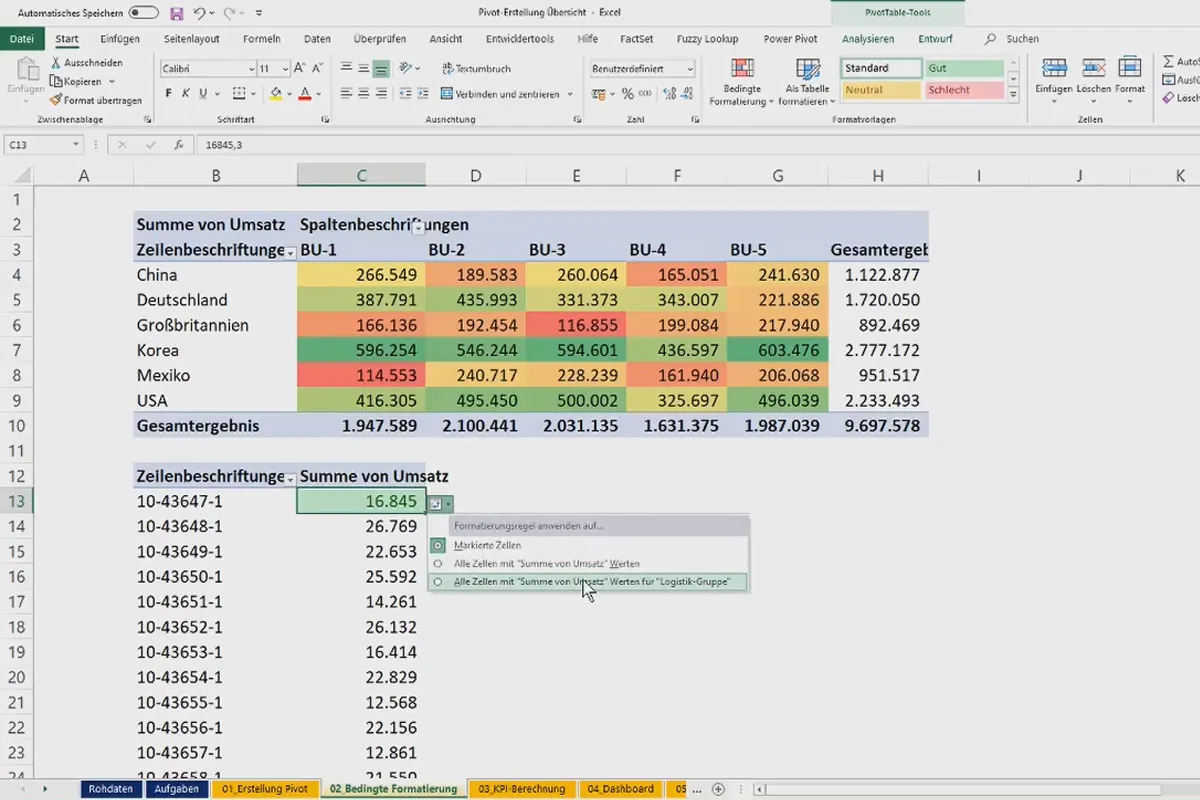
The course is an all-round package for pivot tables in Excel. If you have had little or no contact with it so far, you will start with the basics. What are pivot tables? How do you need to prepare your data so that you can handle it in pivot tables? How can you create pivot tables and what are their benefits? All these questions are answered in a practical way.
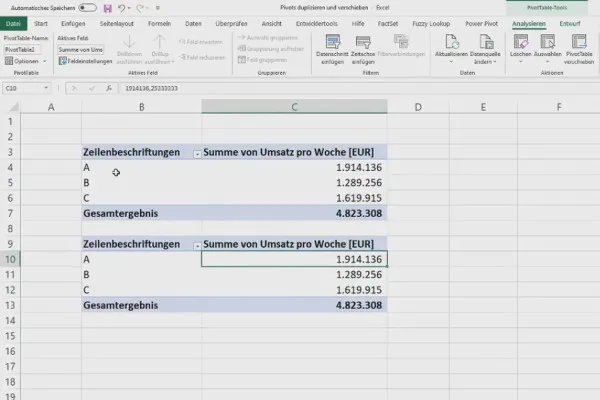
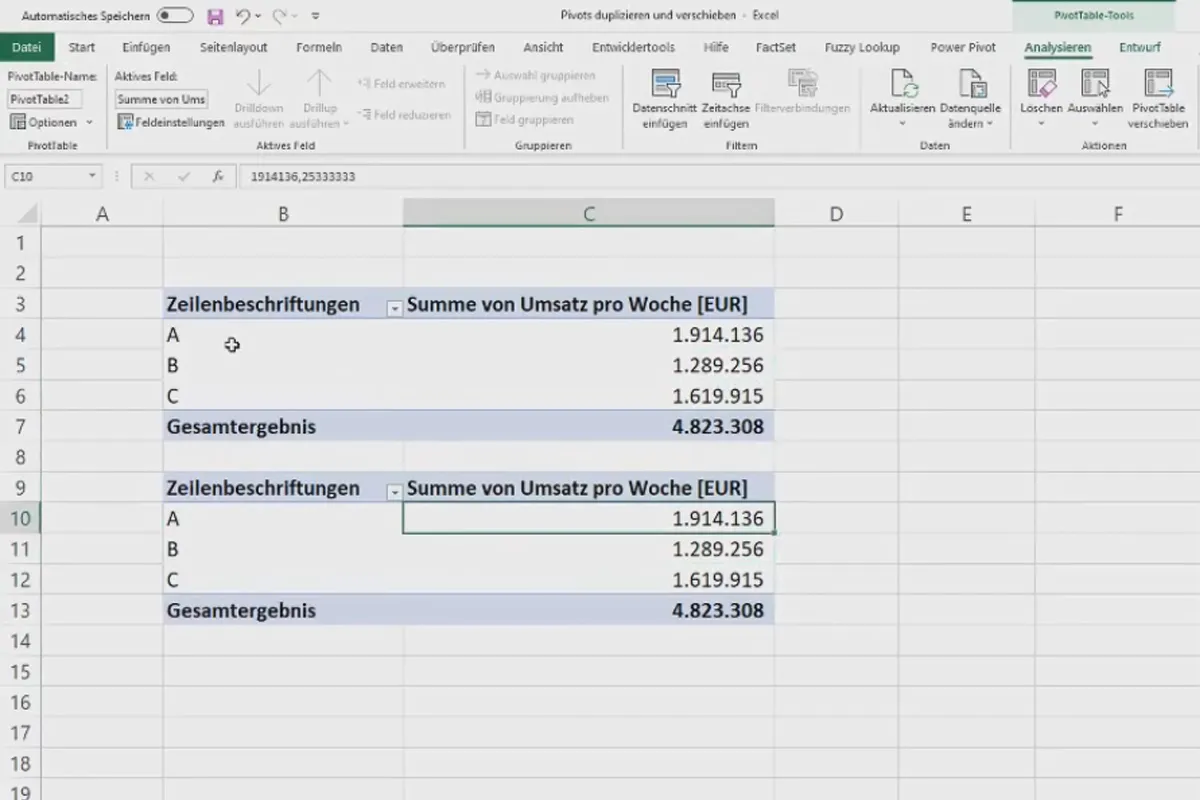
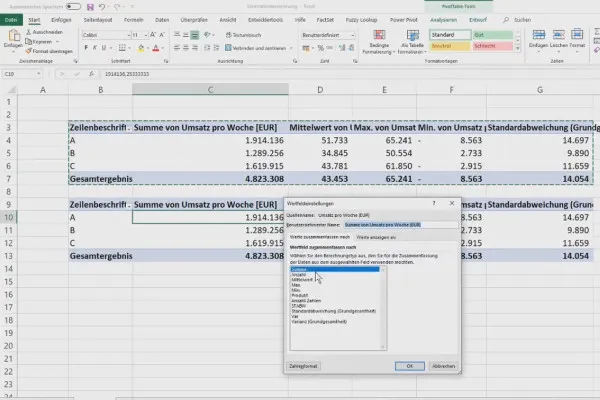
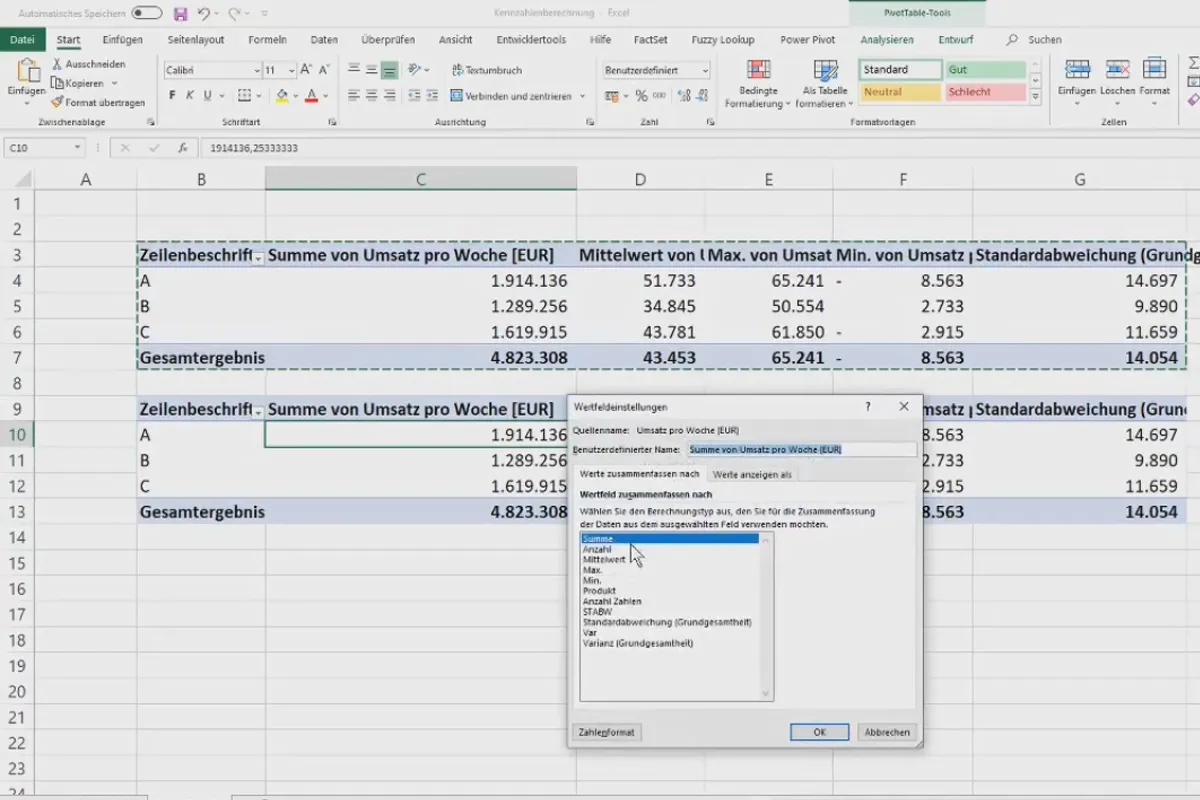
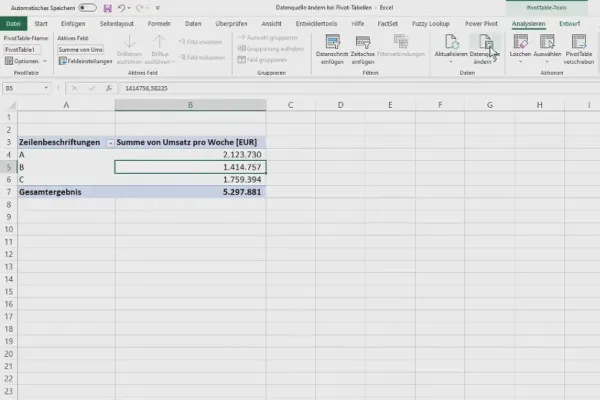
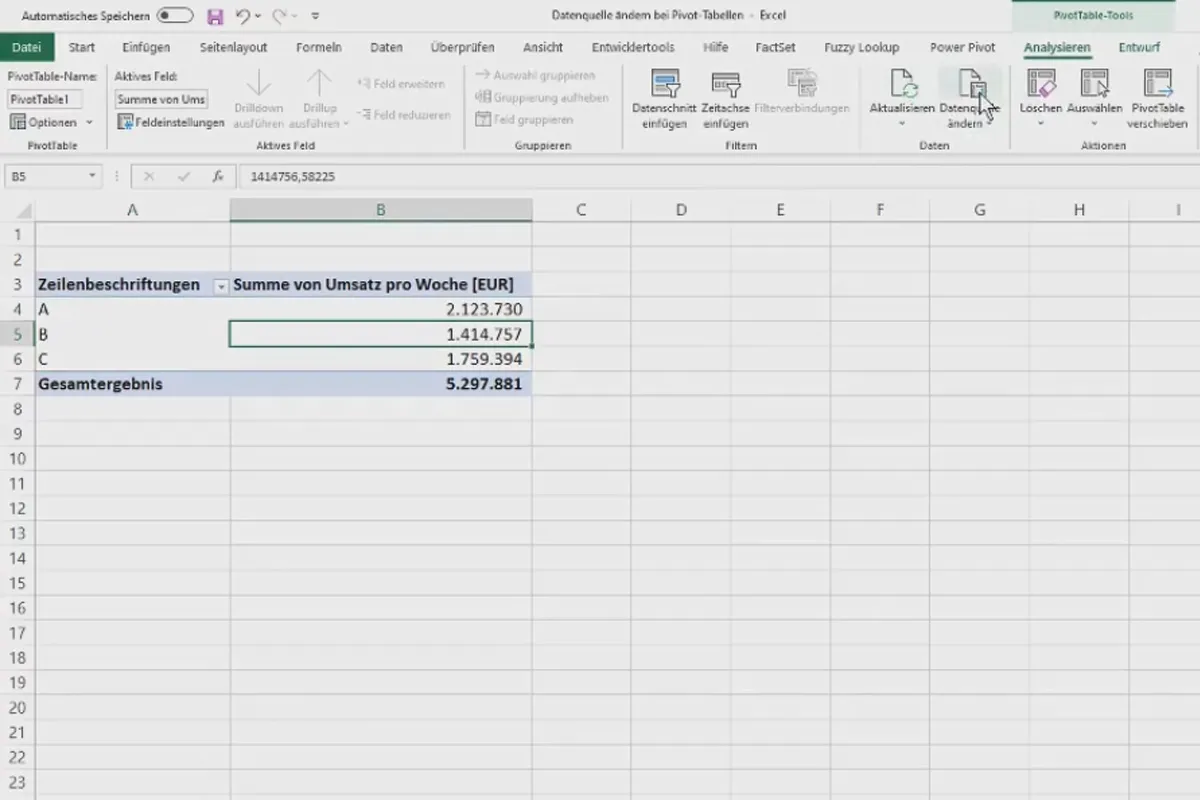
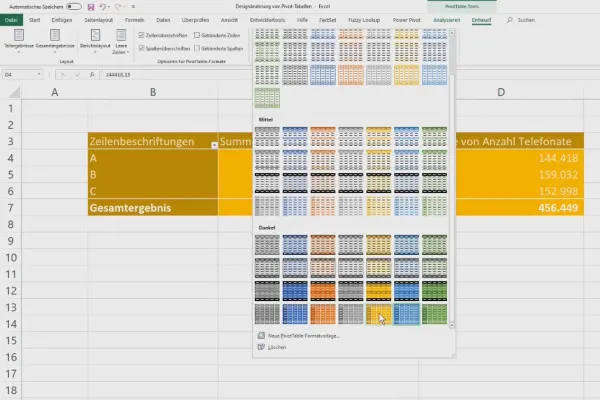
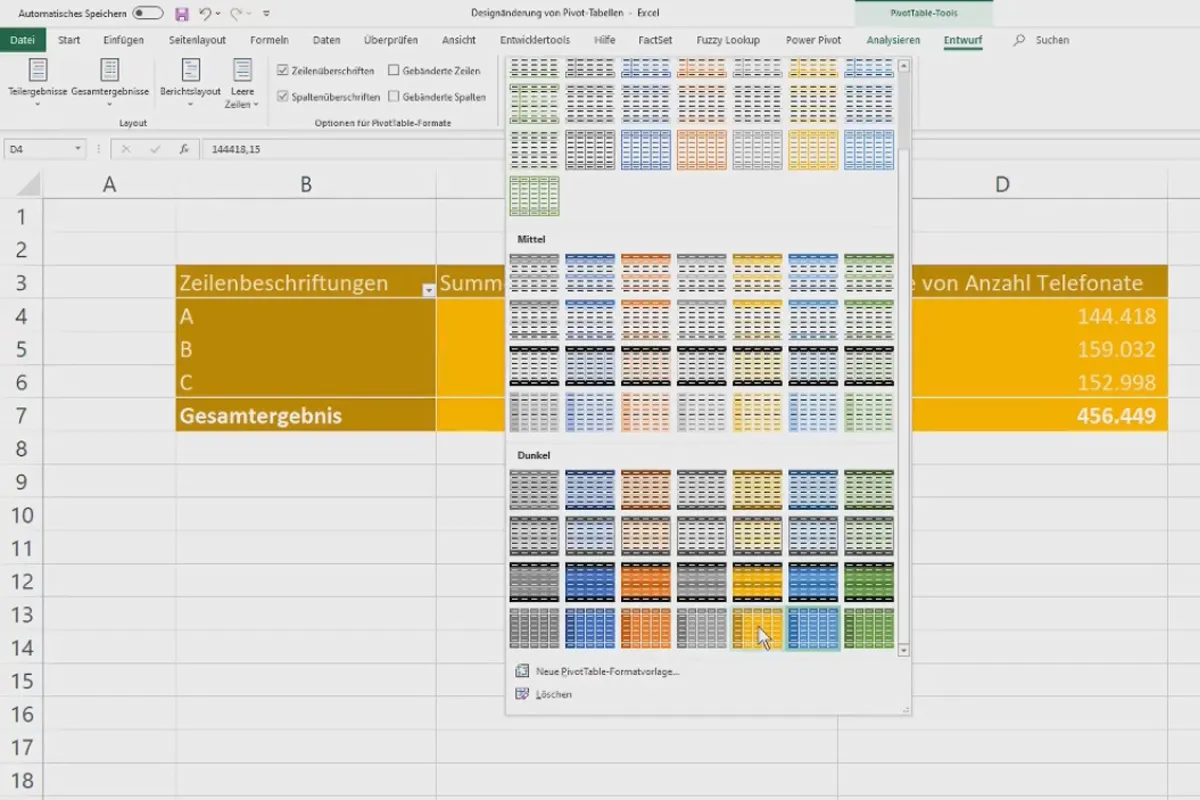
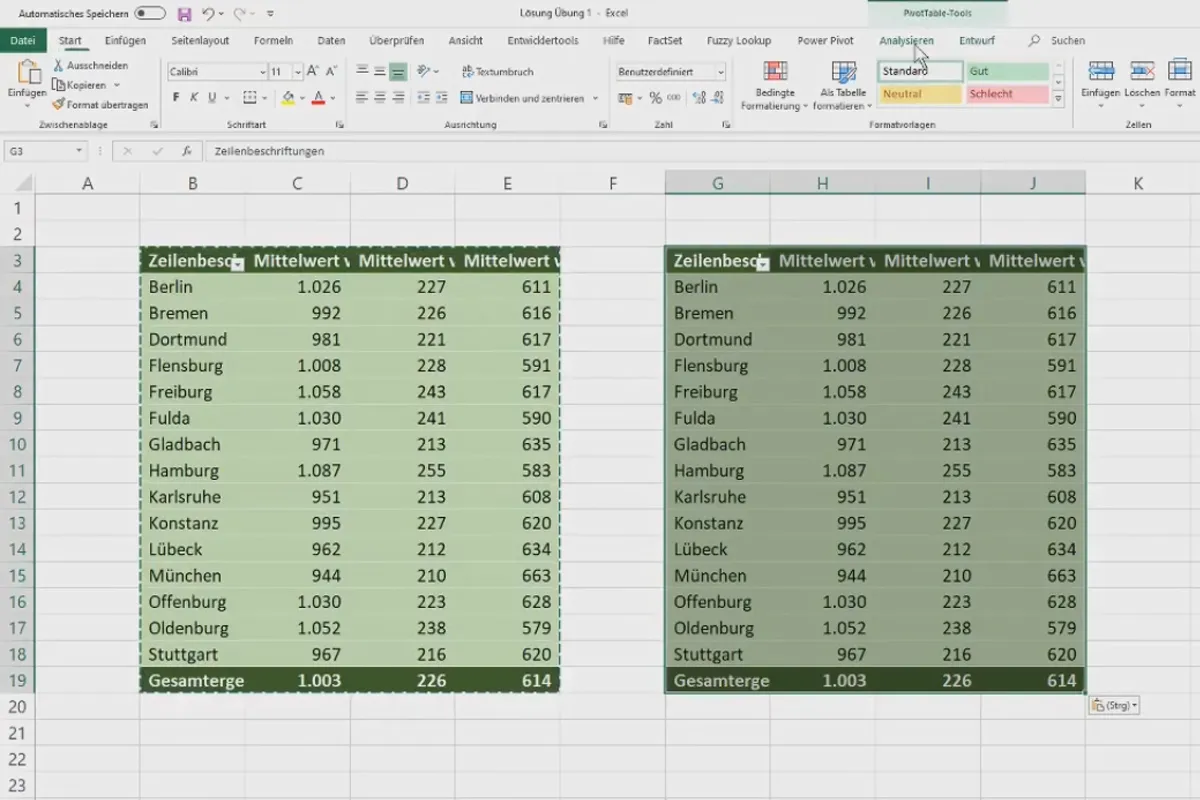
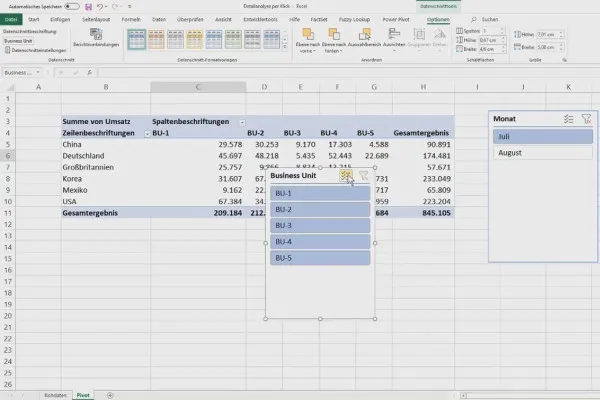
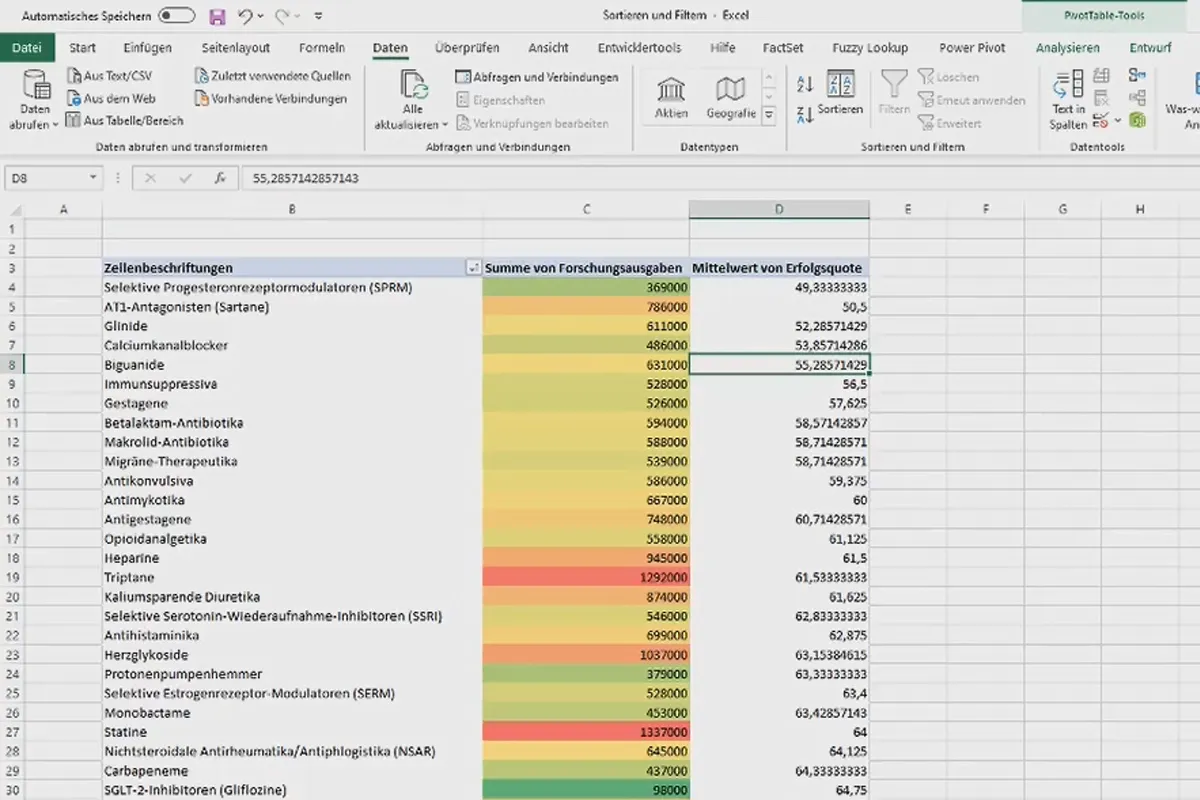
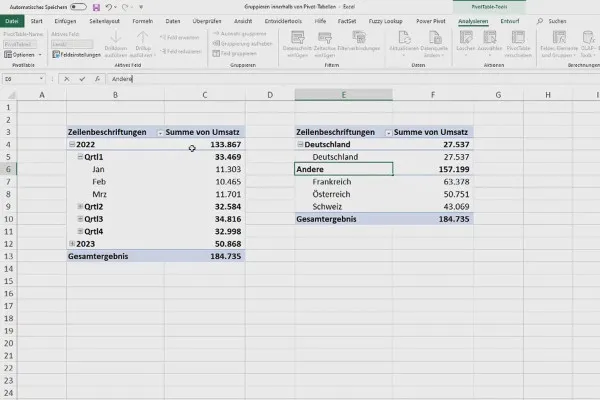
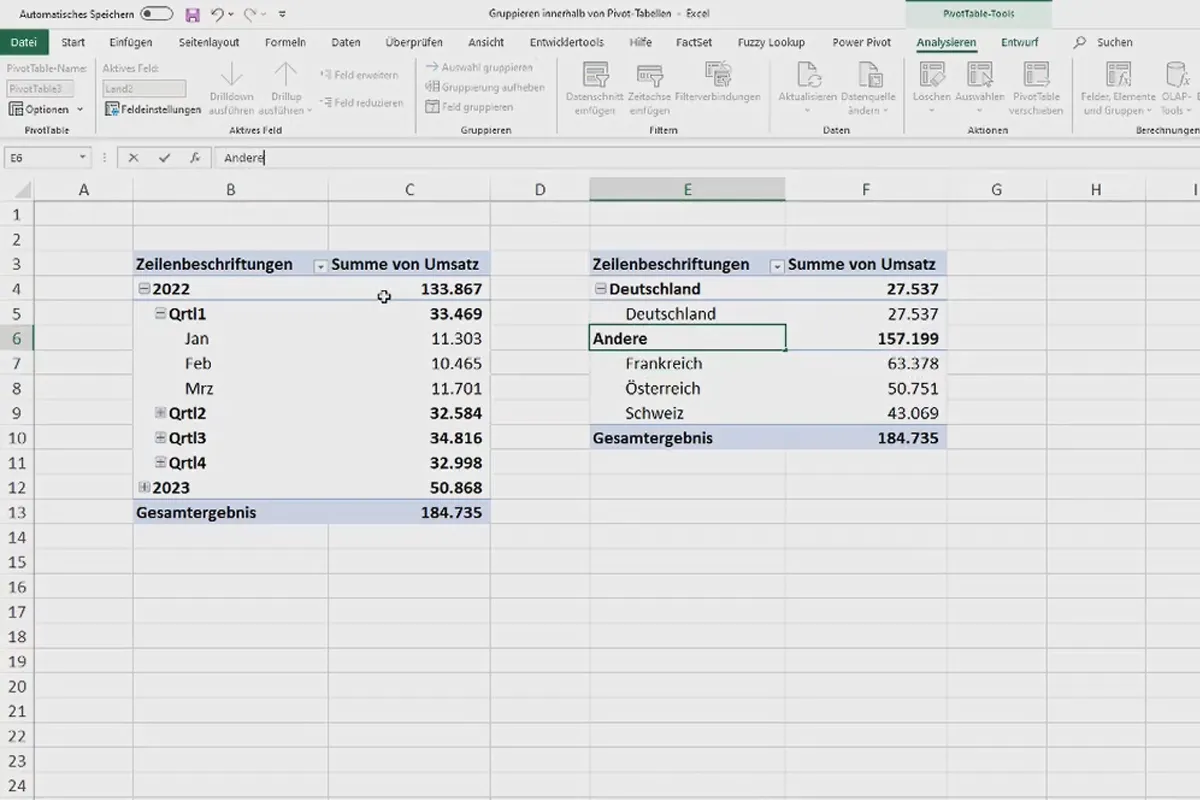
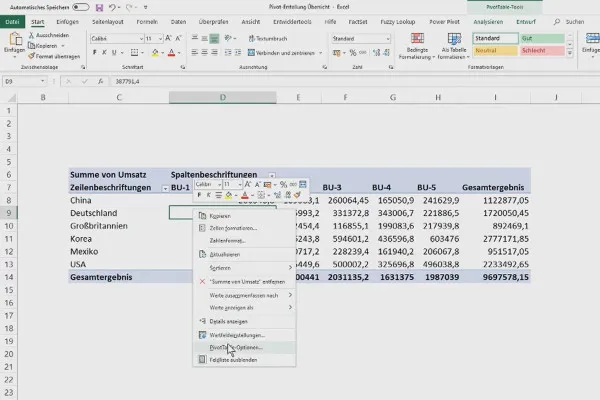
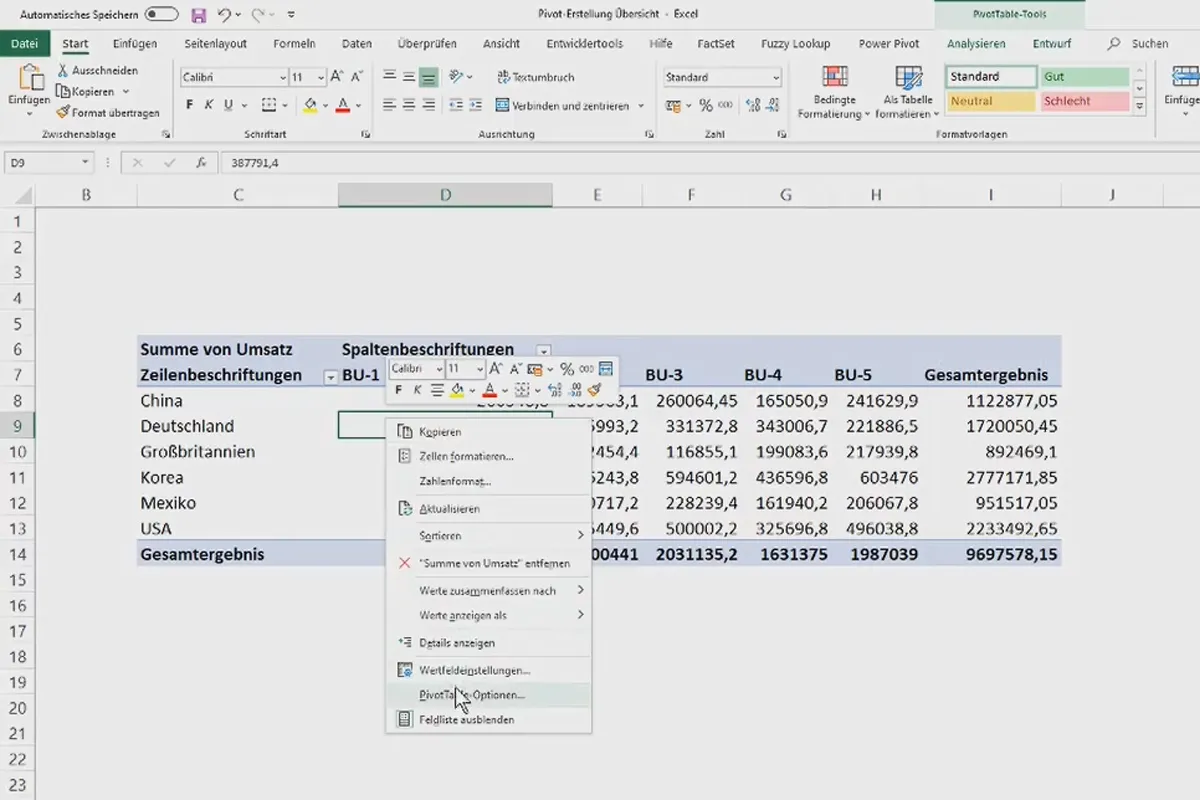
The modules of the course then build on each other step by step. You will first learn everything you need to know about using pivot tables in general, for example to move them or adjust their design.
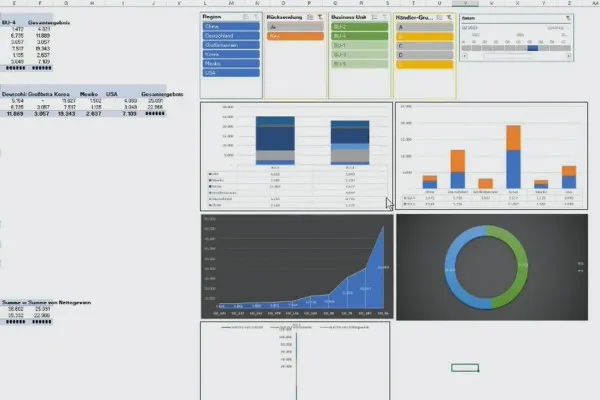
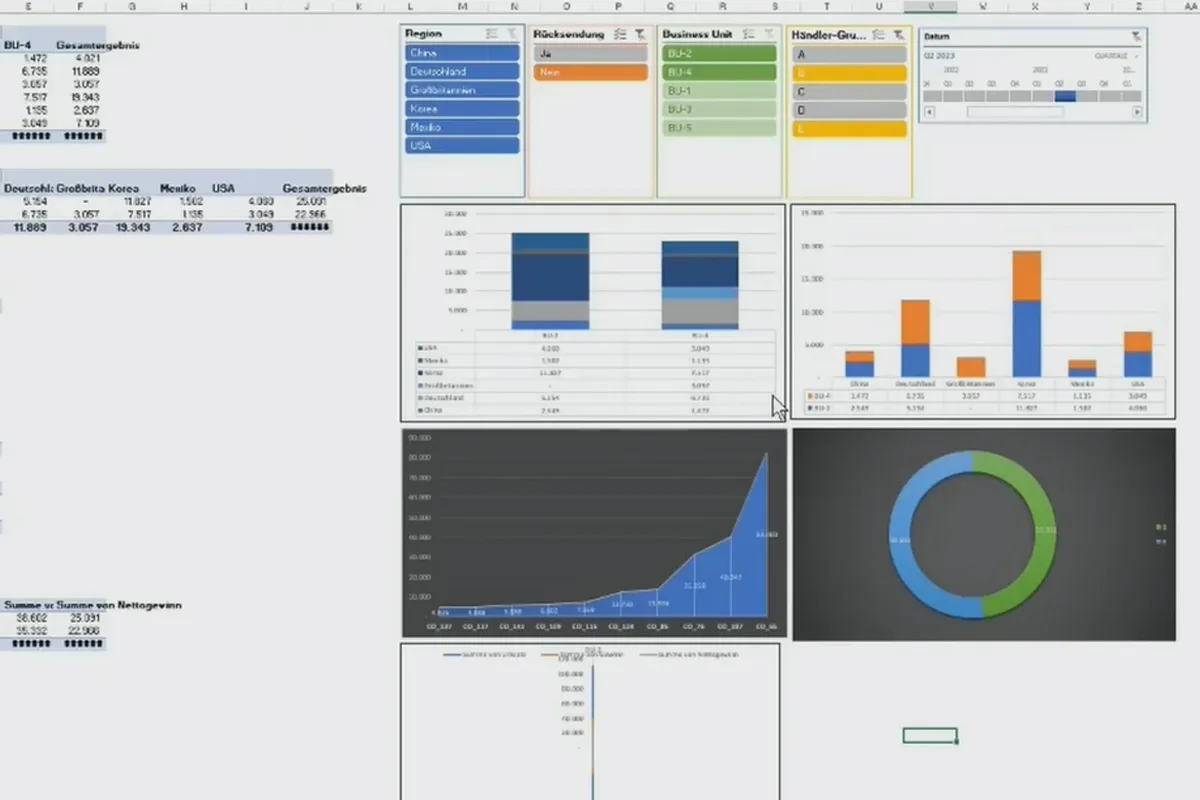
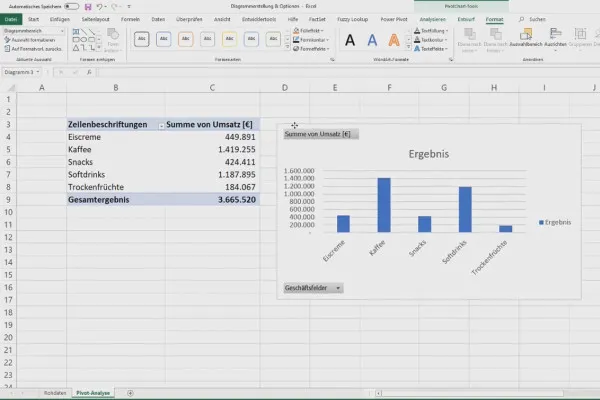
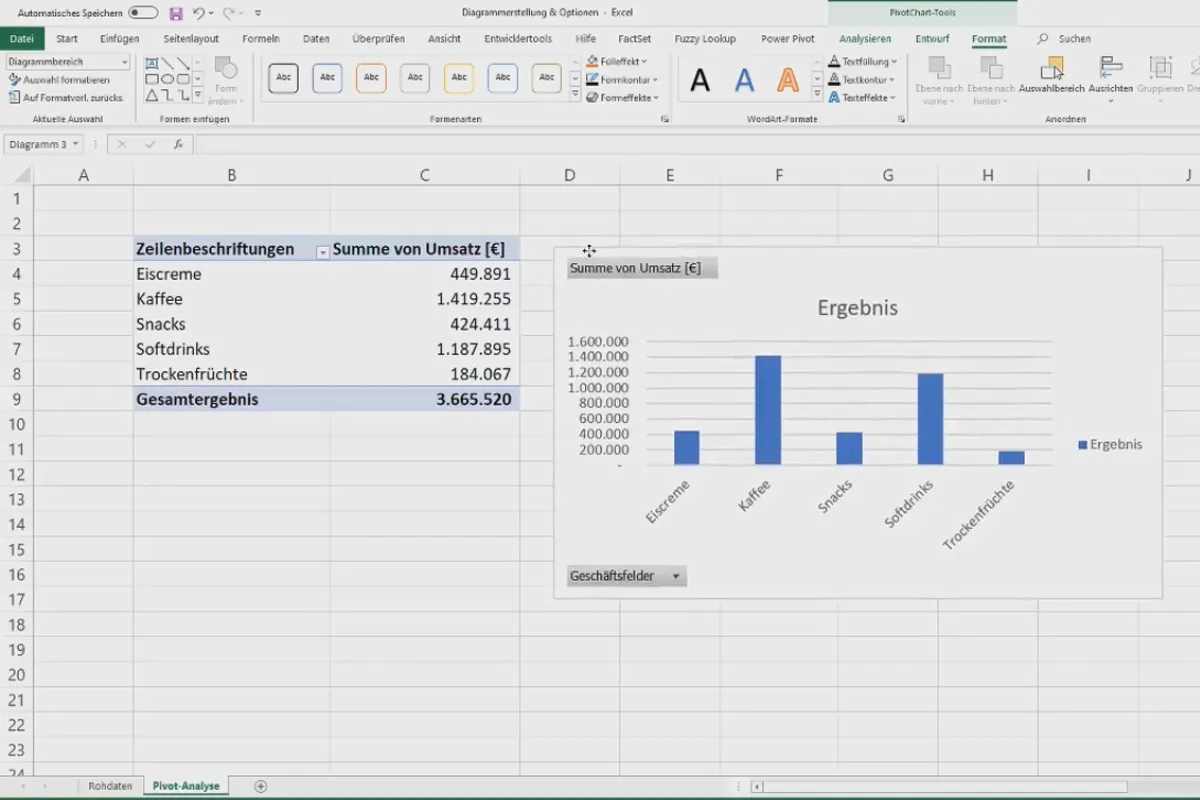
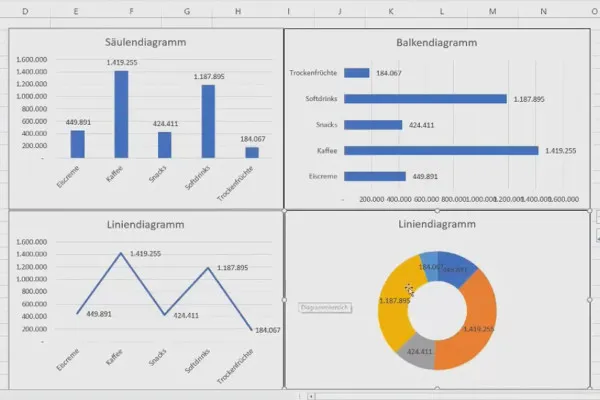
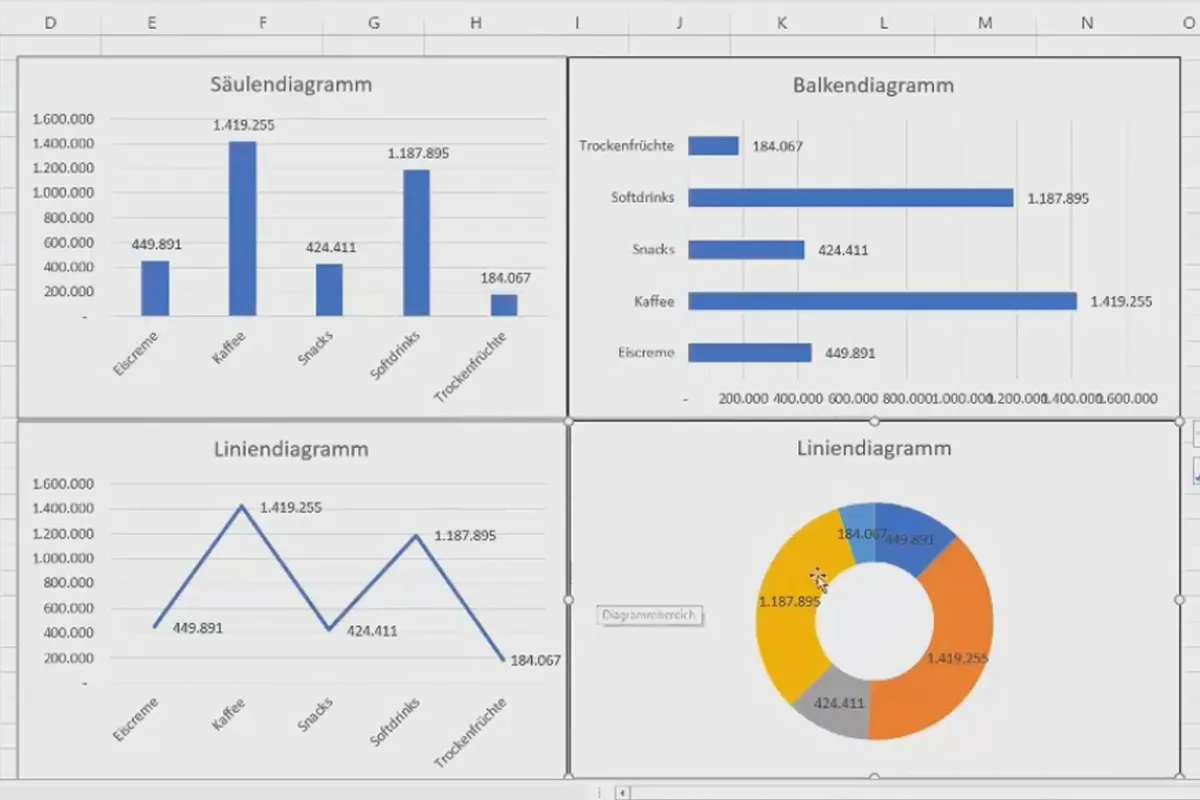
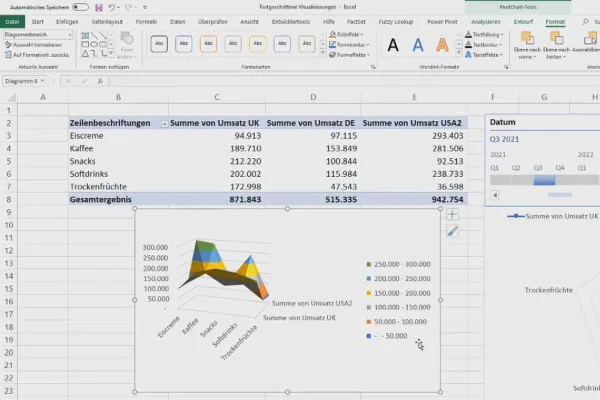
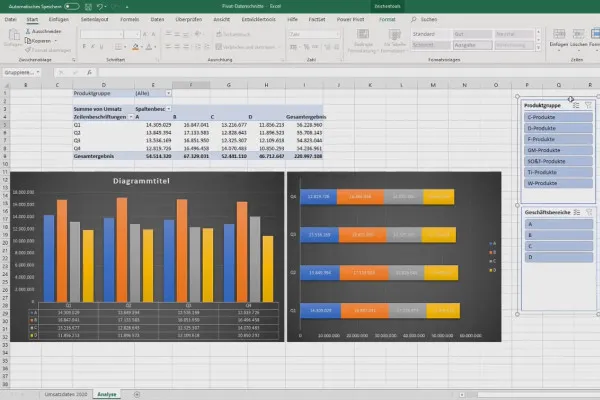
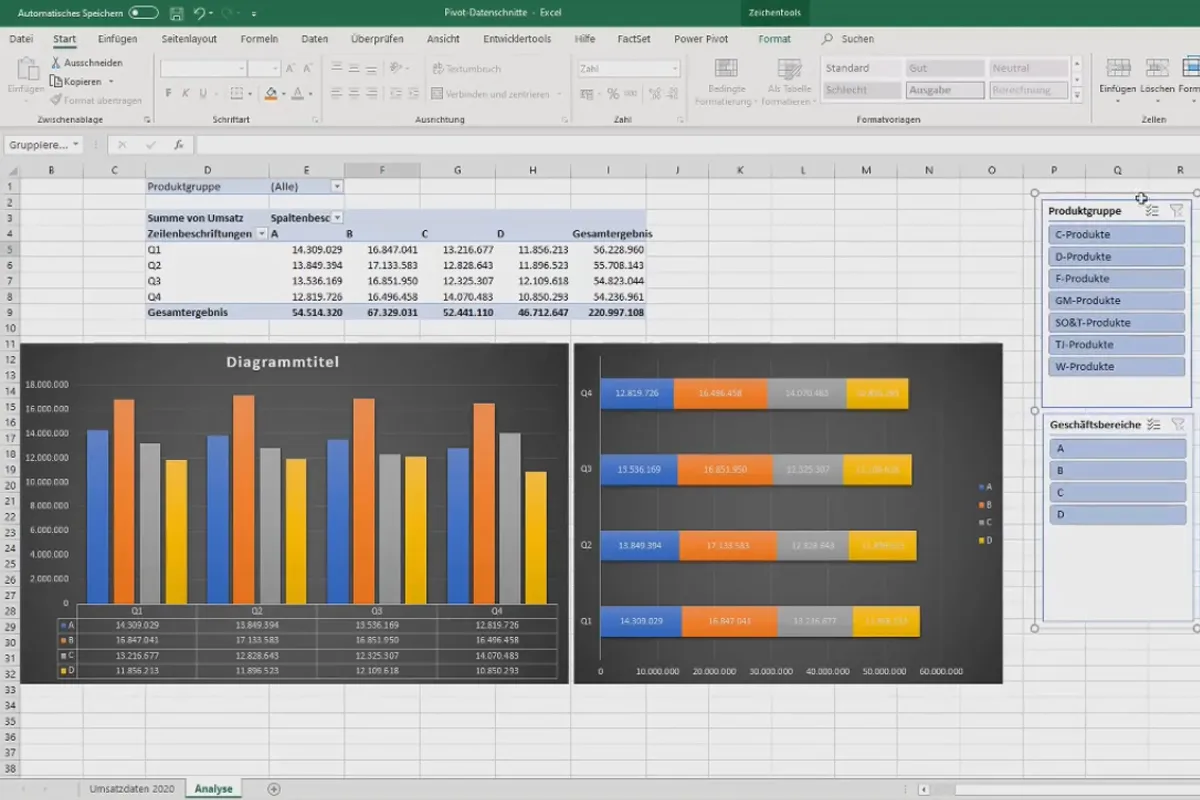
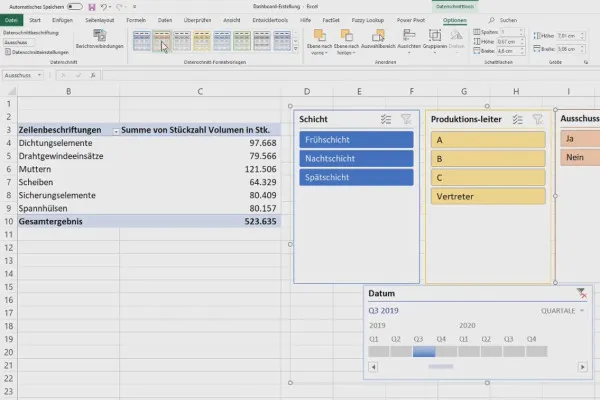
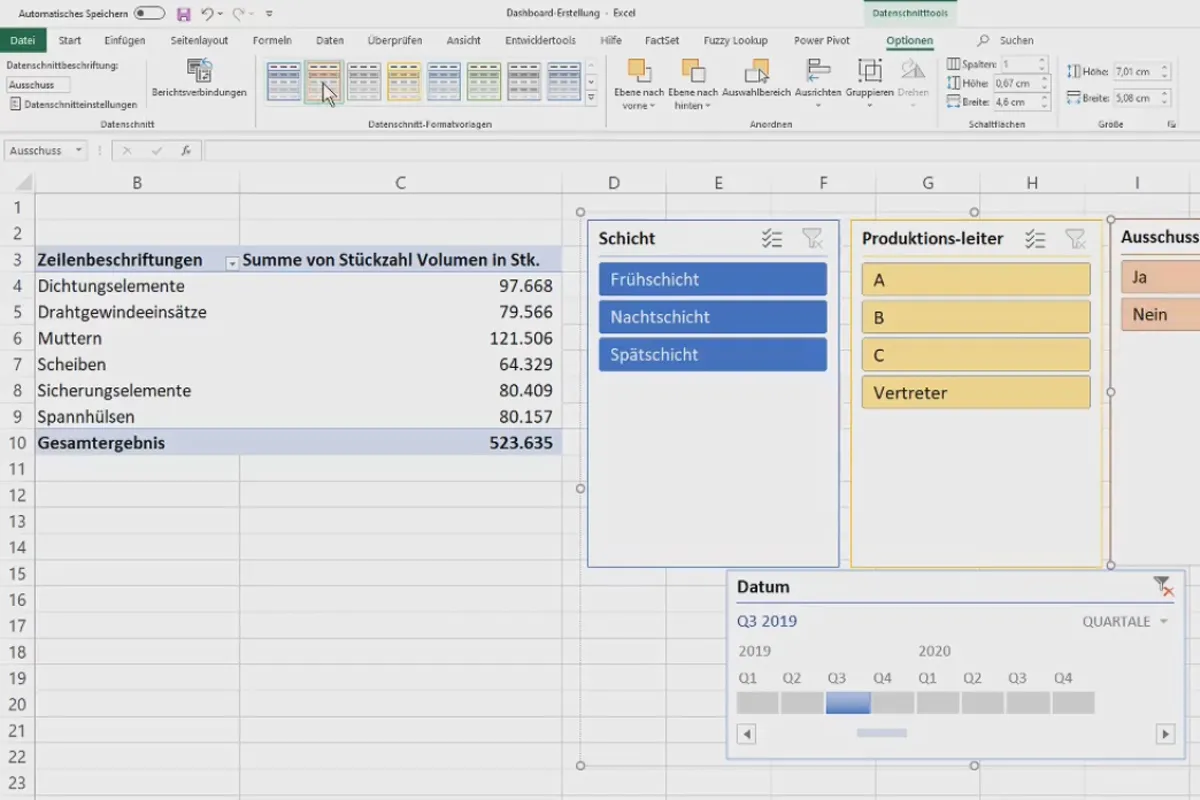
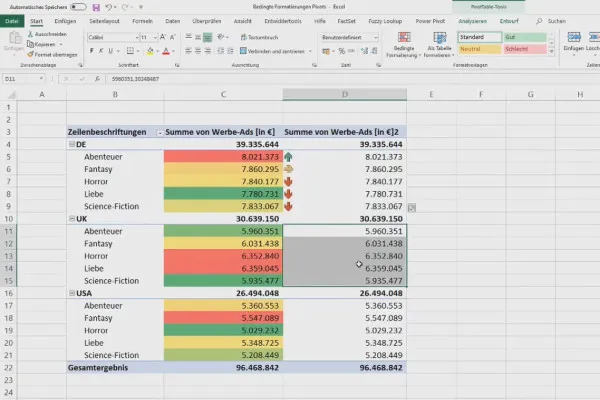
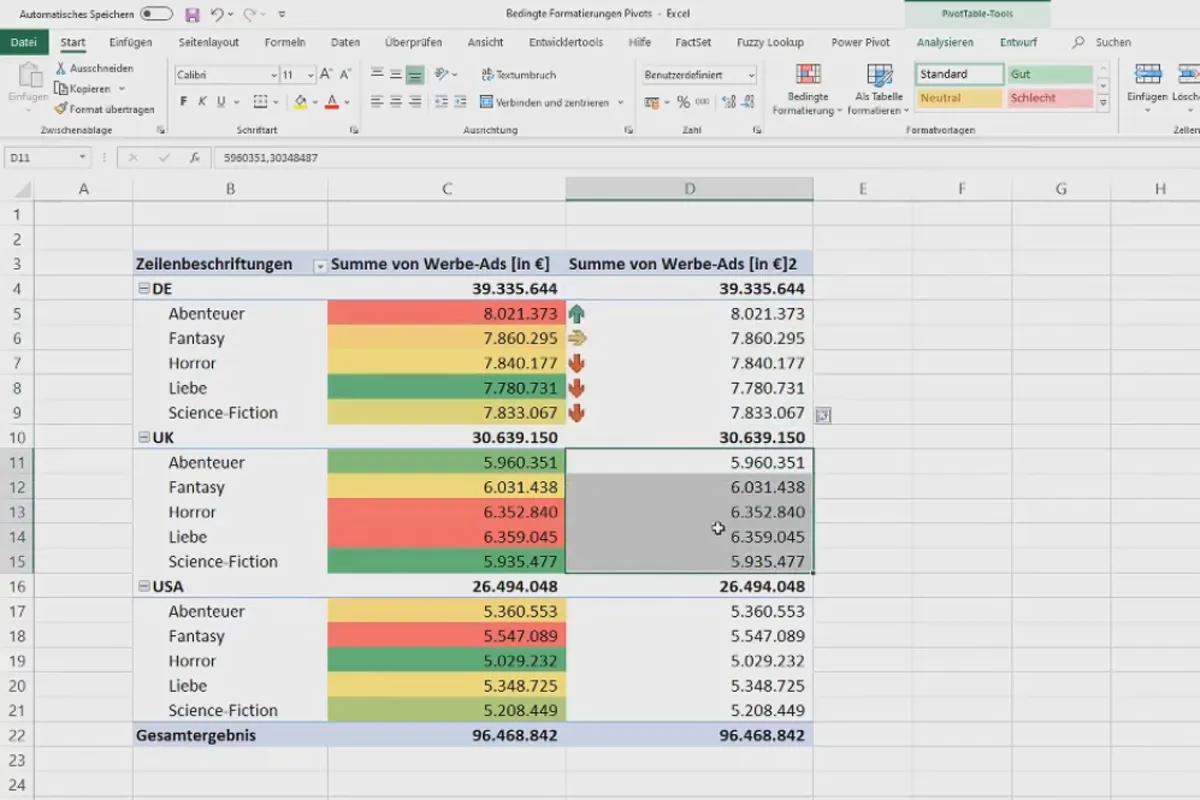
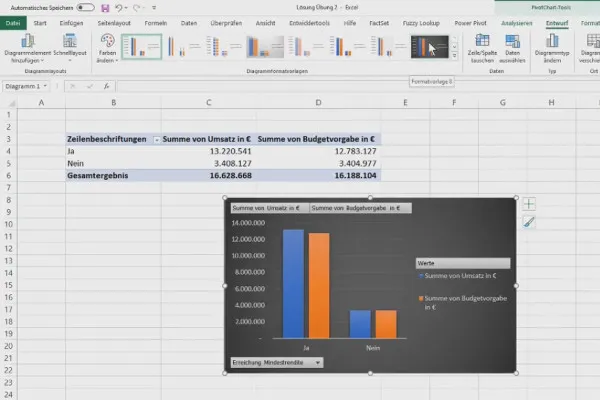
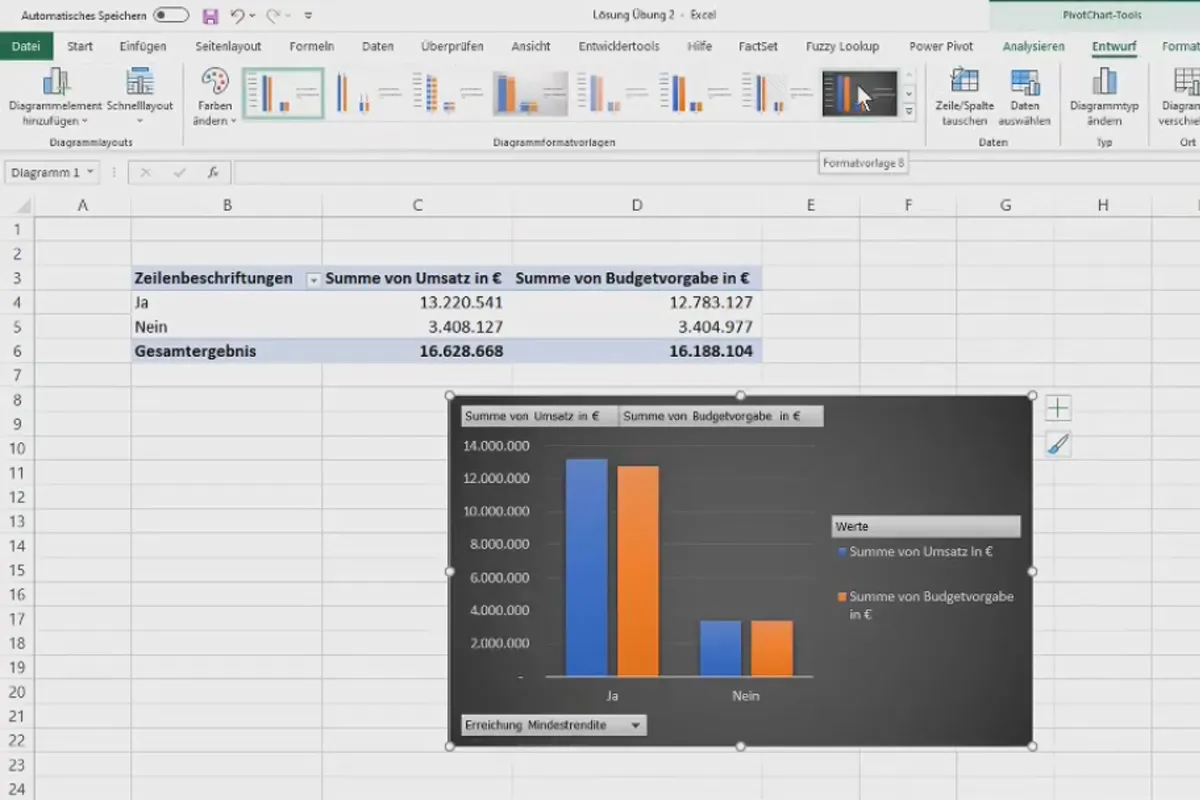
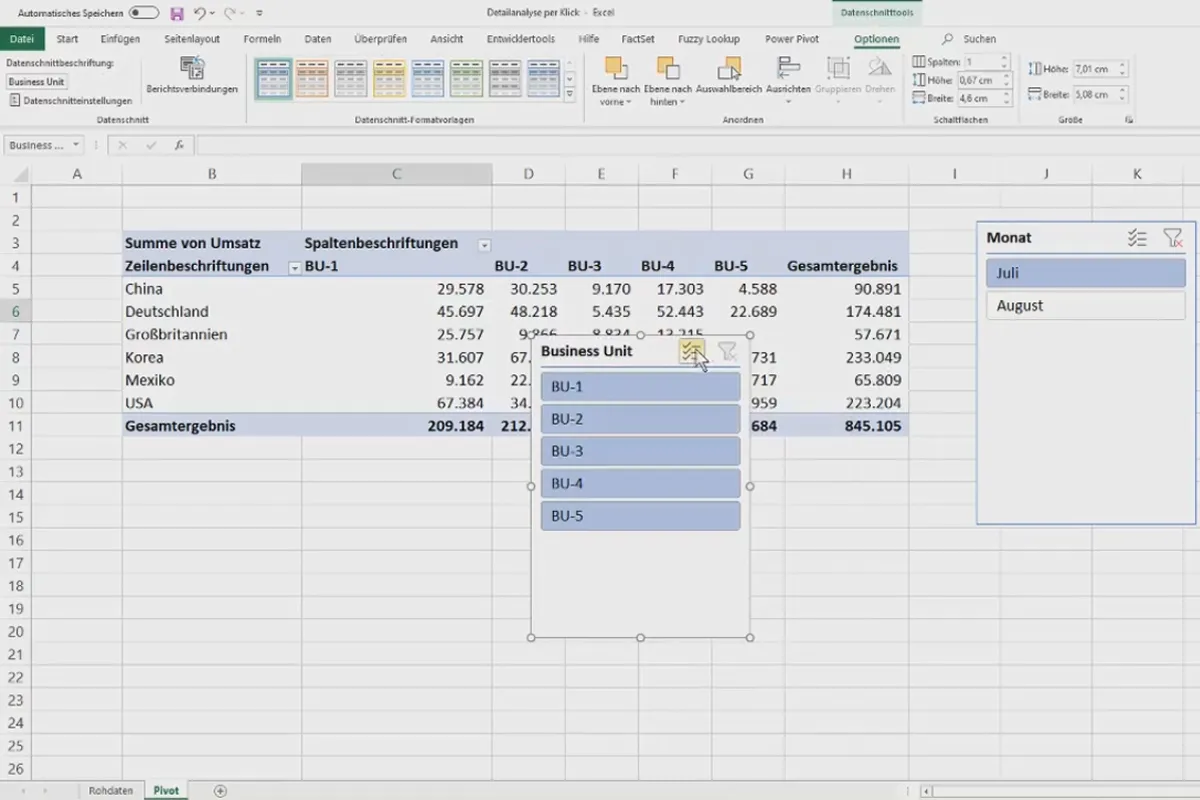
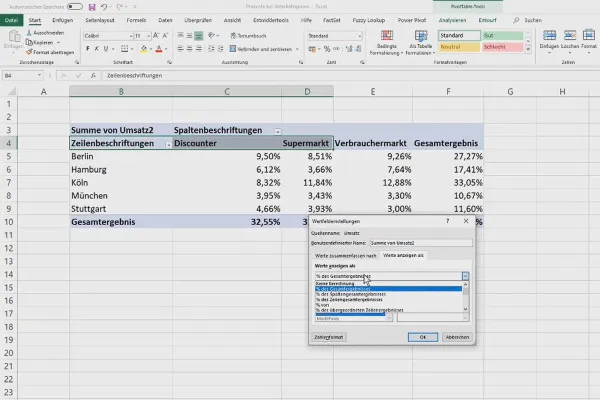
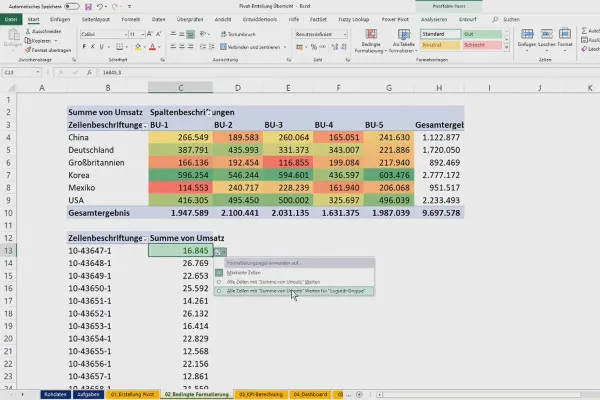
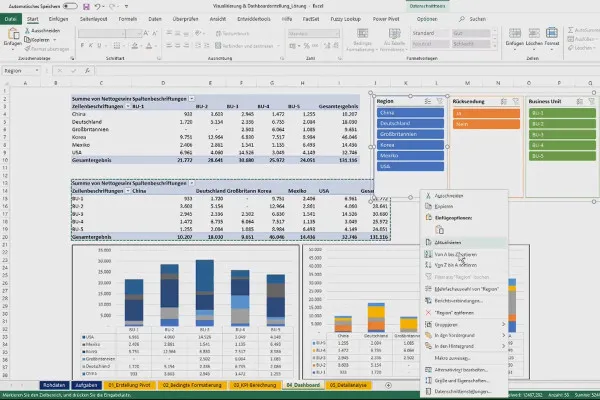
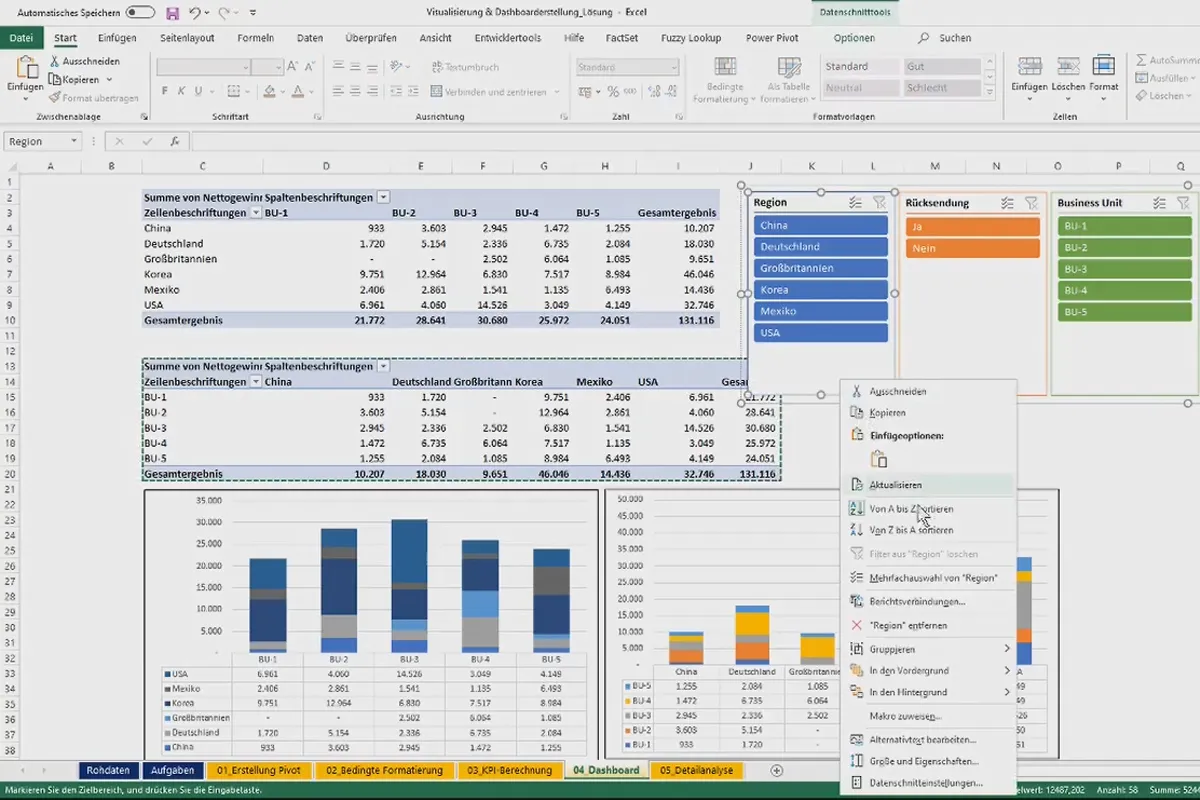
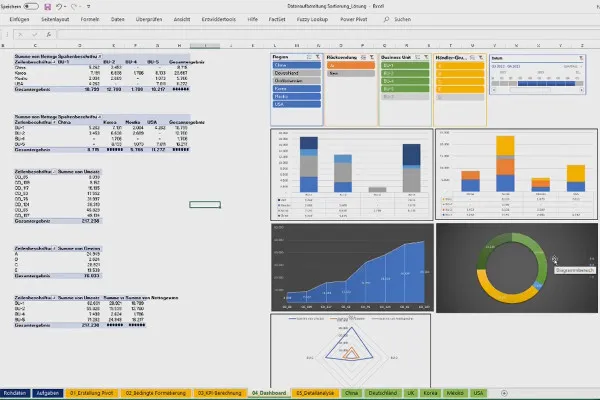
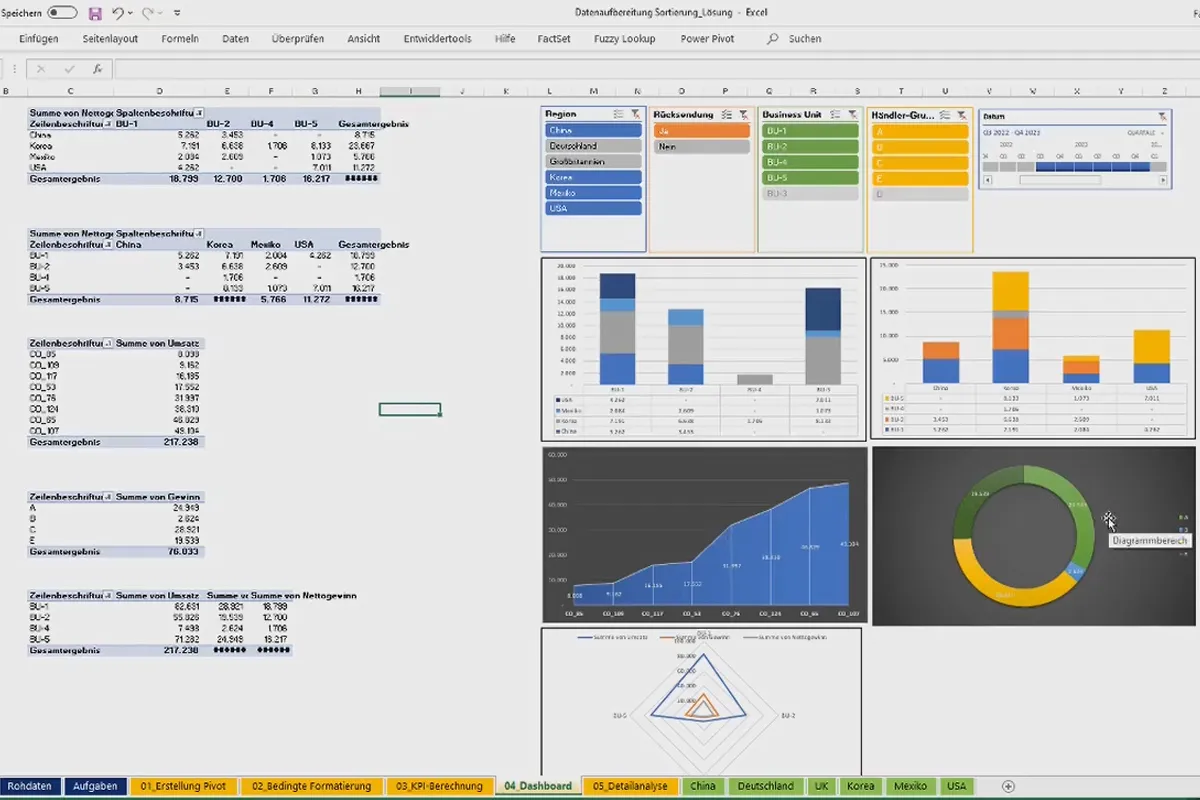
Your trainer will show you how to visualize your findings so that both you and others can easily read your analysis. This starts with simple diagrams and takes you past compound charts and advanced formatting through to comprehensive dashboards.
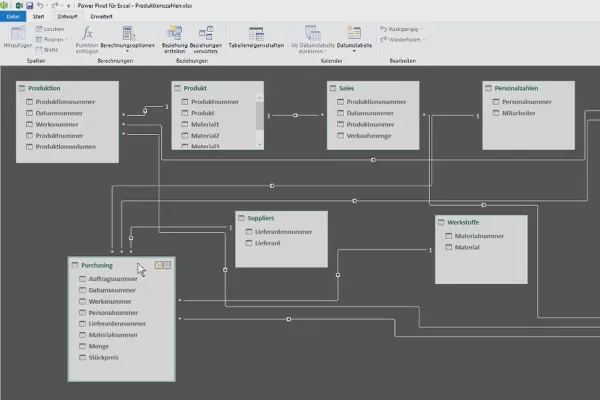
This will enable you to create informative and visually appealing reports in no time at all. To round things off, bonus chapters show you how to analyze your data even more effectively with the help of Power Pivot and Power BI.
Learn practically with the help of a case study and exercise materials
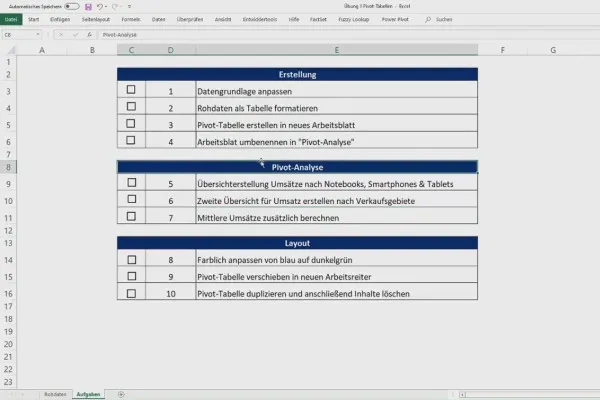
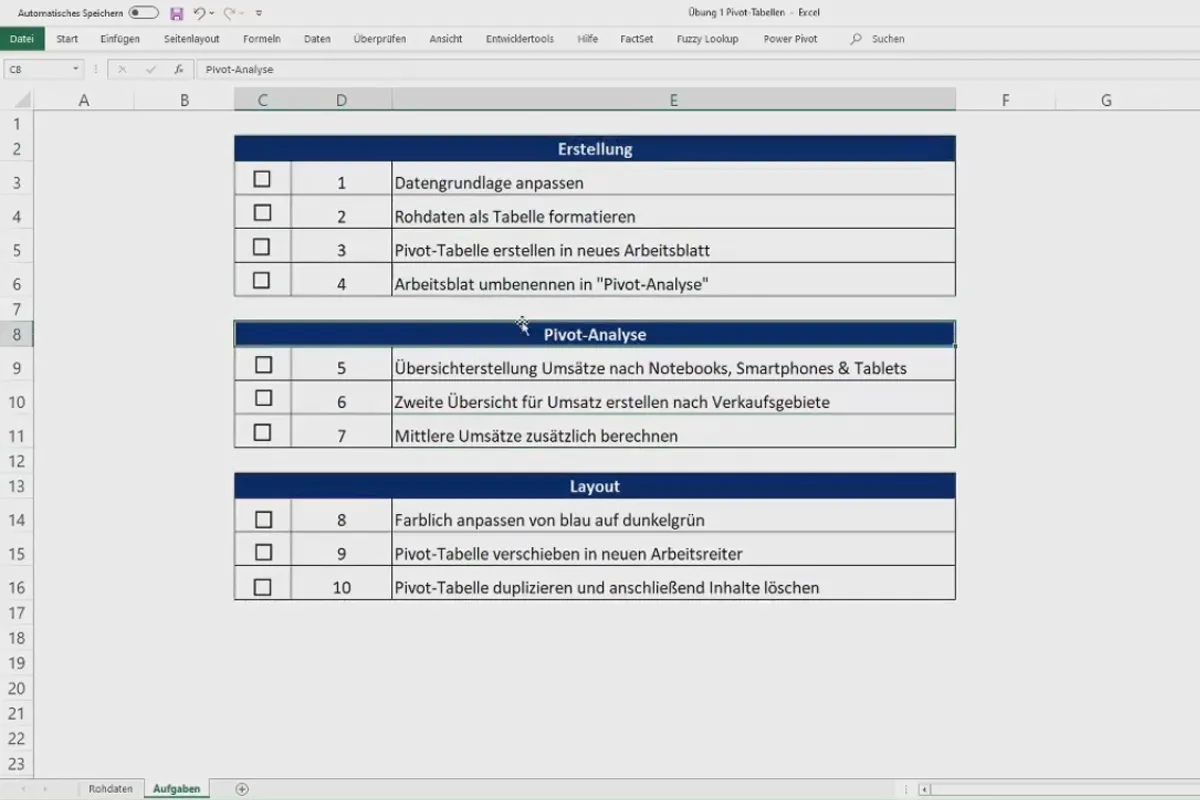
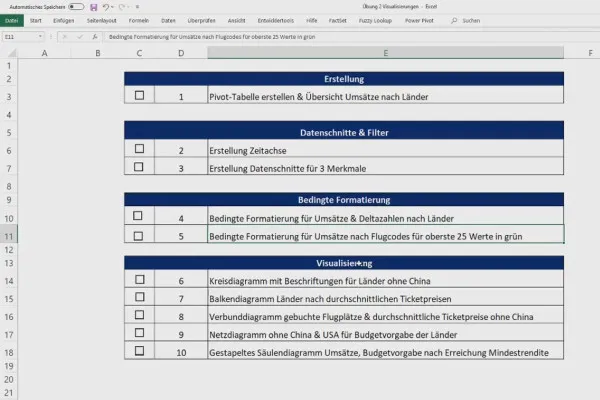
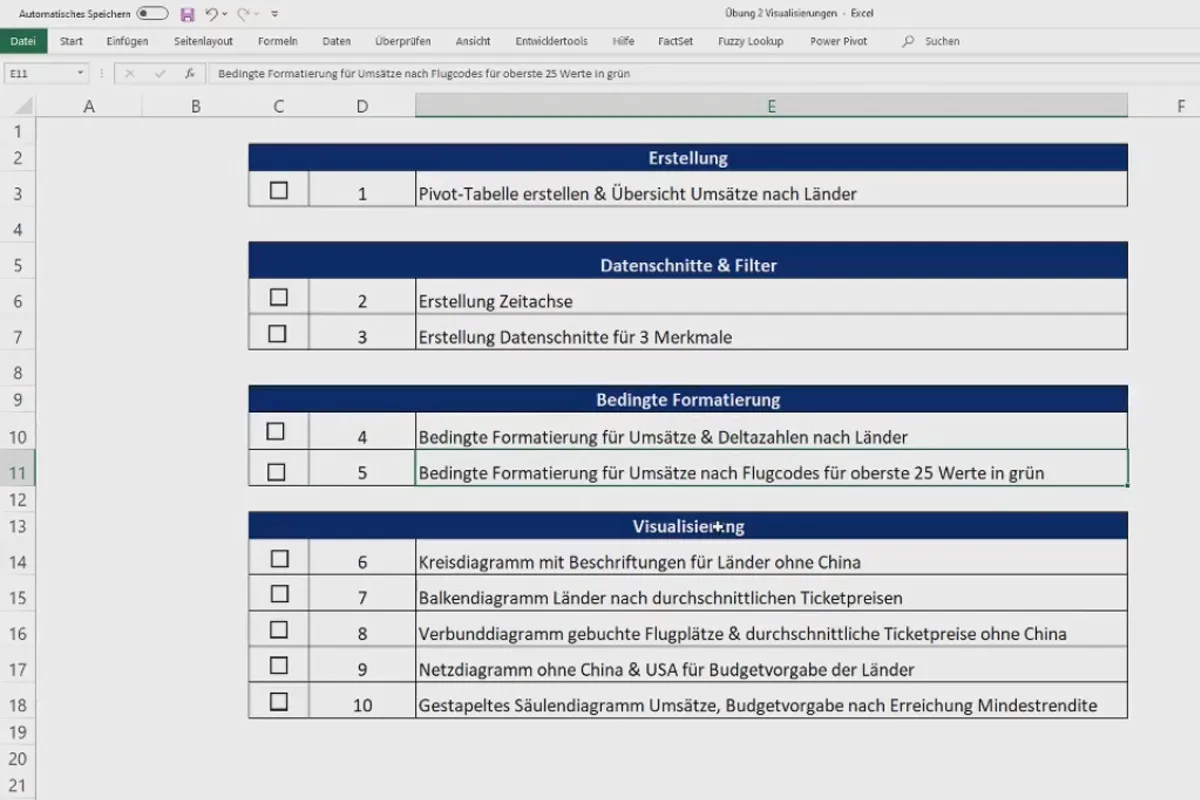
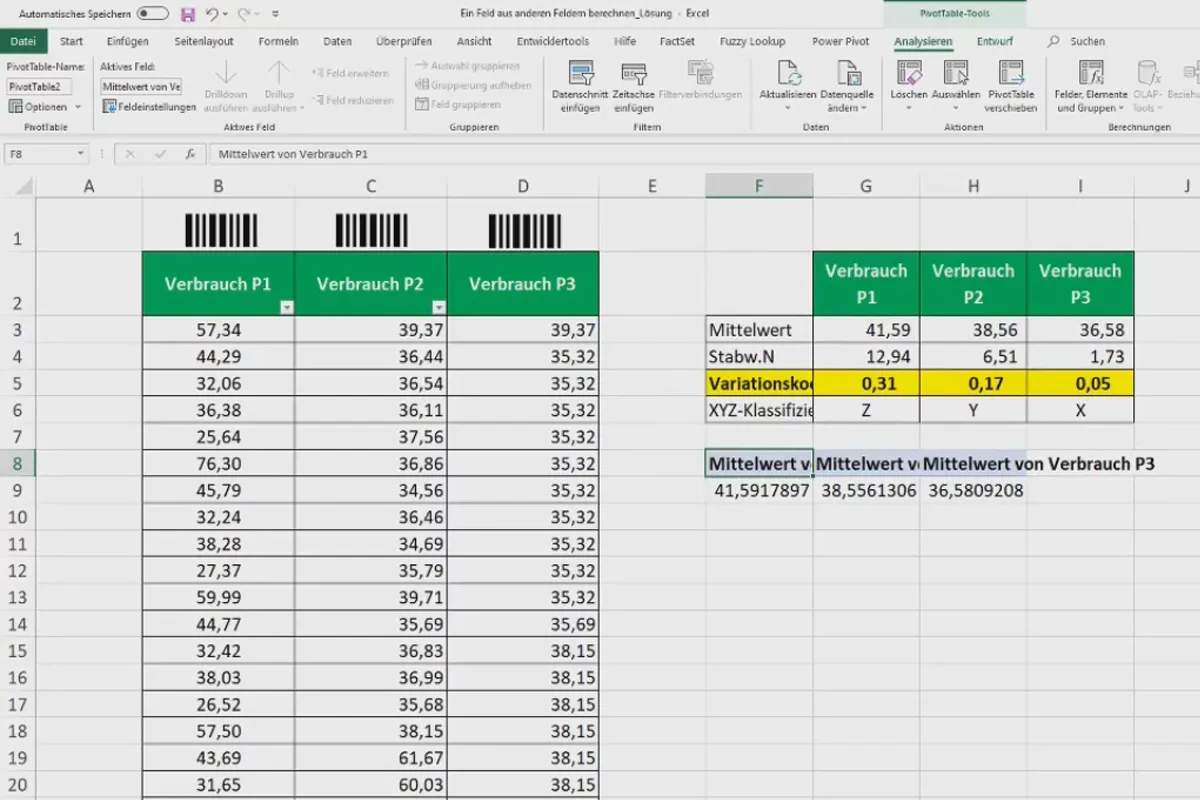
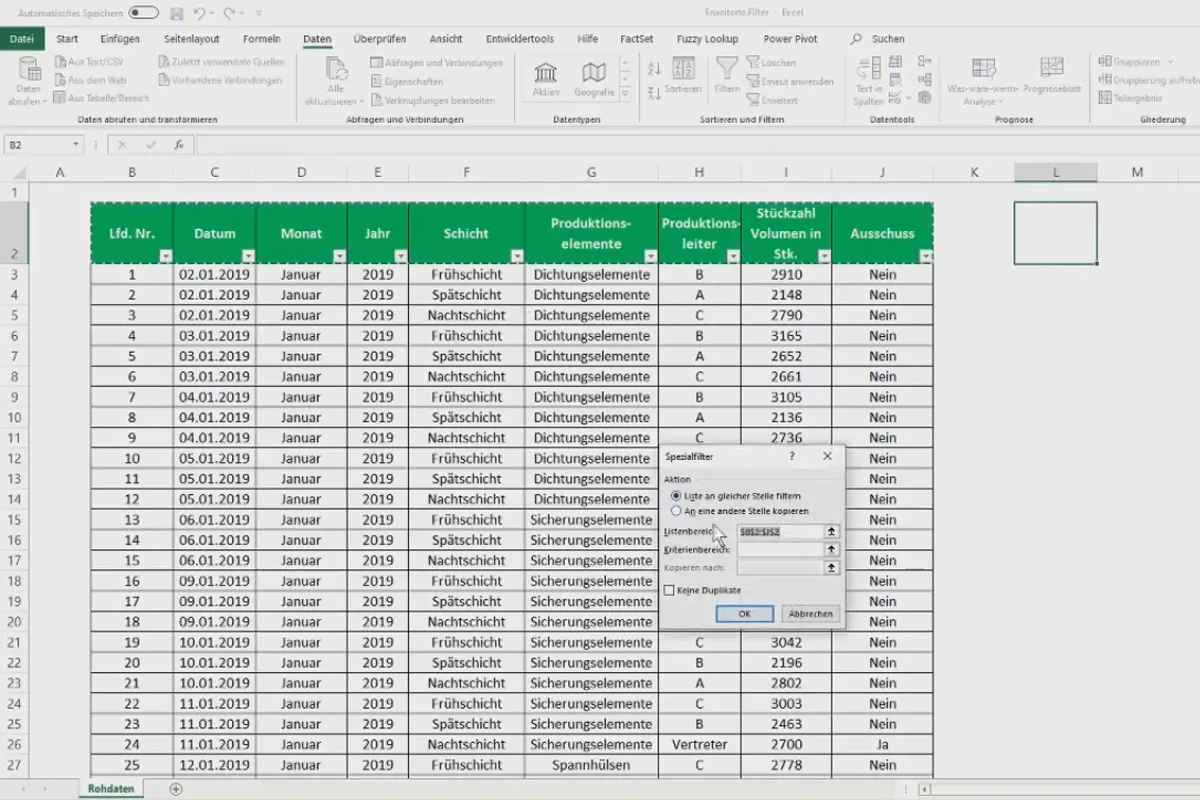
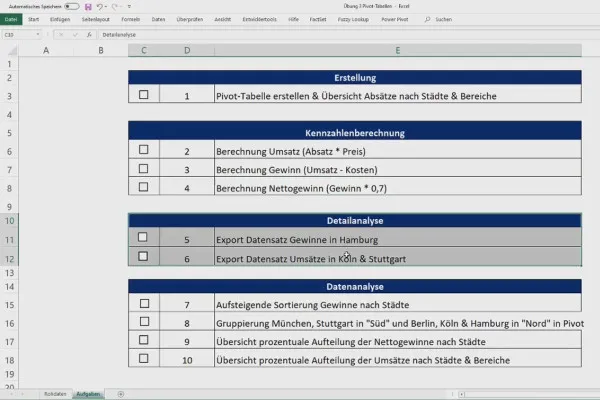
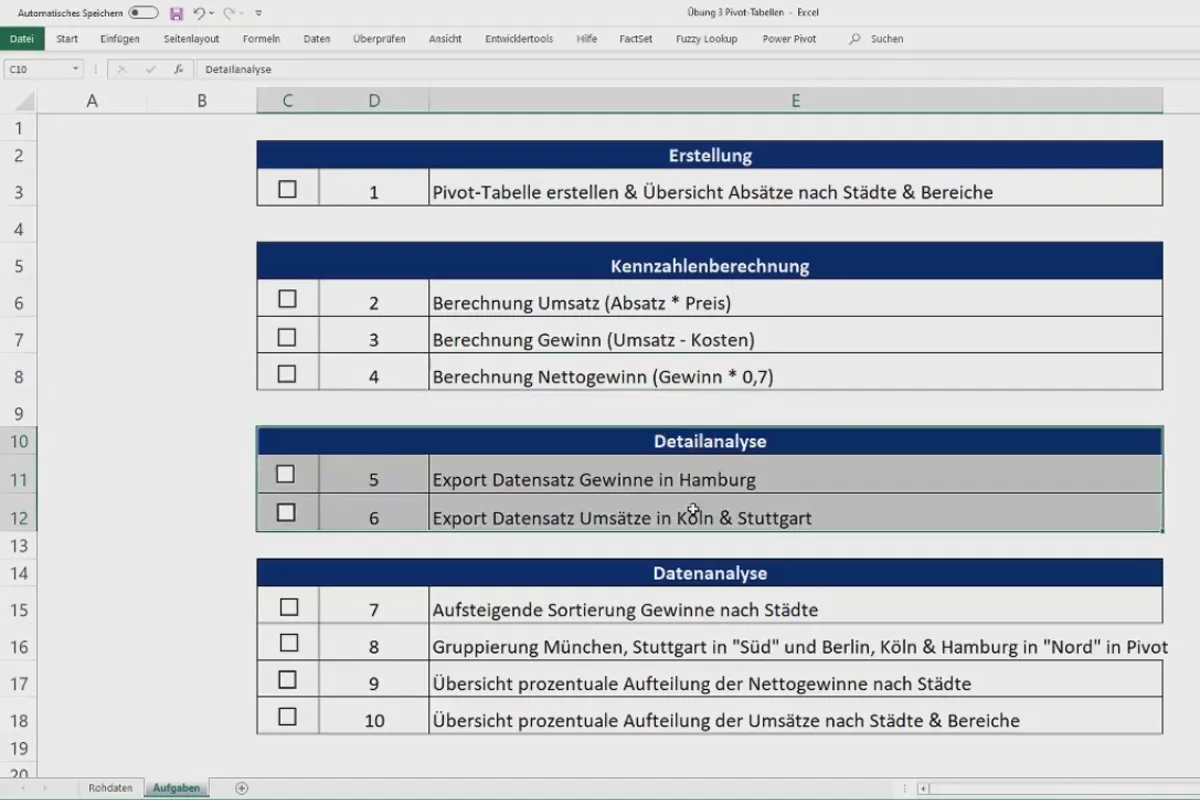
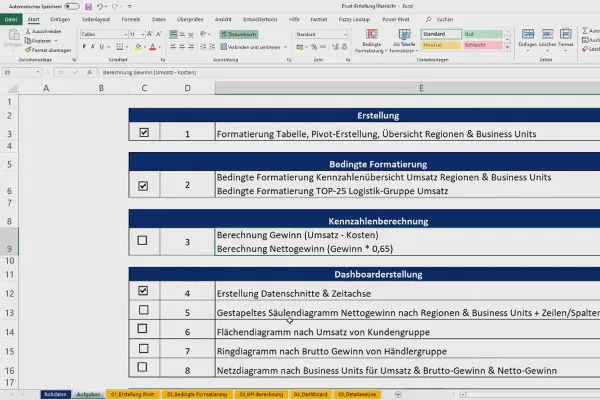
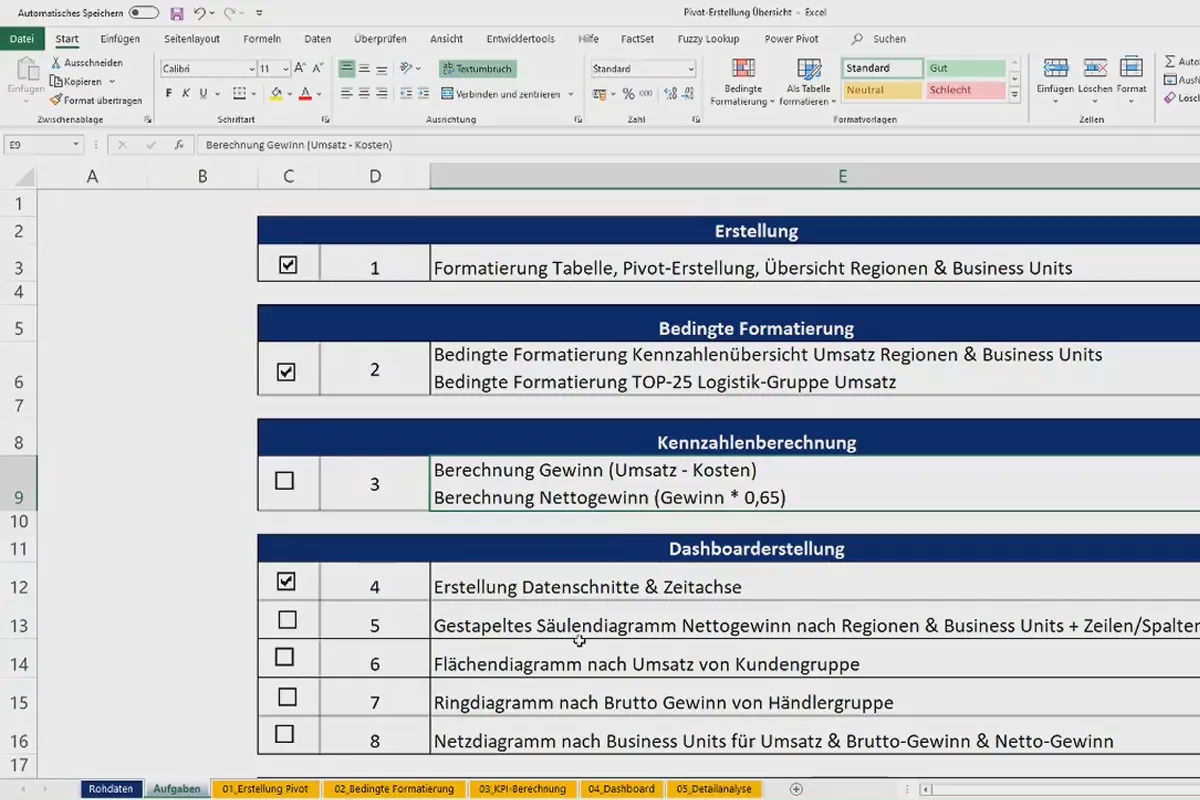
As in our other Excel courses by Fabio Basler, the same applies here: After each module, you will receive an exercise task that you can carry out yourself using the raw Excel data provided . After you have tried your hand, your trainer will present you with the solutions. This will help you remember what you have seen and apply it directly.
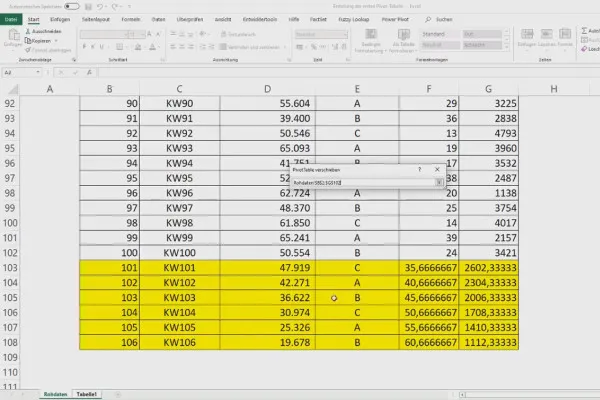
During the course, you will also encounter a case study in which the theory is summarized and applied in a practical way. When it comes to pivot tables, this course is more than just the perfect introduction: Get to know pivot tables and their benefits comprehensively, from A to Z!
Other users are also interested
Faster results in your tables

With flyer, business card & Co.
Create, set up & optimize online advertising
How to build trust with customers

Effectively create modern slides
This saves you time and effort!

Fully equipped from flyer to roll-up

For complete business equipment


