Key Insights
- PowerPoint offers various style templates and diagram designs to help you quickly create appealing diagrams.
- You can easily navigate through the templates and customize them to suit your needs.
- With just a few clicks, you can optimize the data labels and layout of your diagrams.
Step-by-Step Guide
To efficiently design the diagrams in PowerPoint, follow these steps:
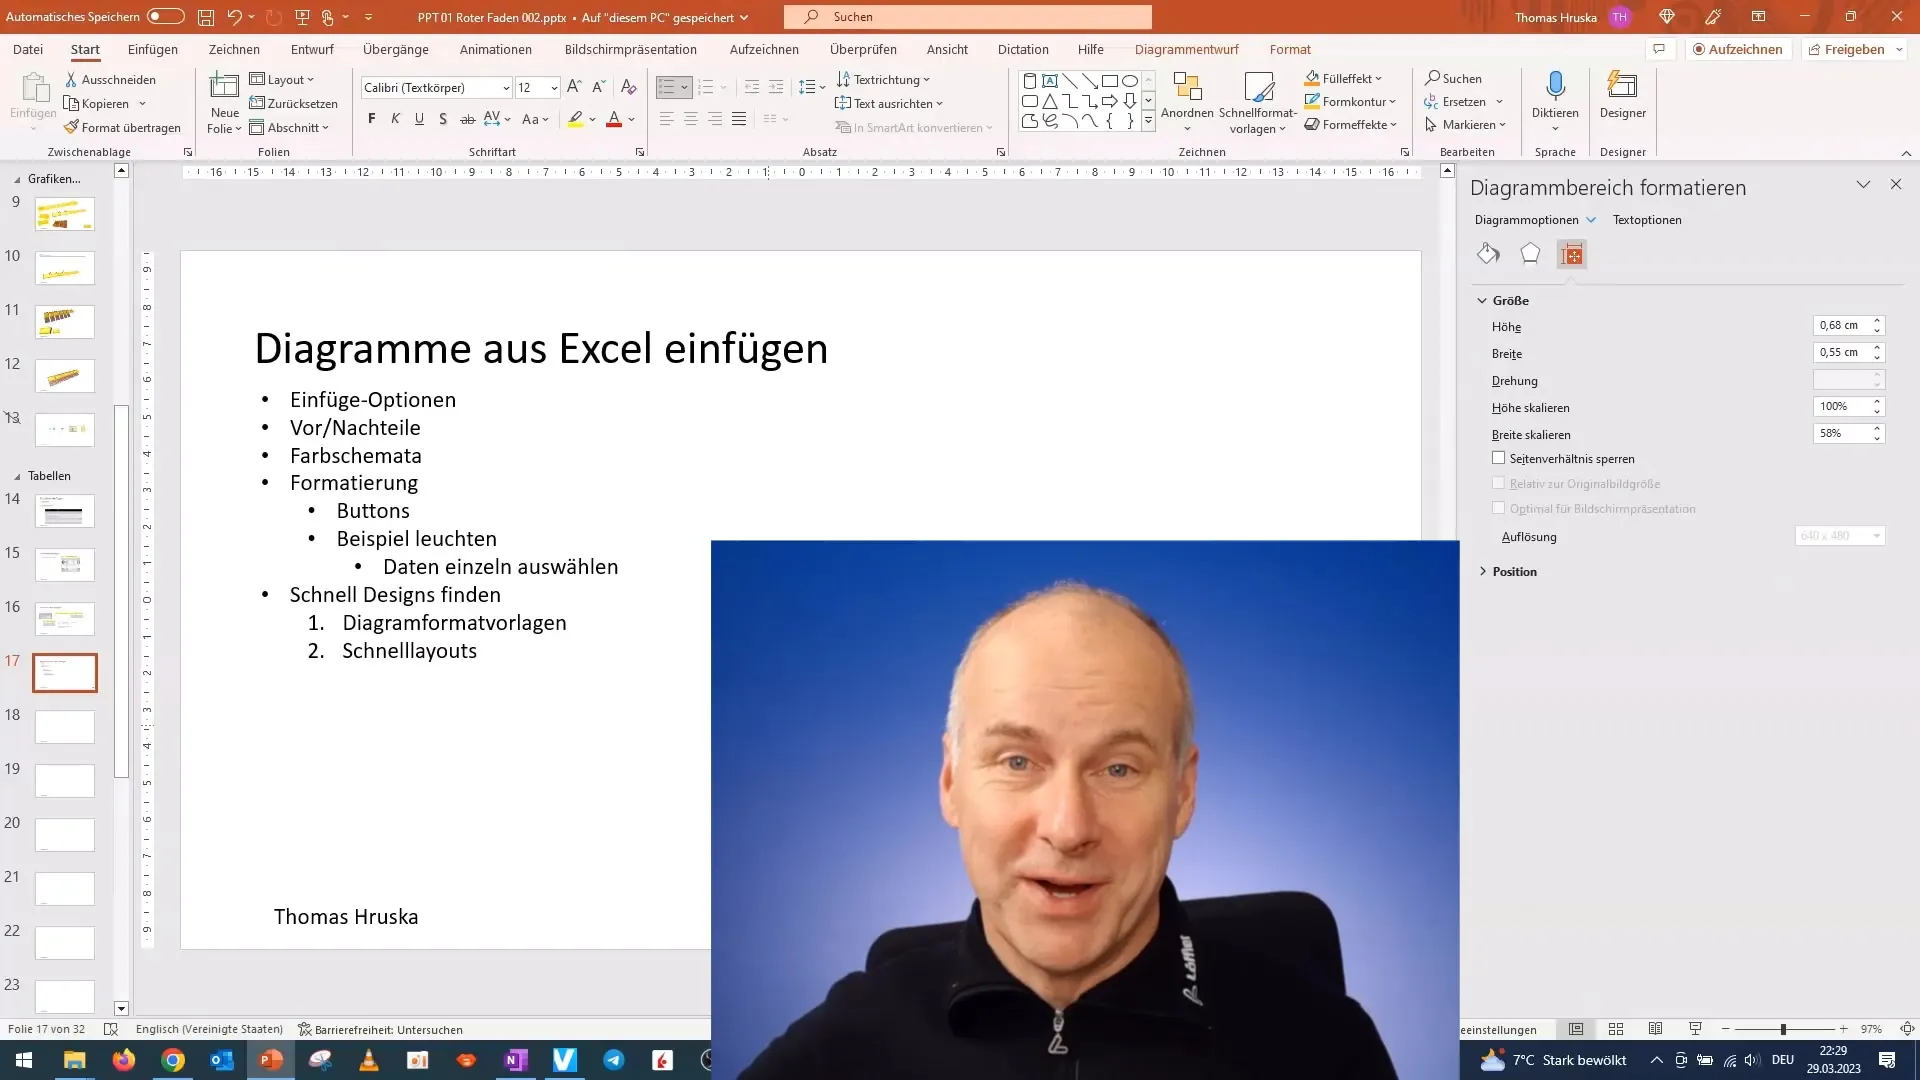
First, open PowerPoint and select your desired diagram. Then, go to the menu for diagram style templates located in the top ribbon. This area allows you to display various design options.
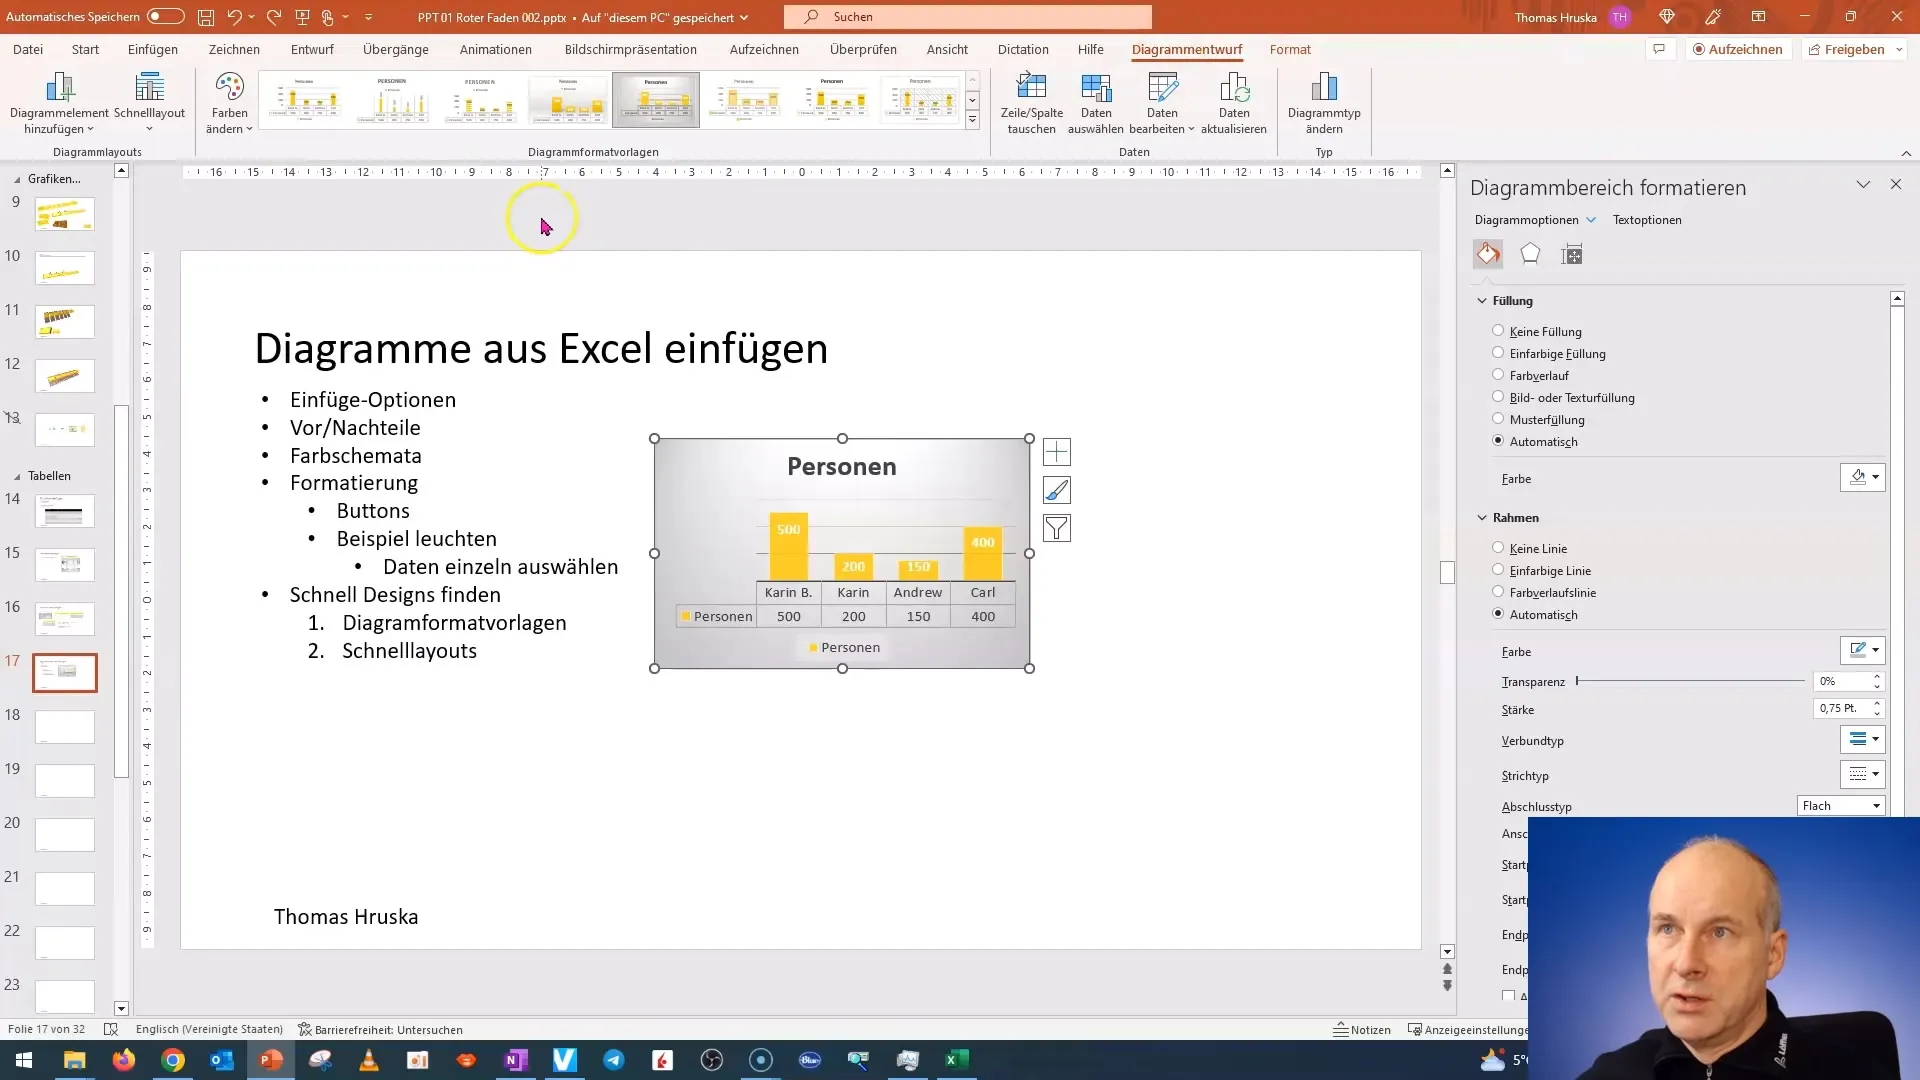
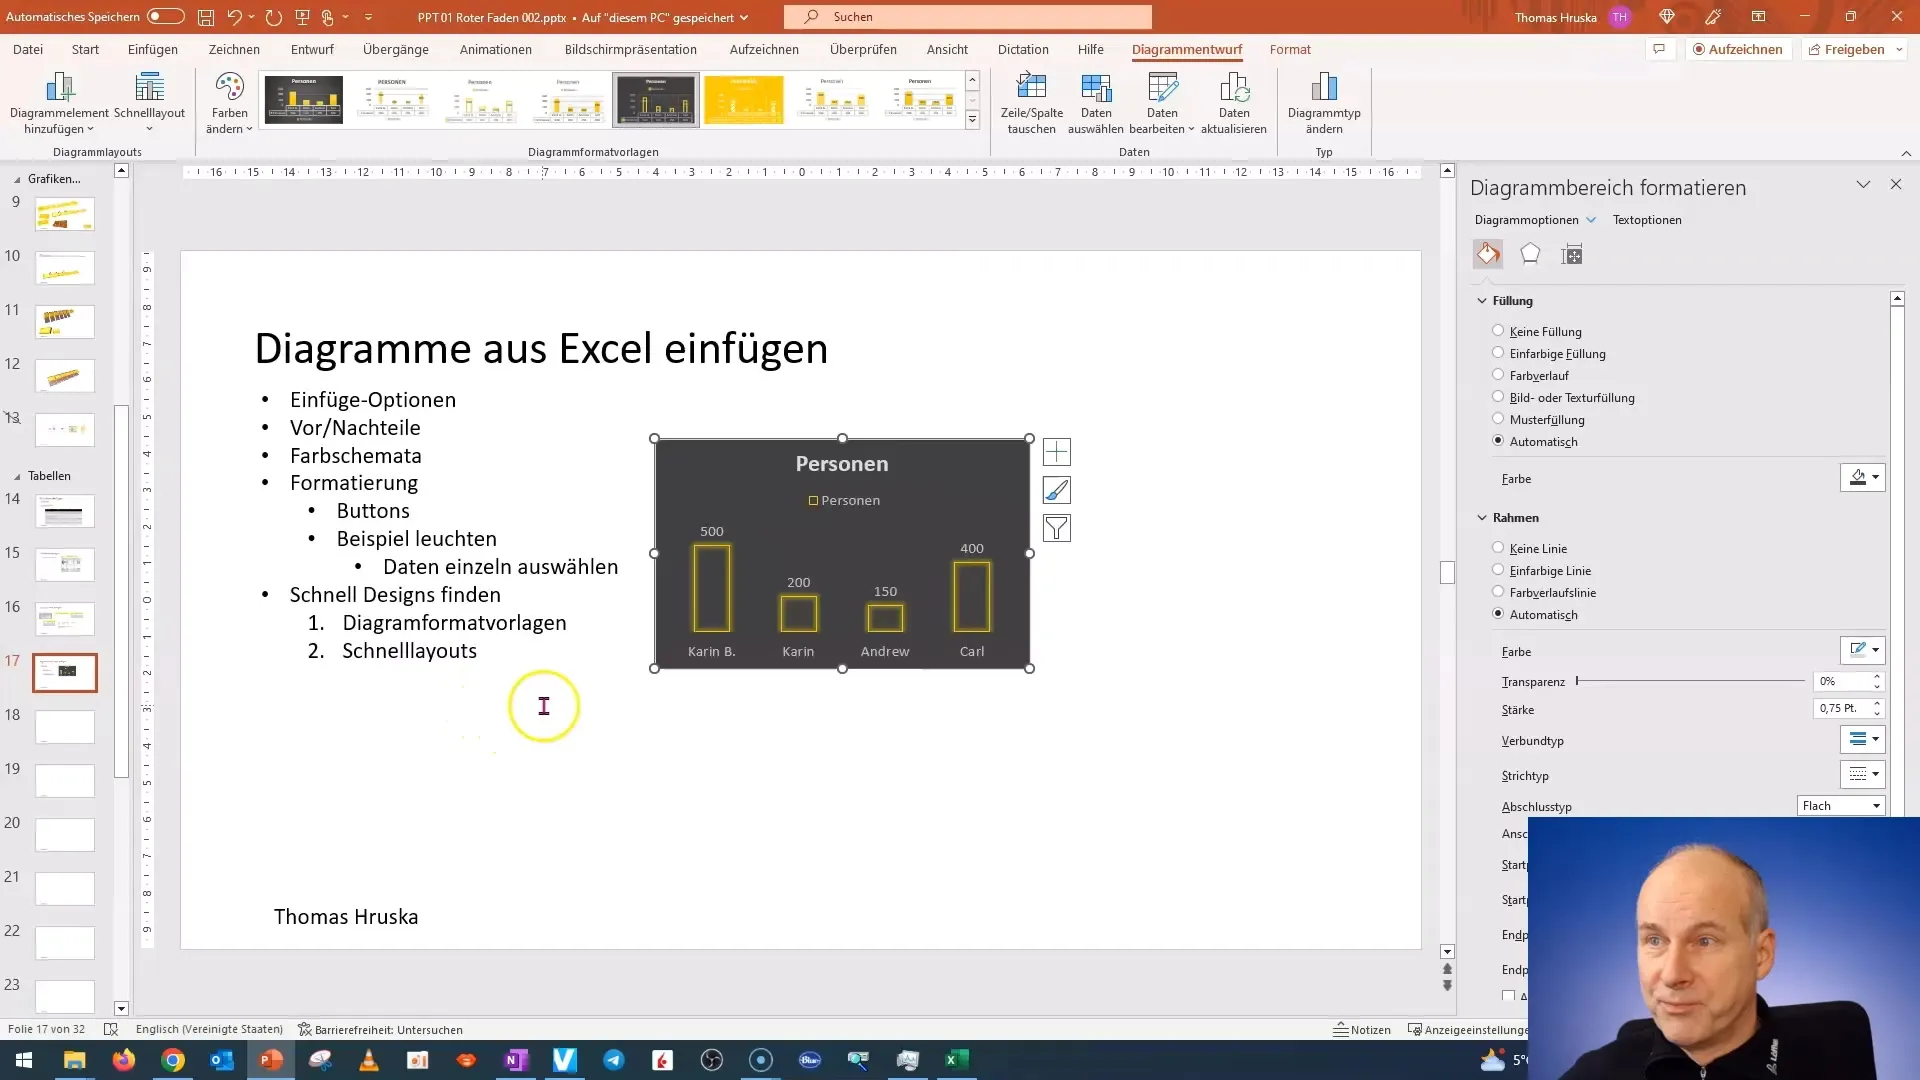
Now, you should see two special menus: one for style and the other for diagram layout. For this tutorial, we will focus on the diagram style templates. Click on it and expand the menu. This will help you quickly explore different styles.
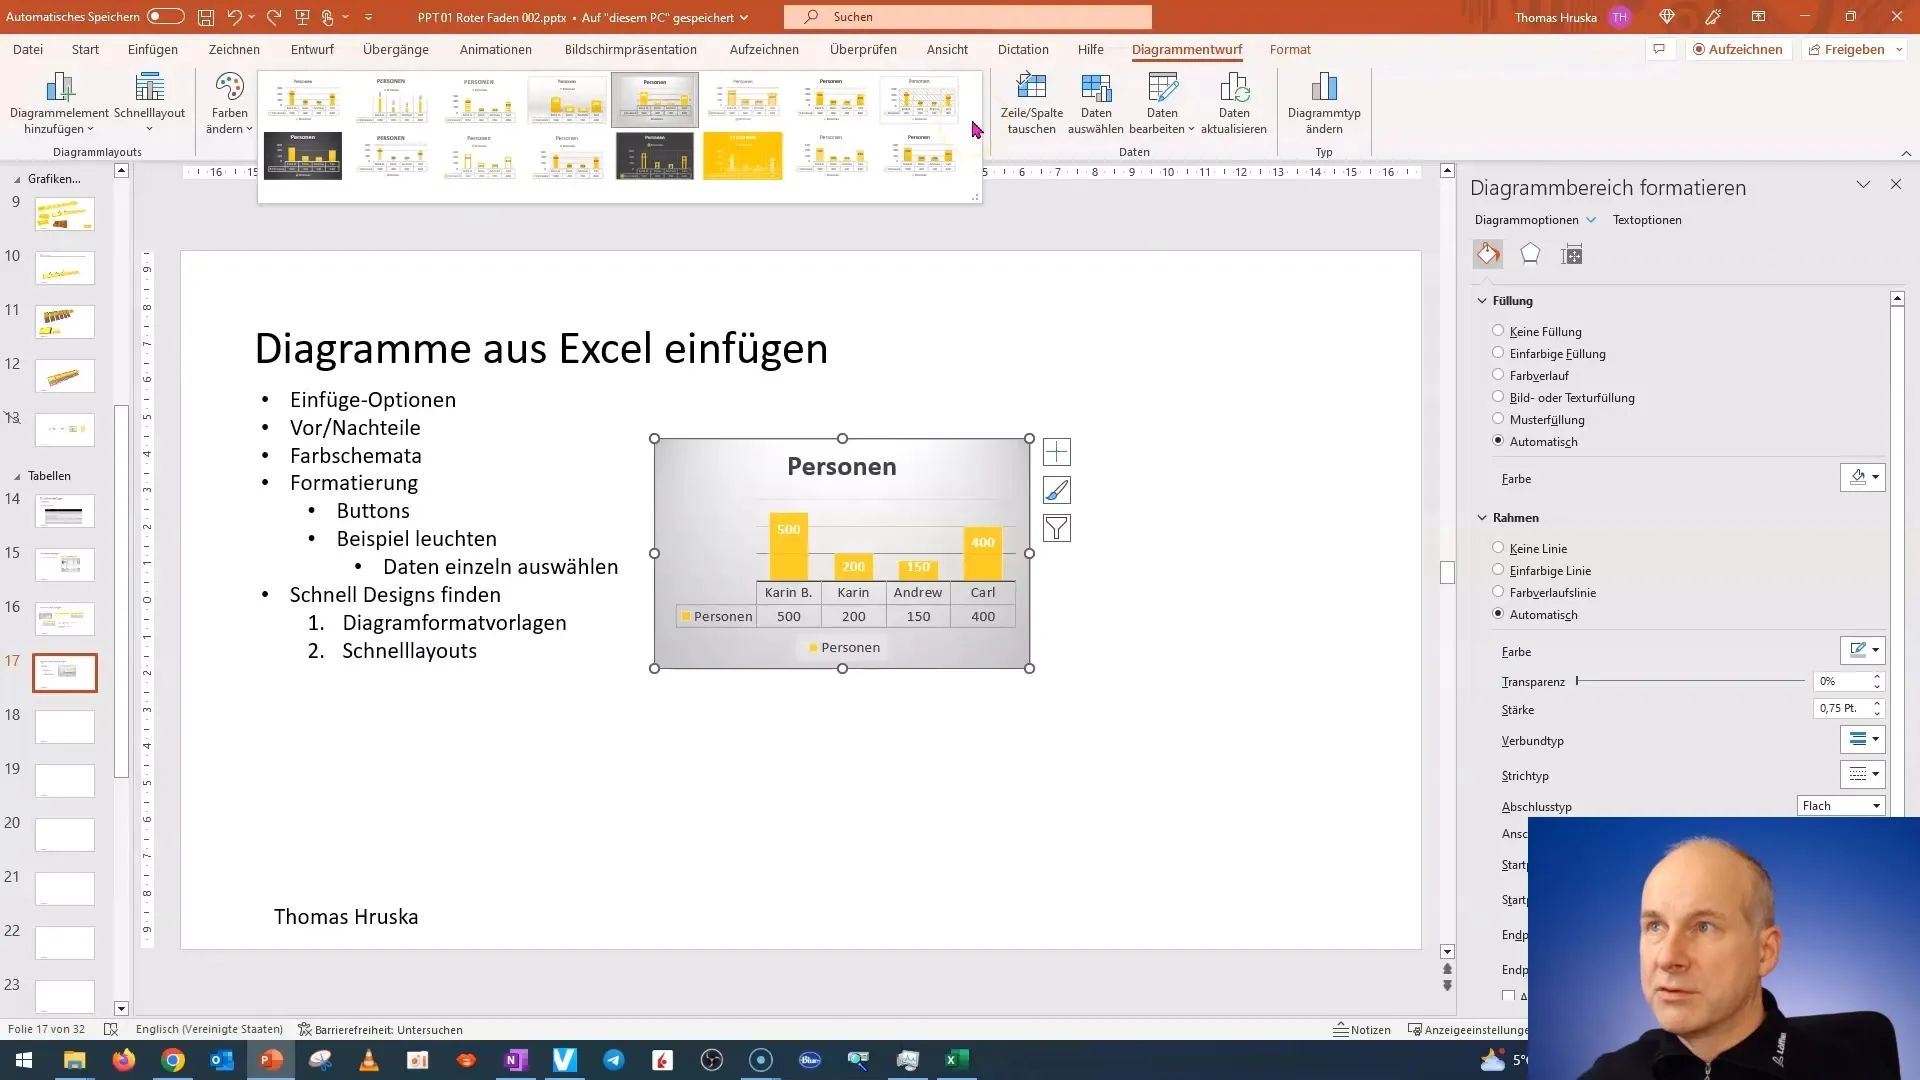
Hover over the diagram style templates to preview the designs. Here you can see how your diagram looks in different formats before making your final decision.
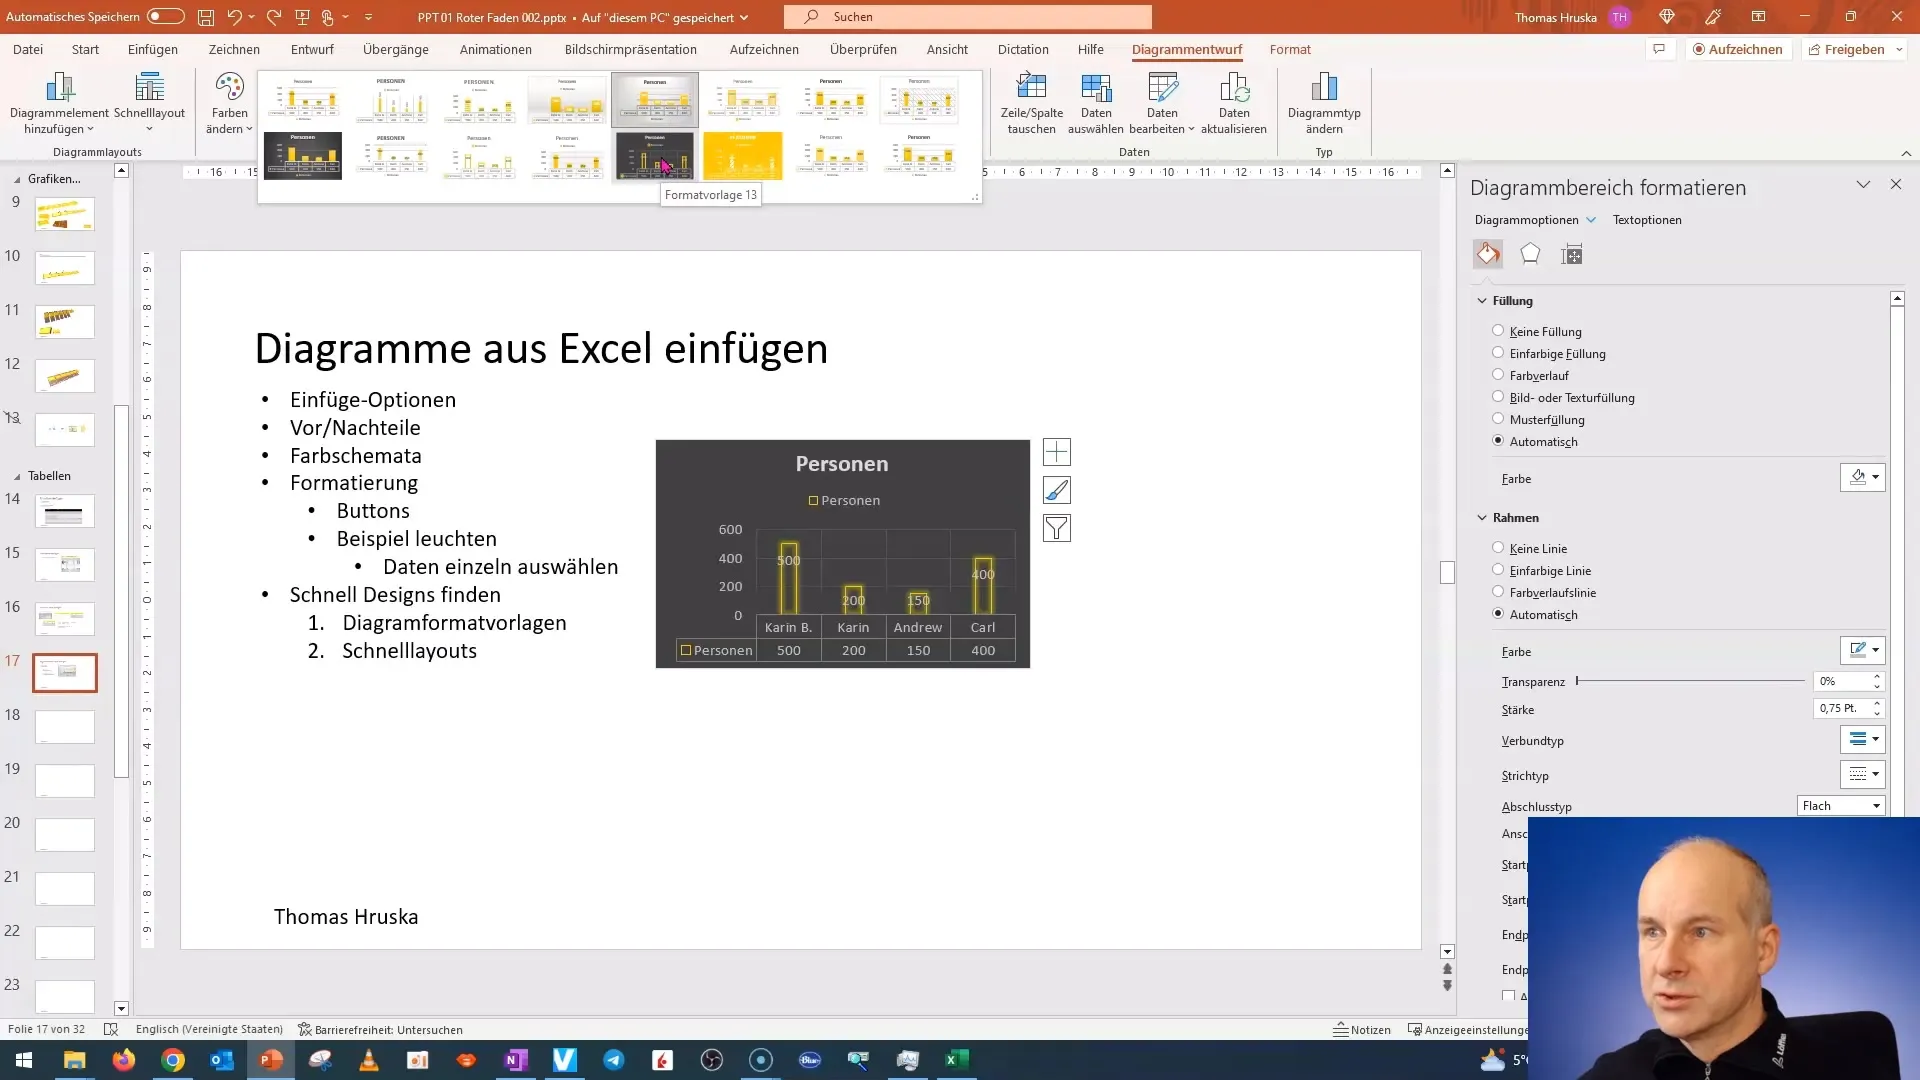
Once you have found a style you like, you can select it. For example, a cool design with yellow columns and a shadow effect can be very appealing. Choose the style that fits your presentation and captures visual interest.
Now, you can customize the data labels in the diagram. If you don't like the default data labeling, you have the option to remove or edit it, which can help make your diagram clearer and more legible.
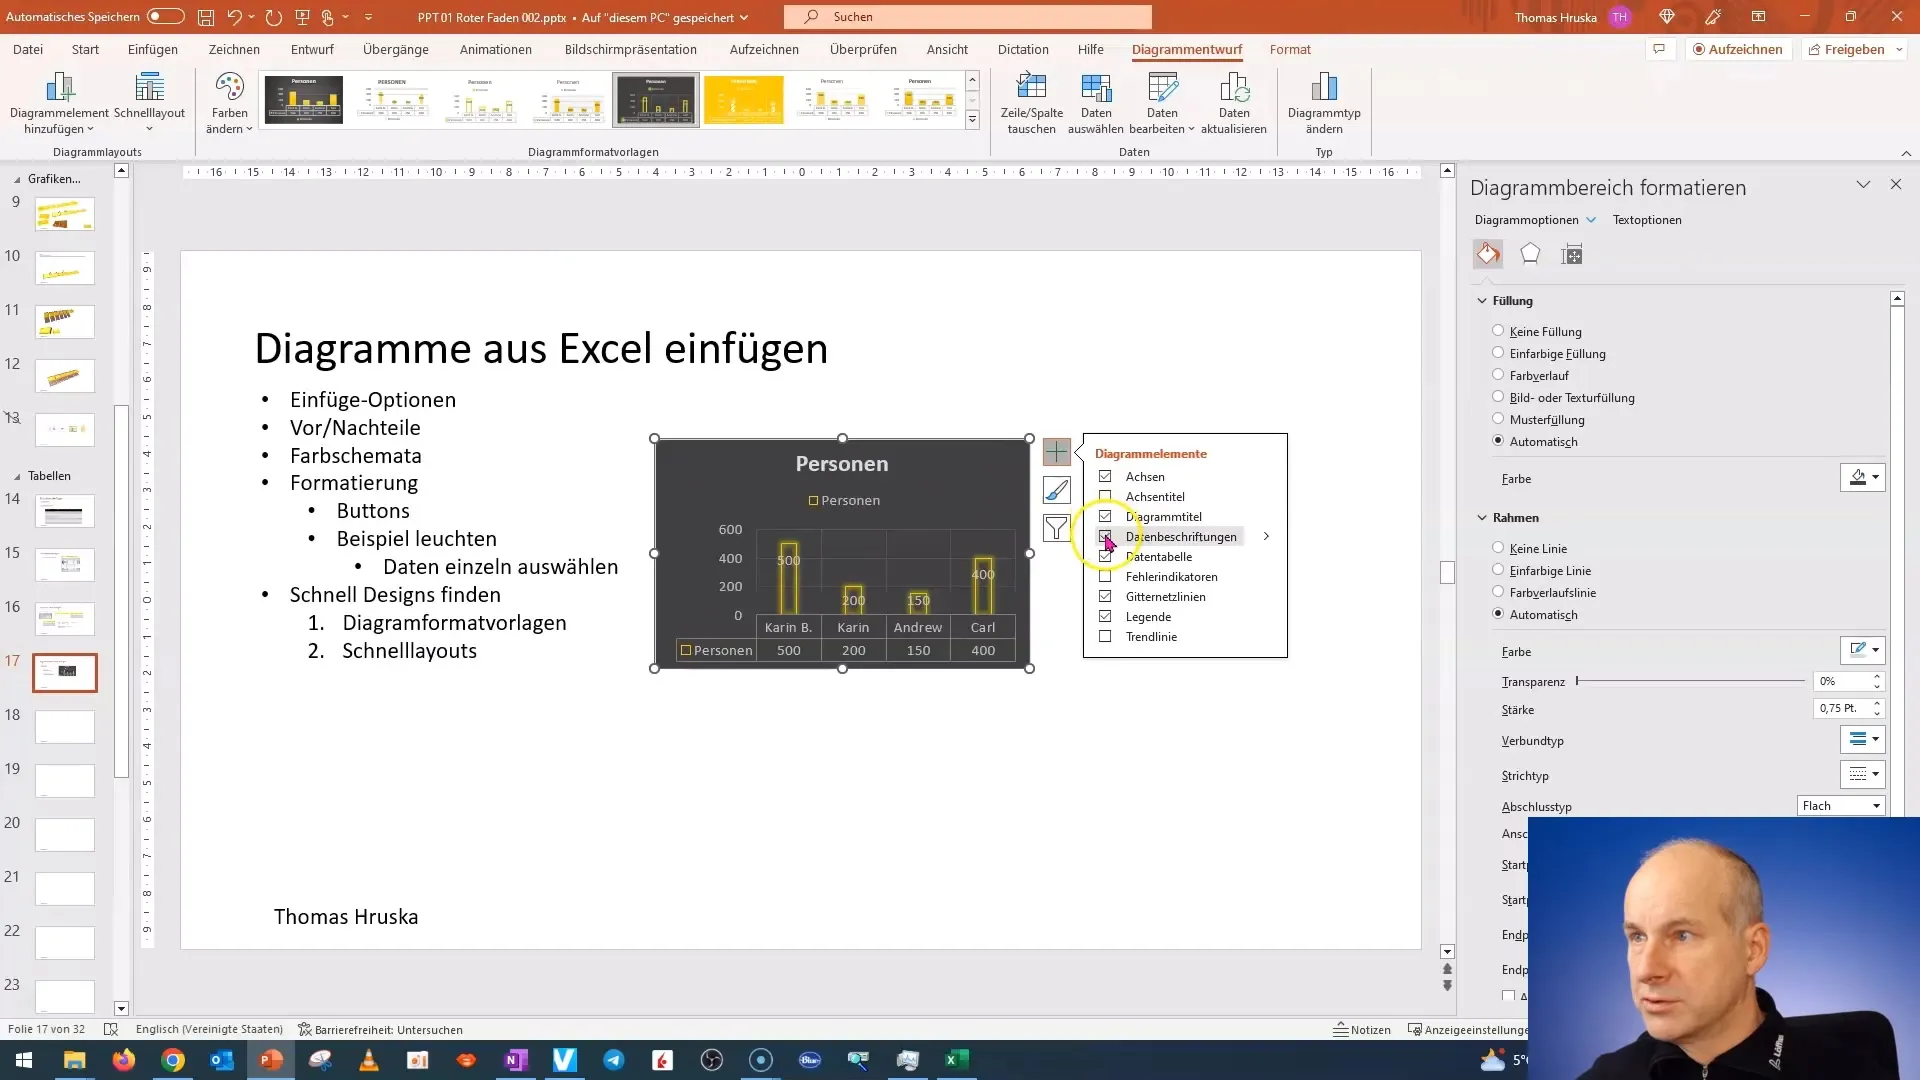
After adjusting the data labels, there is a second way to modify the design. When you select the diagram, you will see another subcategory for additional design options offering various executions of the chosen style.
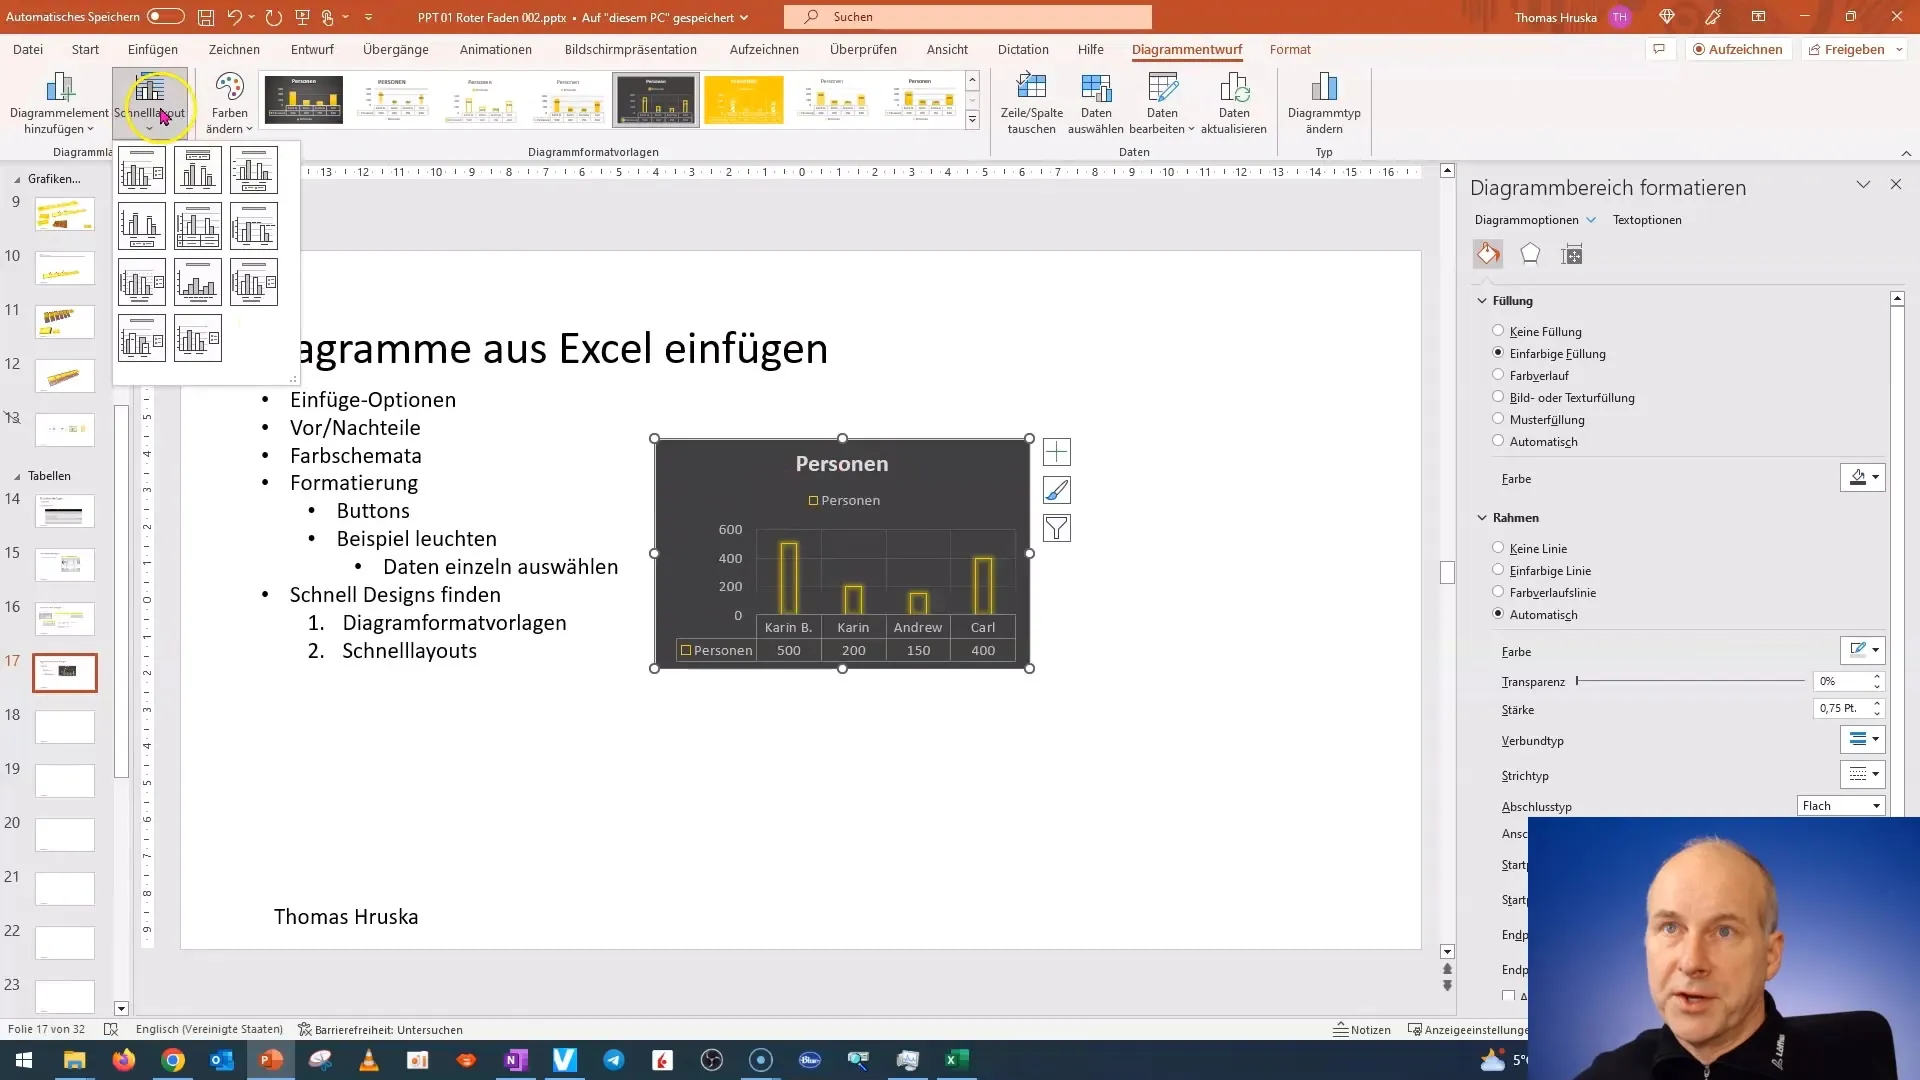
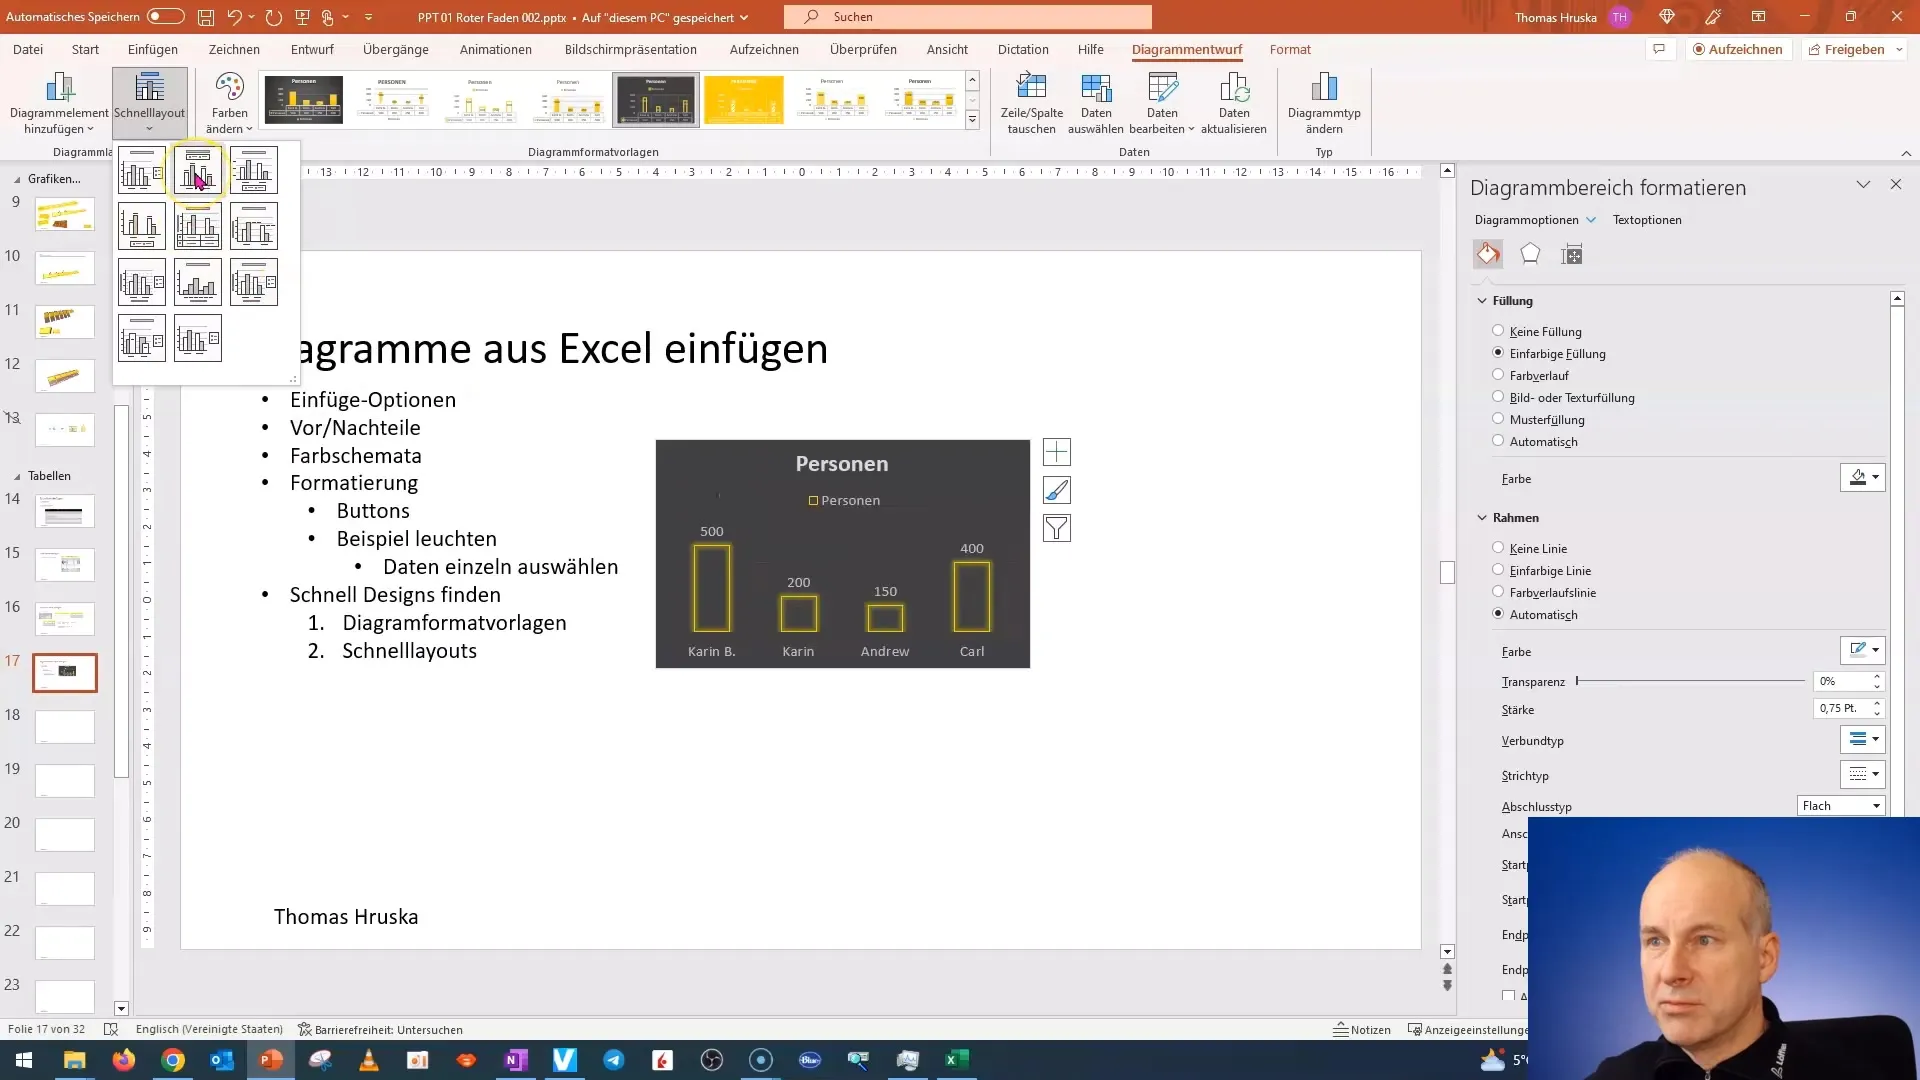
With these options, you can quickly and easily find the ideal design. Ensure it matches the information you intend to present. Use the assistance of these style templates to visually enhance your diagrams.
It's a good idea to brainstorm examples before starting to create your diagram. You can create a small table in Excel with sample data. This approach will make it easier for you to fill and visualize the diagram, develop spontaneous ideas, and test your results later.
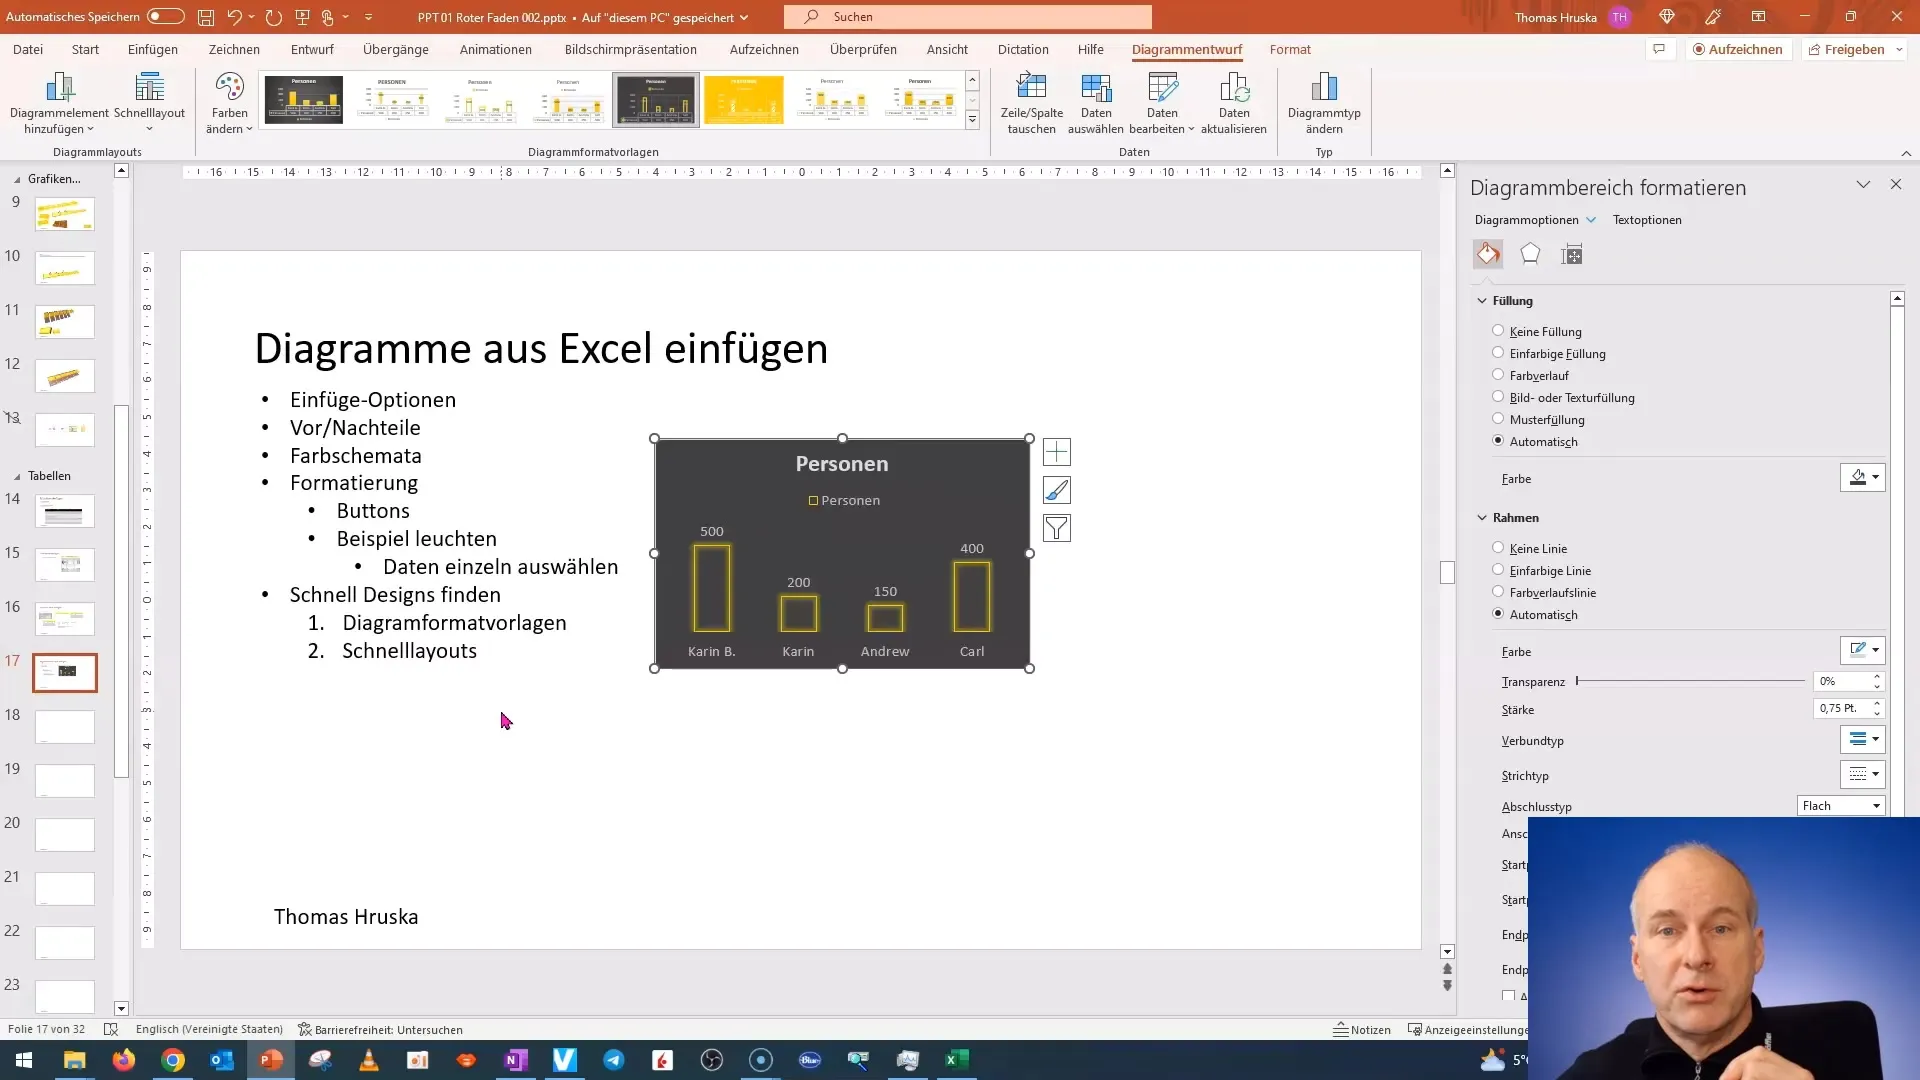
This way, you'll get a sense of how the different designs interact with your data. Experiment with various types of diagrams and find the layout that meets your requirements. In future videos, we will explore how to create diagrams in PowerPoint and delve even deeper into the details.
I look forward to seeing you again in the next tutorials and hope that you enjoy experimenting and designing the charts!
Summary
In this tutorial, you learned how to quickly and easily design charts in PowerPoint. By using the built-in layout and quick style options, you can create visually appealing charts and customize them to fit your content needs.
Frequently Asked Questions
How do I find the chart layout templates in PowerPoint?You can find the chart layout templates in the top ribbon under the chart options.
Can I customize the data labels?Yes, you can customize, remove, or add new data labels to bring more clarity.
How do I import data into a chart?You can import data into PowerPoint by first creating an Excel file and entering the data there before inserting the chart.


