In this tutorial, we will show you how to create a creative and interactive dashboard in PowerPoint. The goal is to present your business plan in an appealing and innovative way, so that your audience gains a lasting impression. Whether you want to buy, take over, or renovate a coffee house, we will teach you how to present everything on a single slide. Let's start with the step-by-step guide.
Main TakeawaysYou will learn how to:
- Use an appealing background image
- Effectively utilize icons and graphics
- Make your presentation interactive
- Incorporate details such as revenue plan and strategic partnerships effectively
Step-by-Step Guide
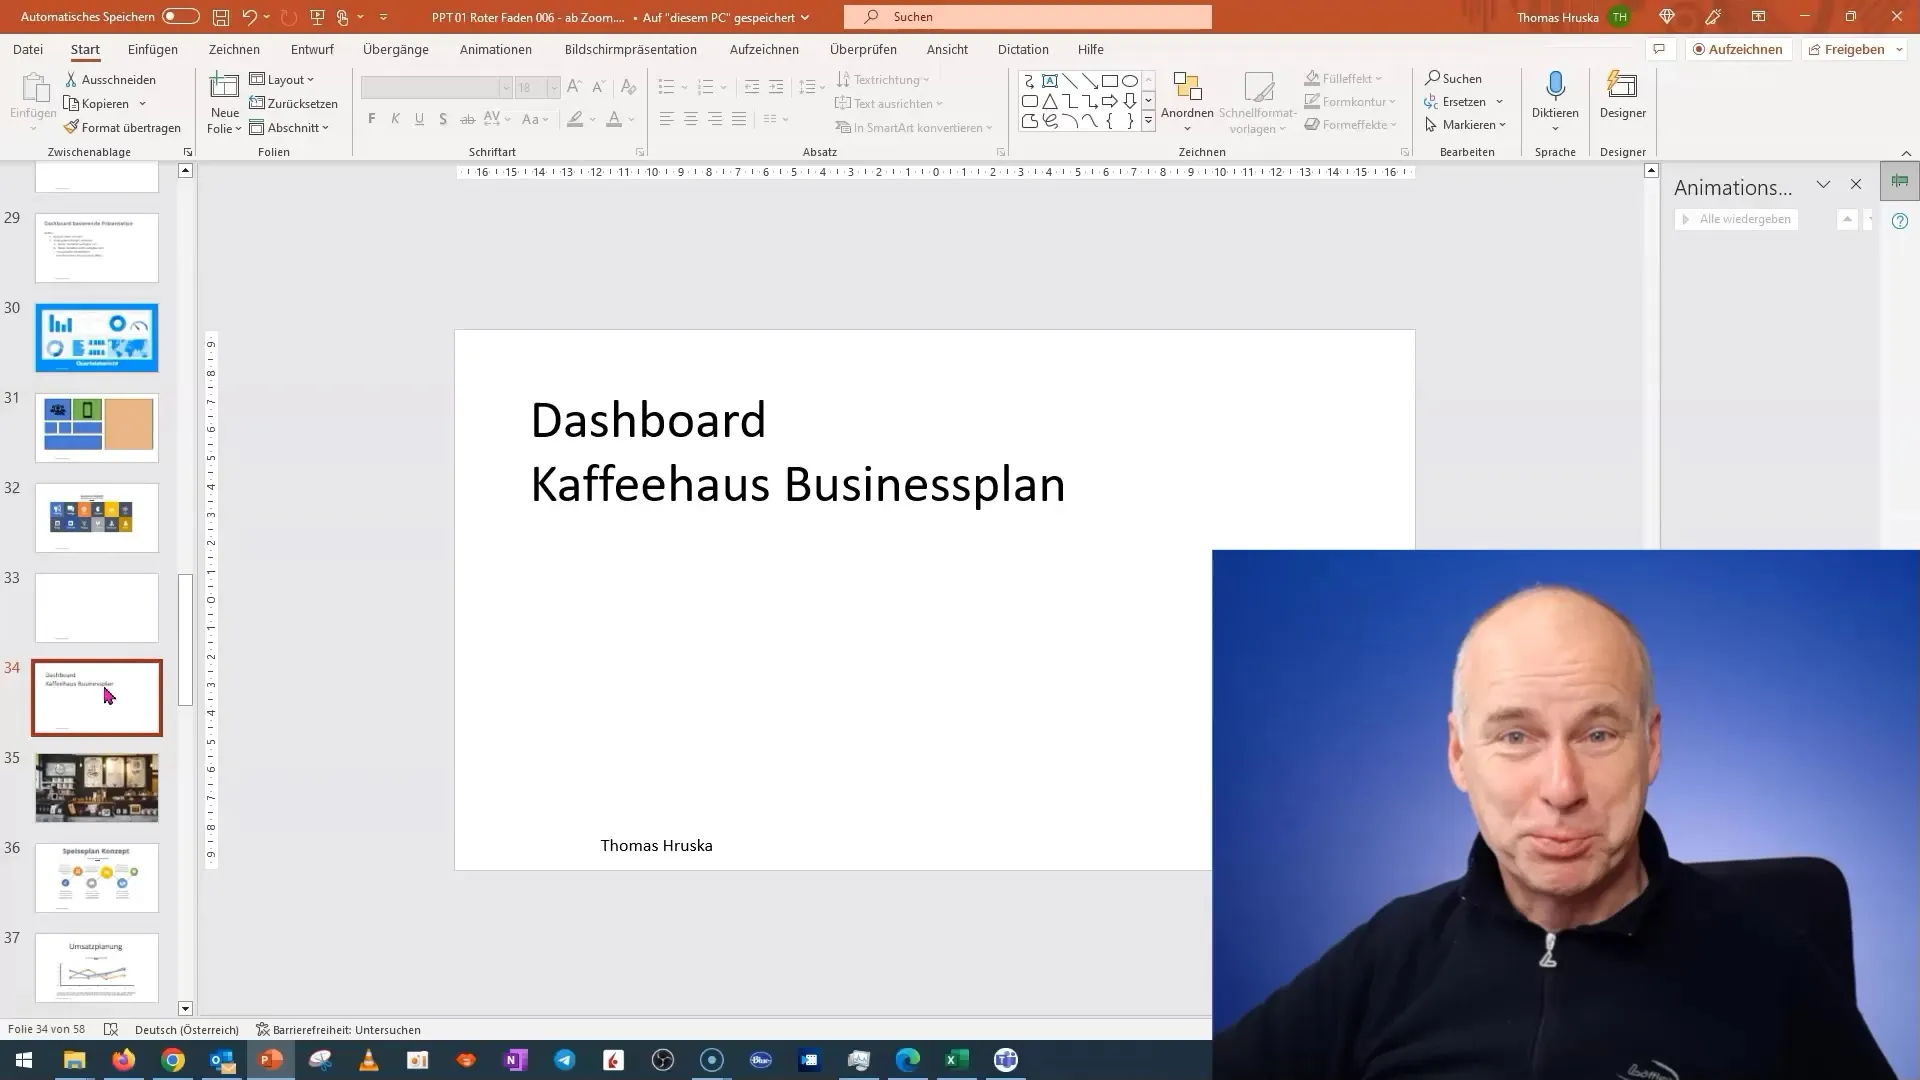
First, let's start with a blank slide. Open PowerPoint and select a new slide. Here, you can use an appealing image as a background to convey the atmosphere.
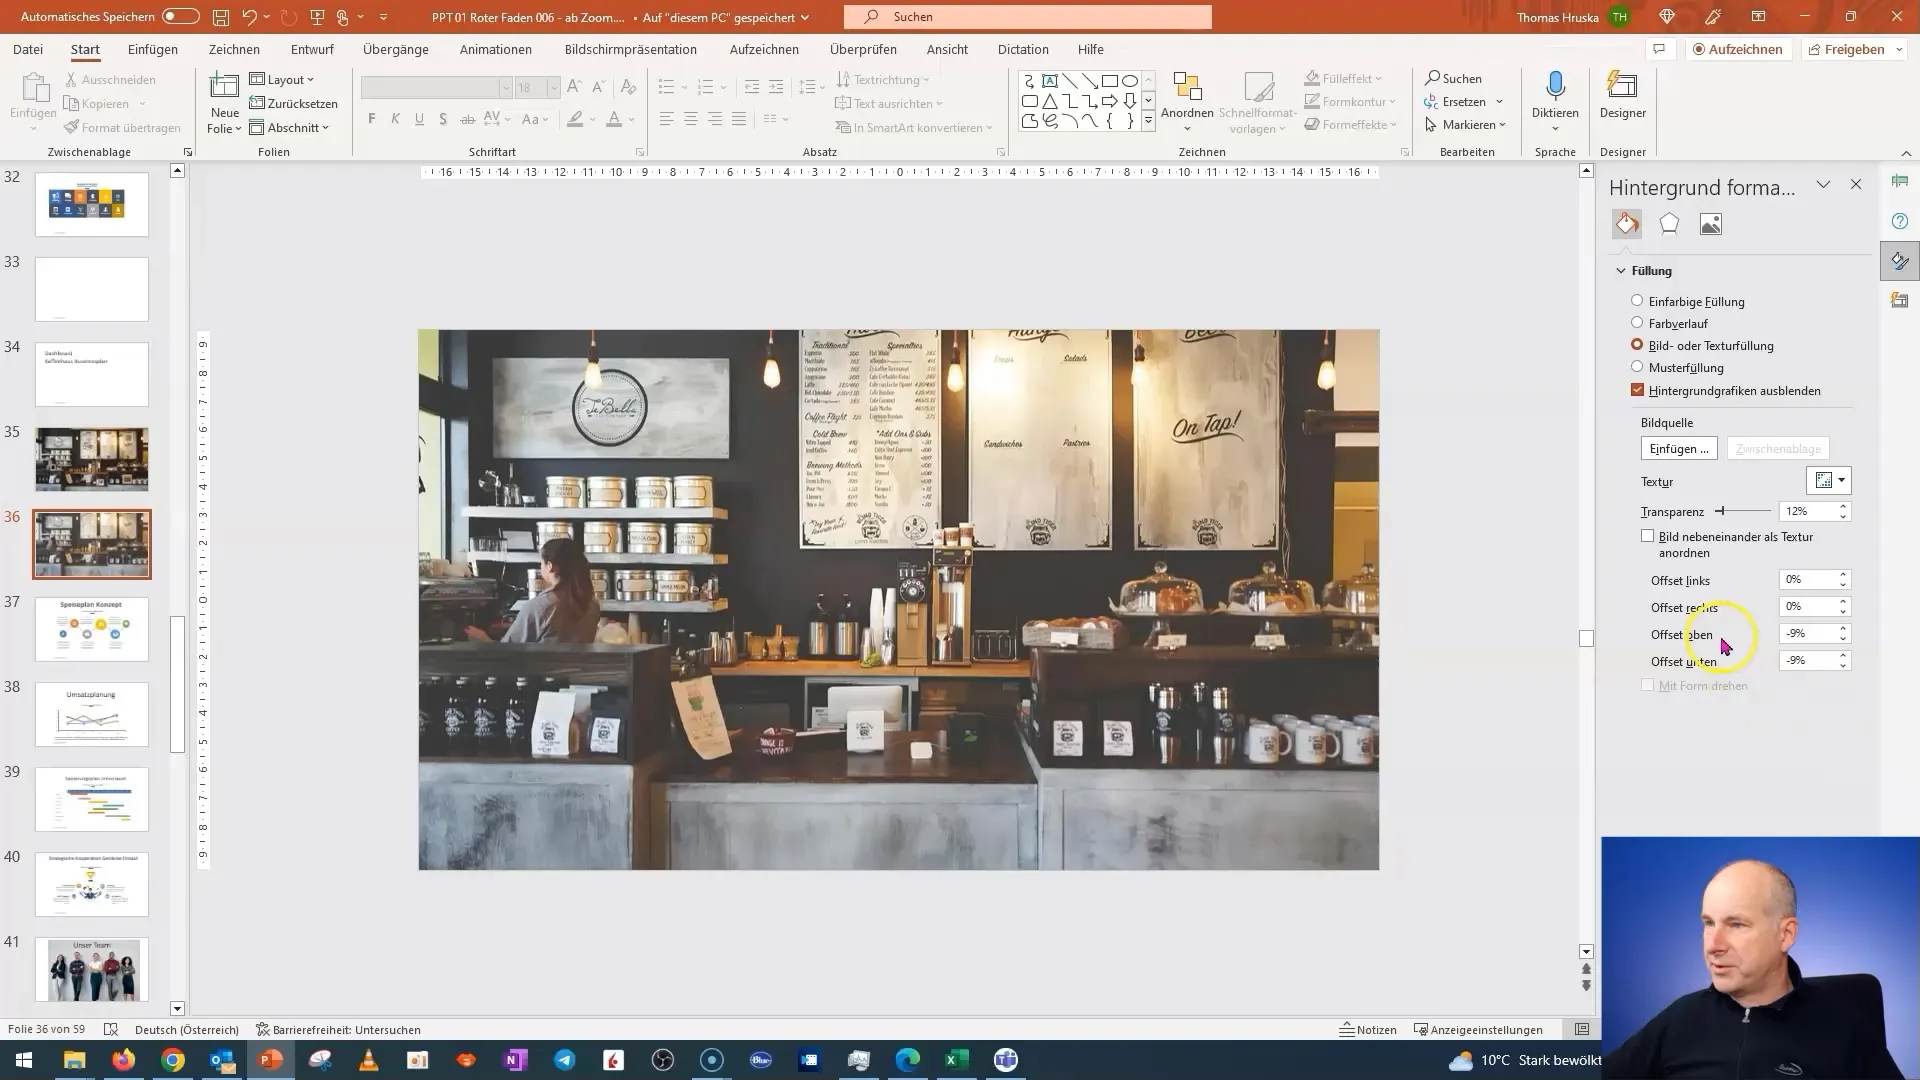
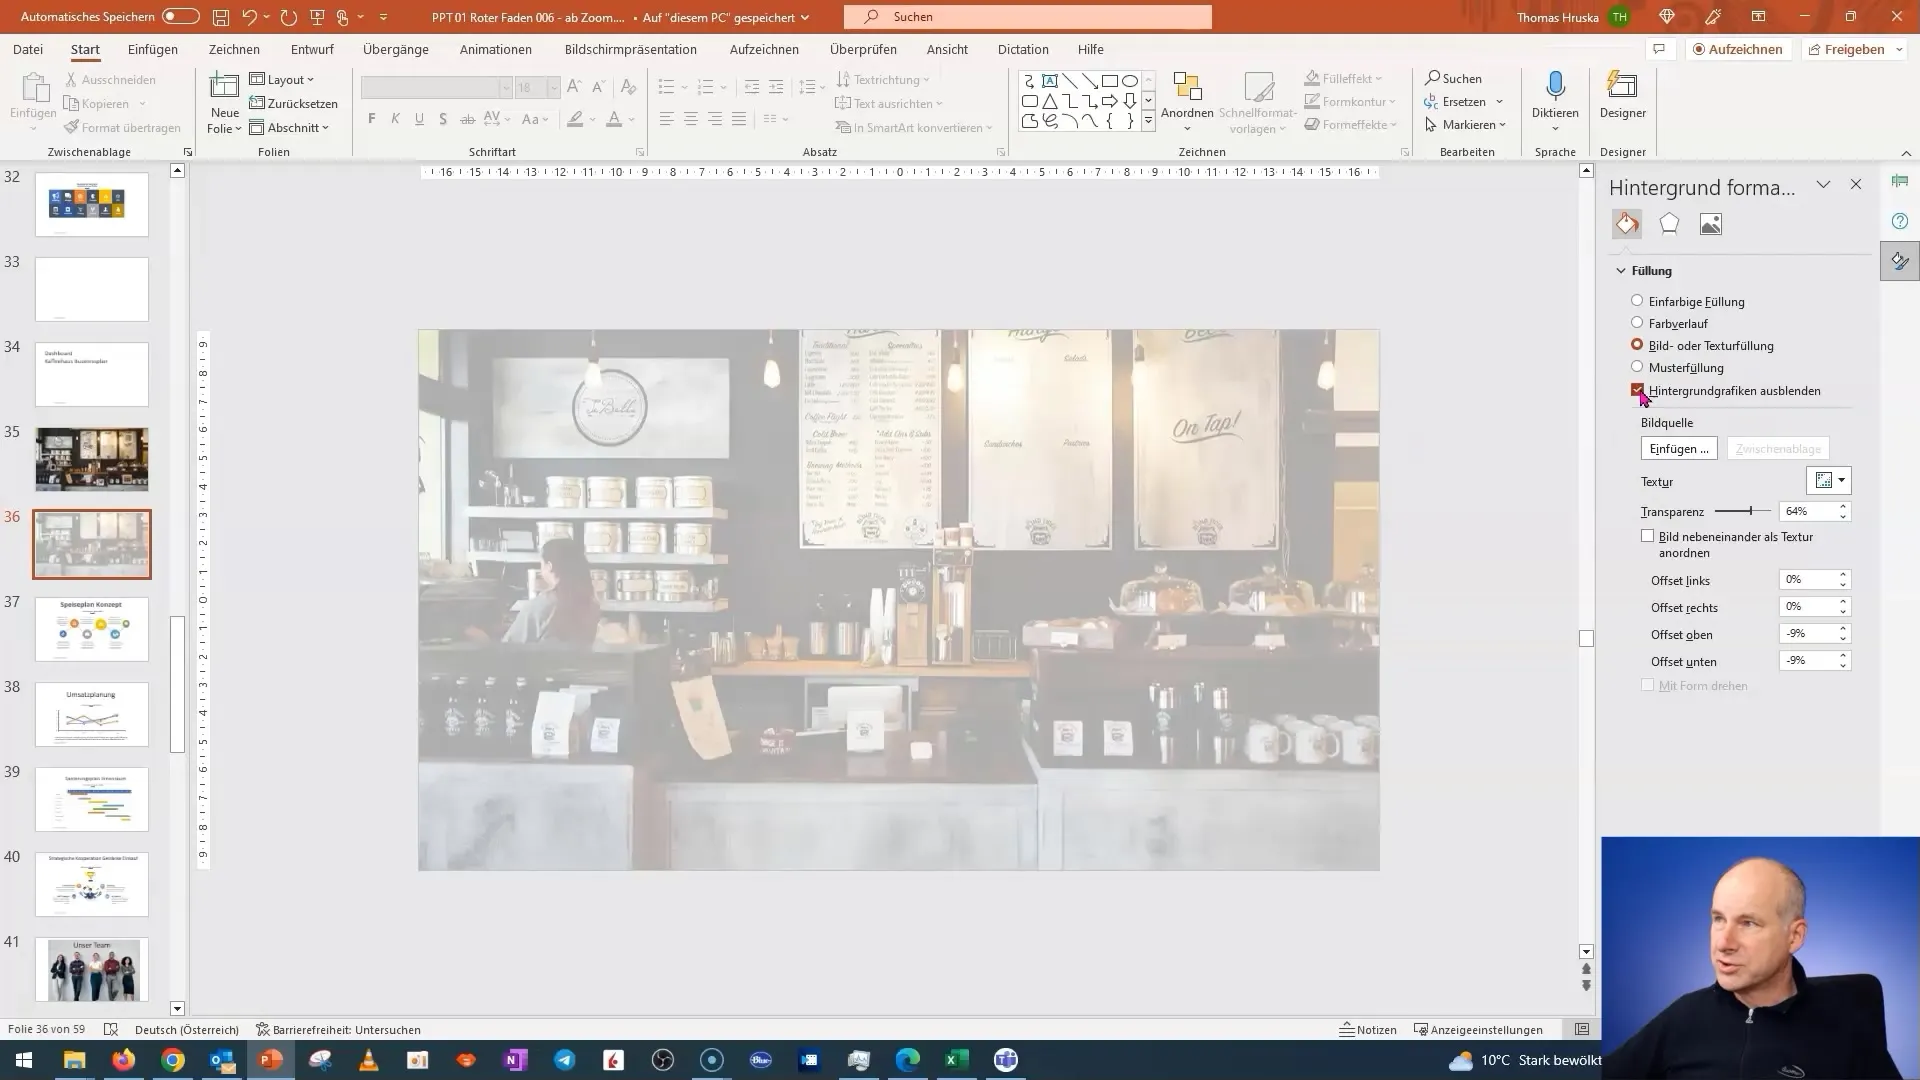
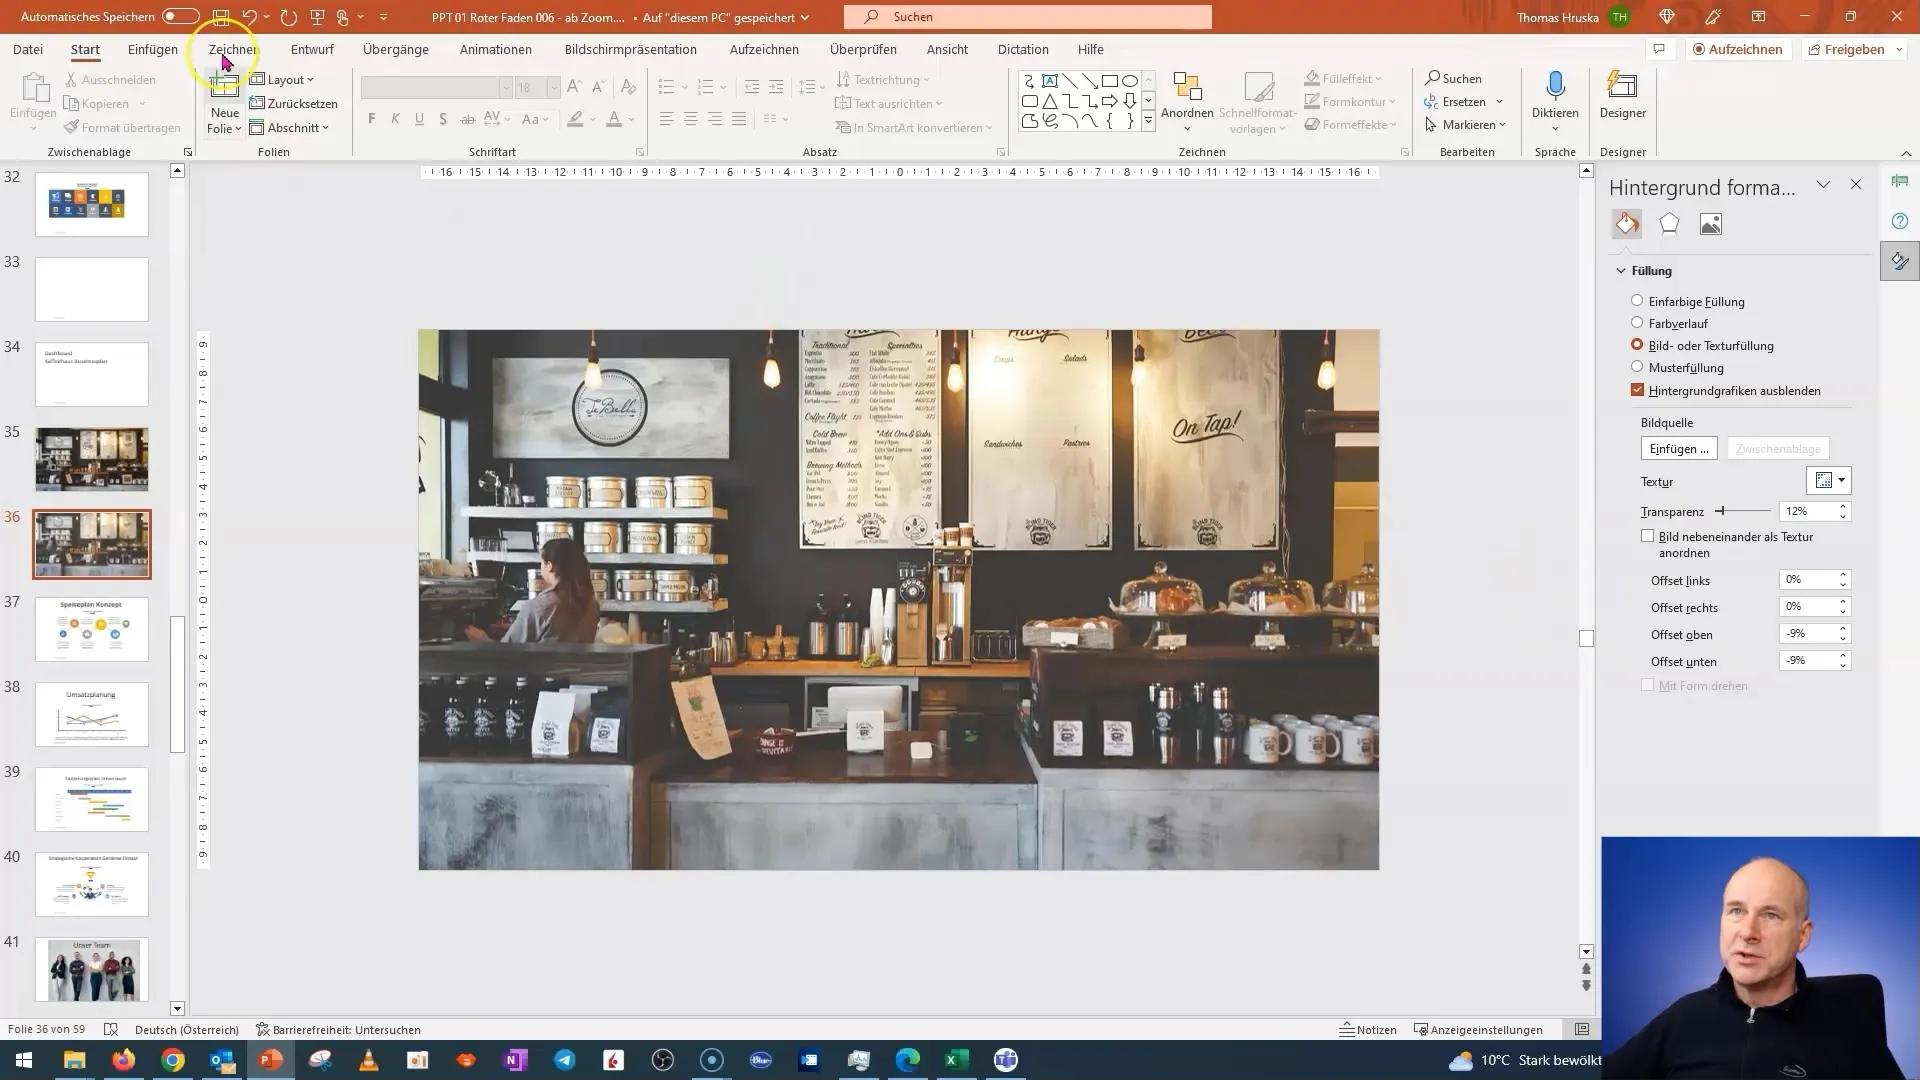
Next, insert the image of your coffee house. It is important to insert this image as a background image. Right-click on the slide and select "Format Background." Here, you can choose the image saved in your local folder.
Once you have inserted the image, ensure that the transparency setting is appropriate. Often the images are pre-set with a transparency that you may not desire. To achieve a solid image, reset the transparency so that your background remains clearly visible.
Now, it's about inserting the name of the coffee house. You can initially hide this to avoid distraction. This way, you have the opportunity to focus more on the content you want to present.
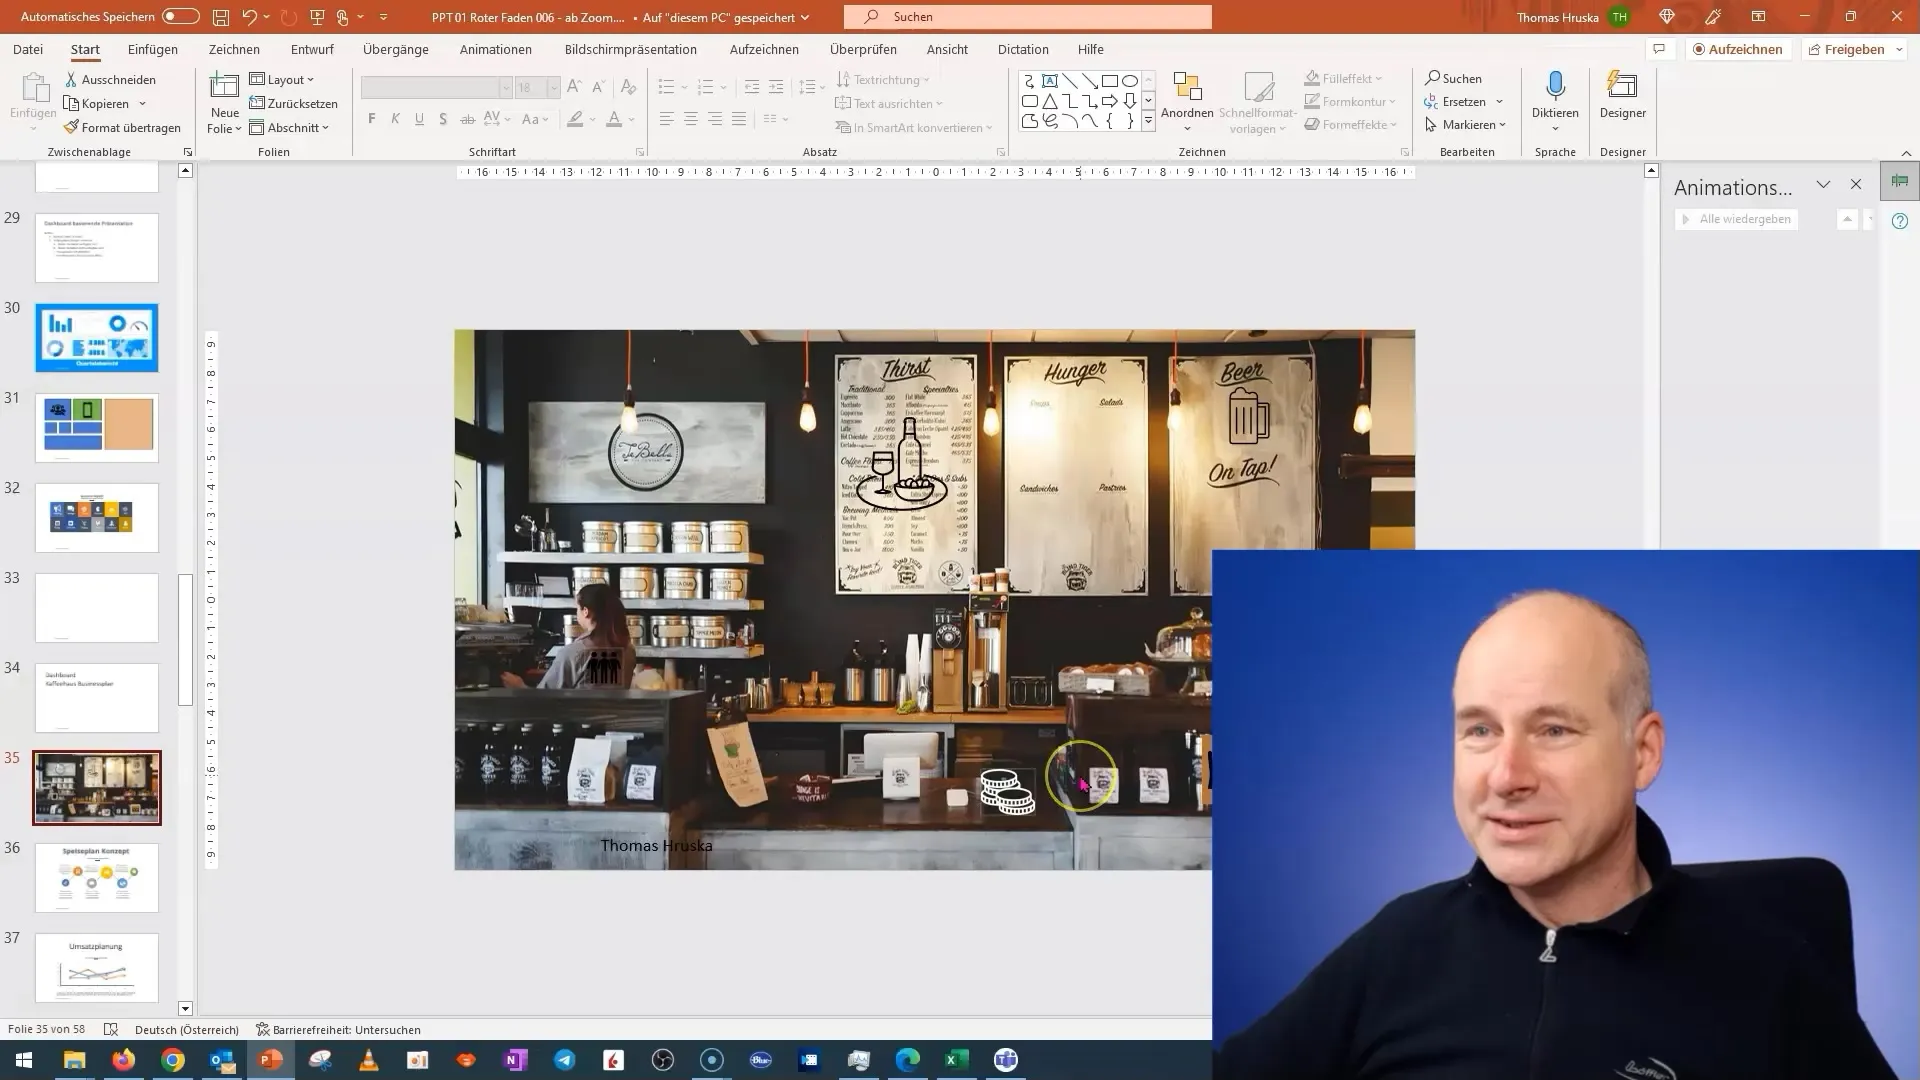
Next, we add our menu boards. Instead of listing them only as text, consider representing them in the form of icons. You can search for suitable graphics that represent the theme of food. These icons should be transparent to blend well into the overall image.
Next, we change the image to insert a figure symbolizing an important element of your revenue plan. Here again, it is recommended to use an icon that stands out uniquely rather than conforming to the typical currency design.
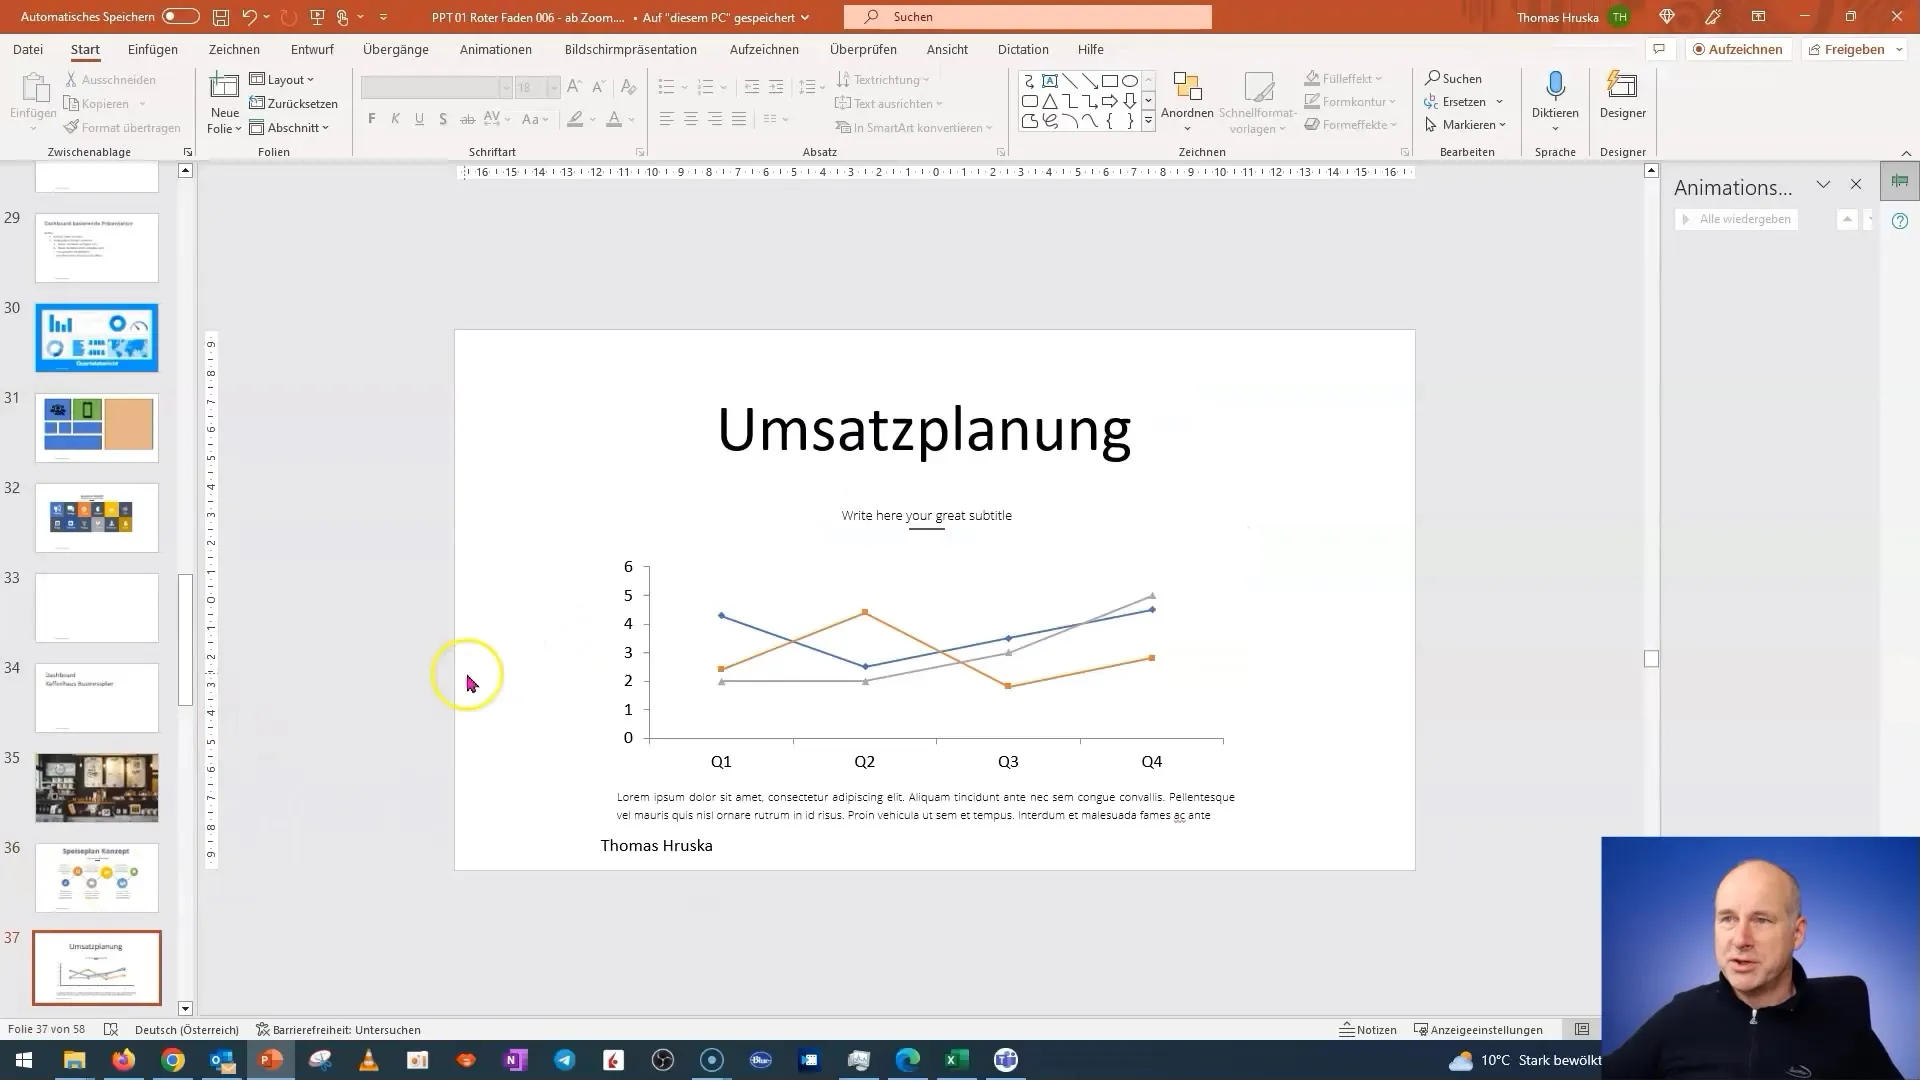
To make the coins visible, we will color them. This is a simple but effective method to draw attention to the revenue plan. One simple trick to edit graphics in PowerPoint is to convert them into vector graphics.
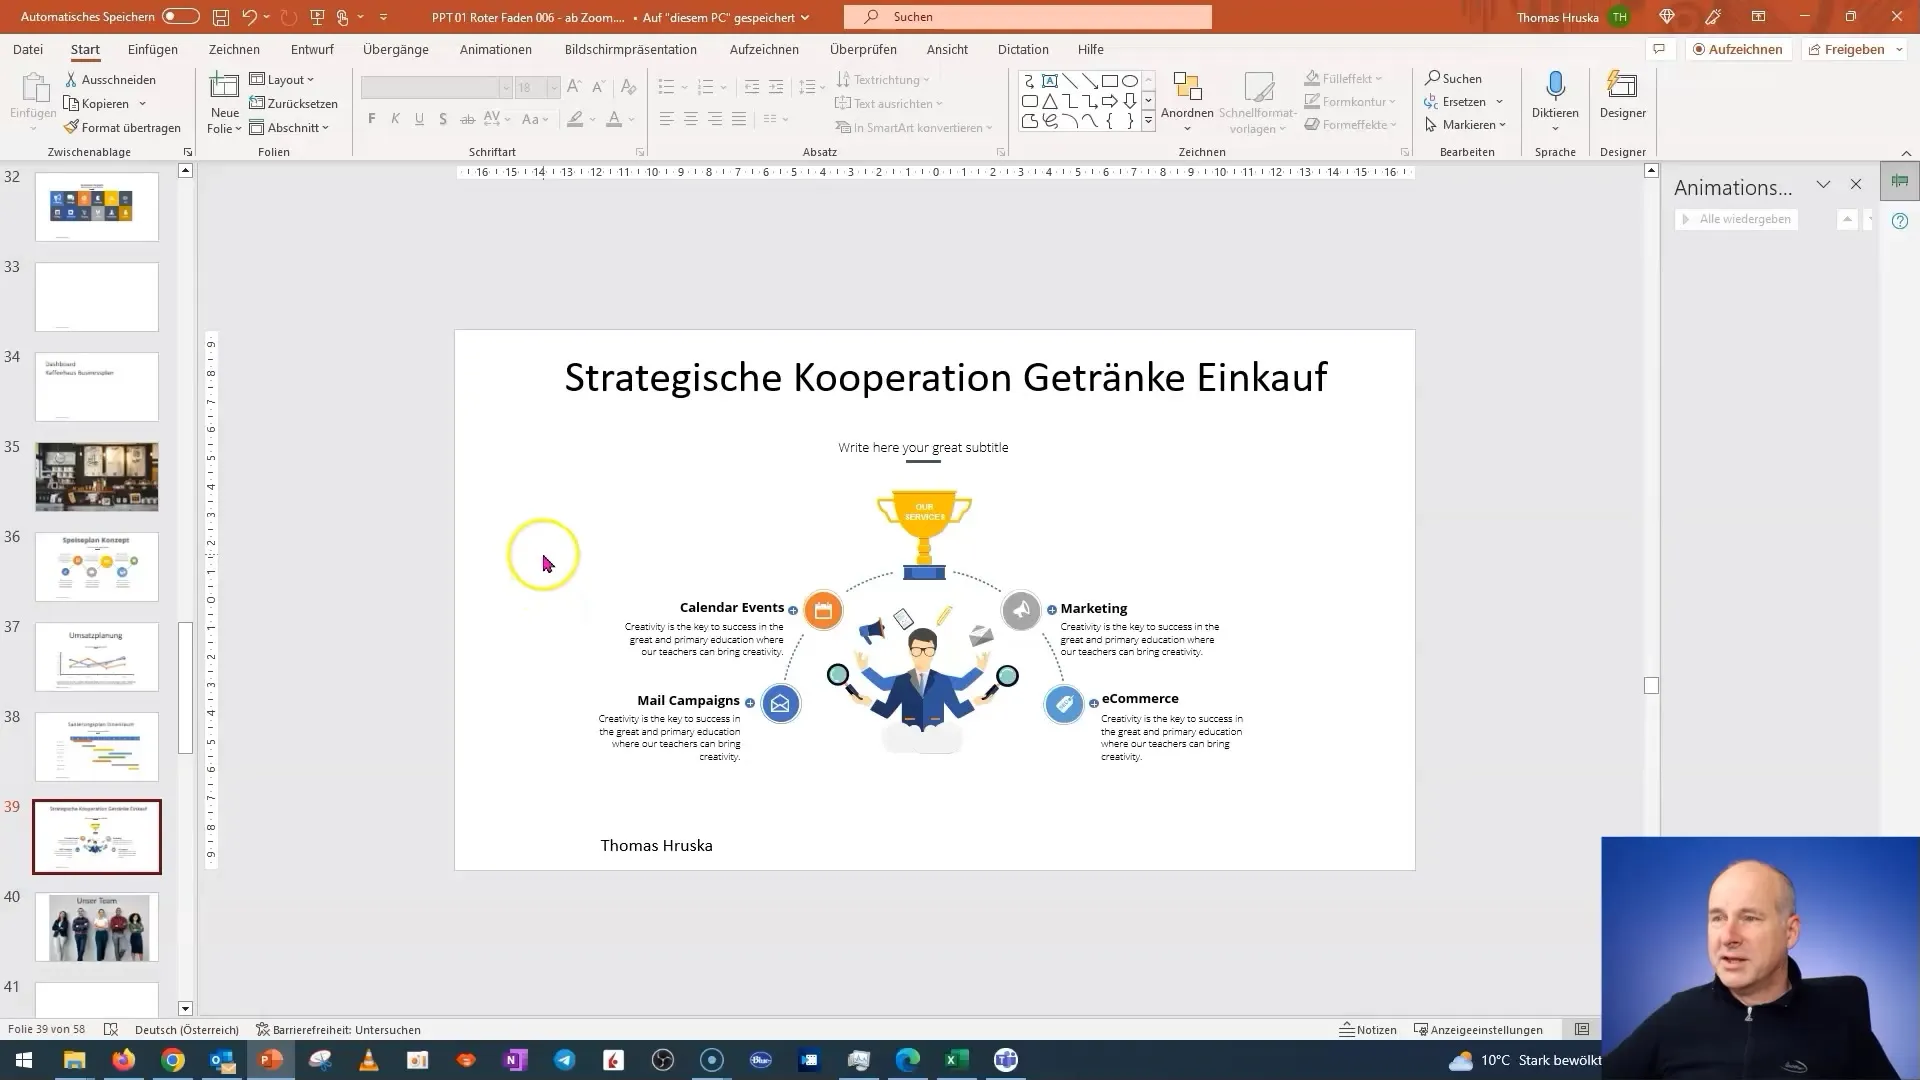
After adjusting the color and design, ensure that the coins appear in the correct areas. These should be placed securely and clearly so that your audience immediately understands the context.
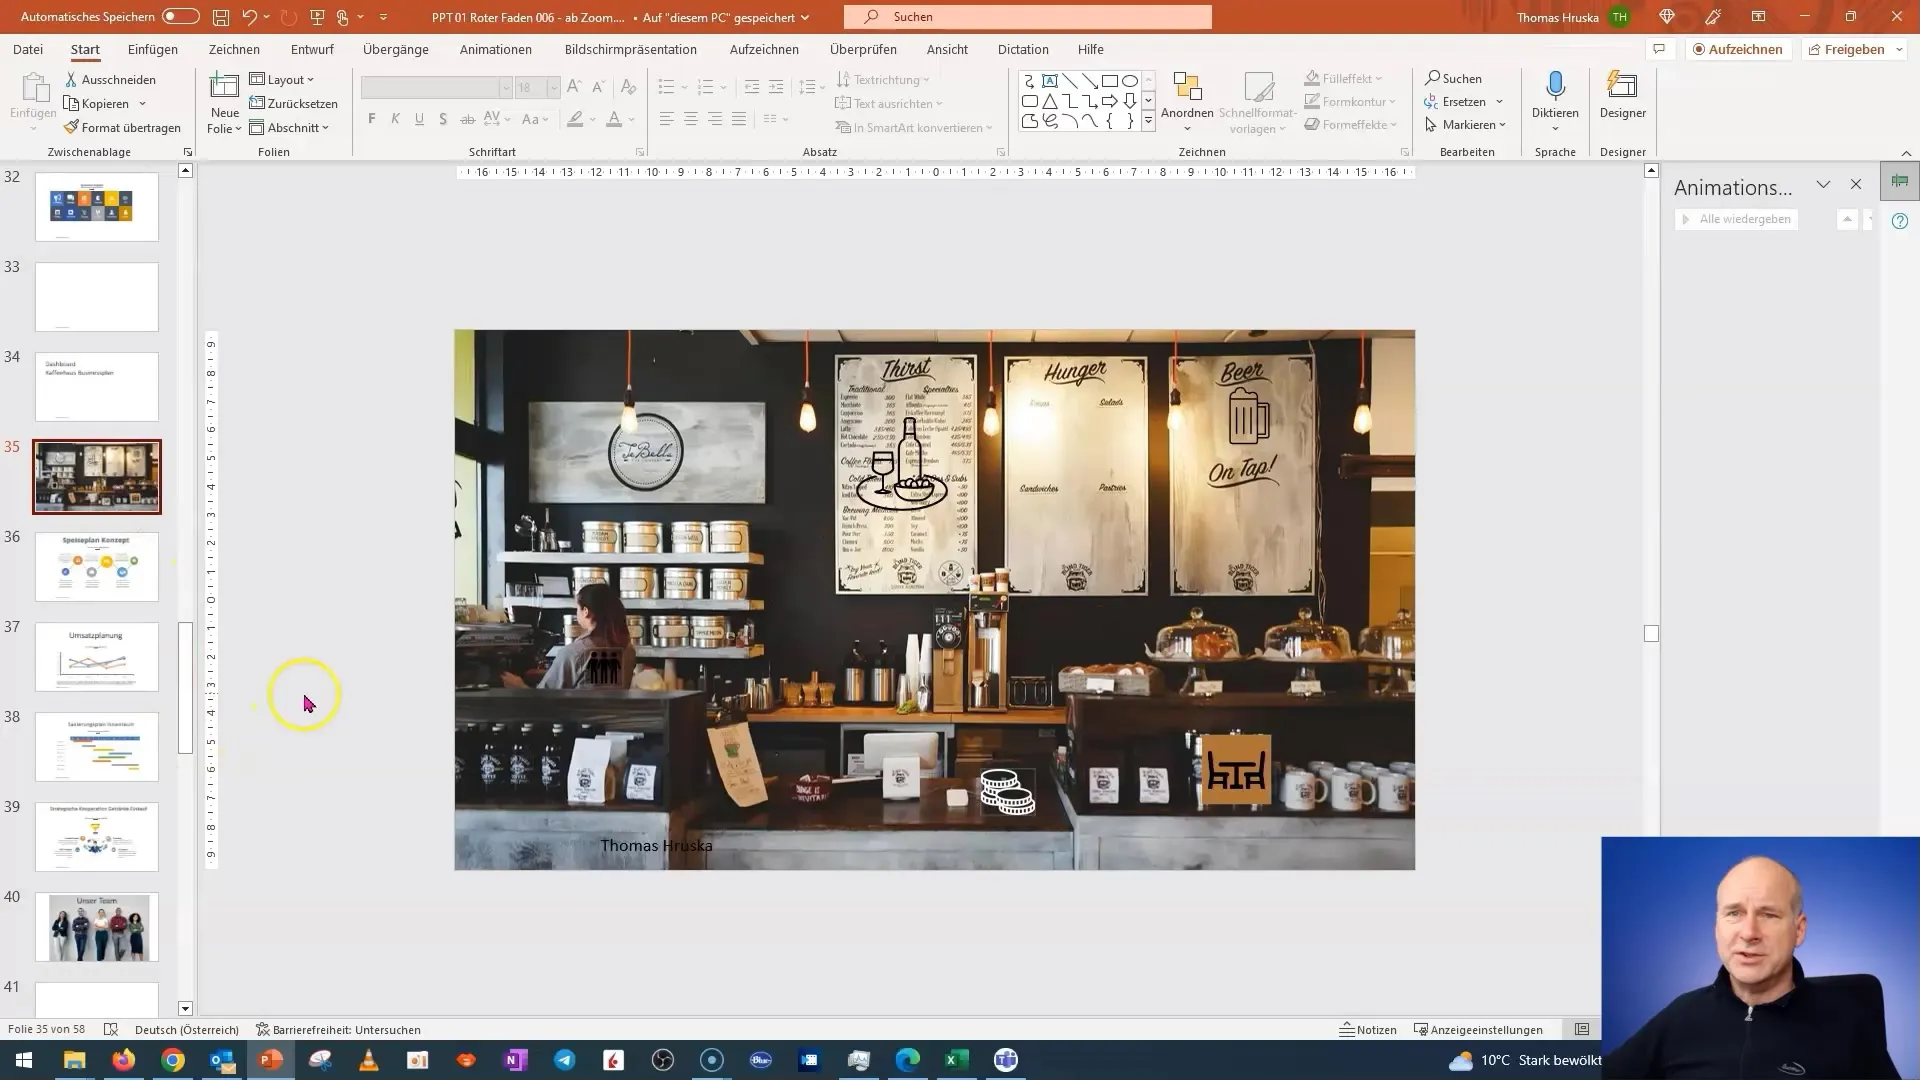
For the next section, strategic partnerships, place icons or logos of partner companies. It is important that these graphical elements appear clear and professional. Ensure that the logos do not blend into the background and are clearly visible.
Lastly, design the team section of your dashboard. Instead of inserting images of team members, I recommend reverting to transparent icons that symbolize the team.
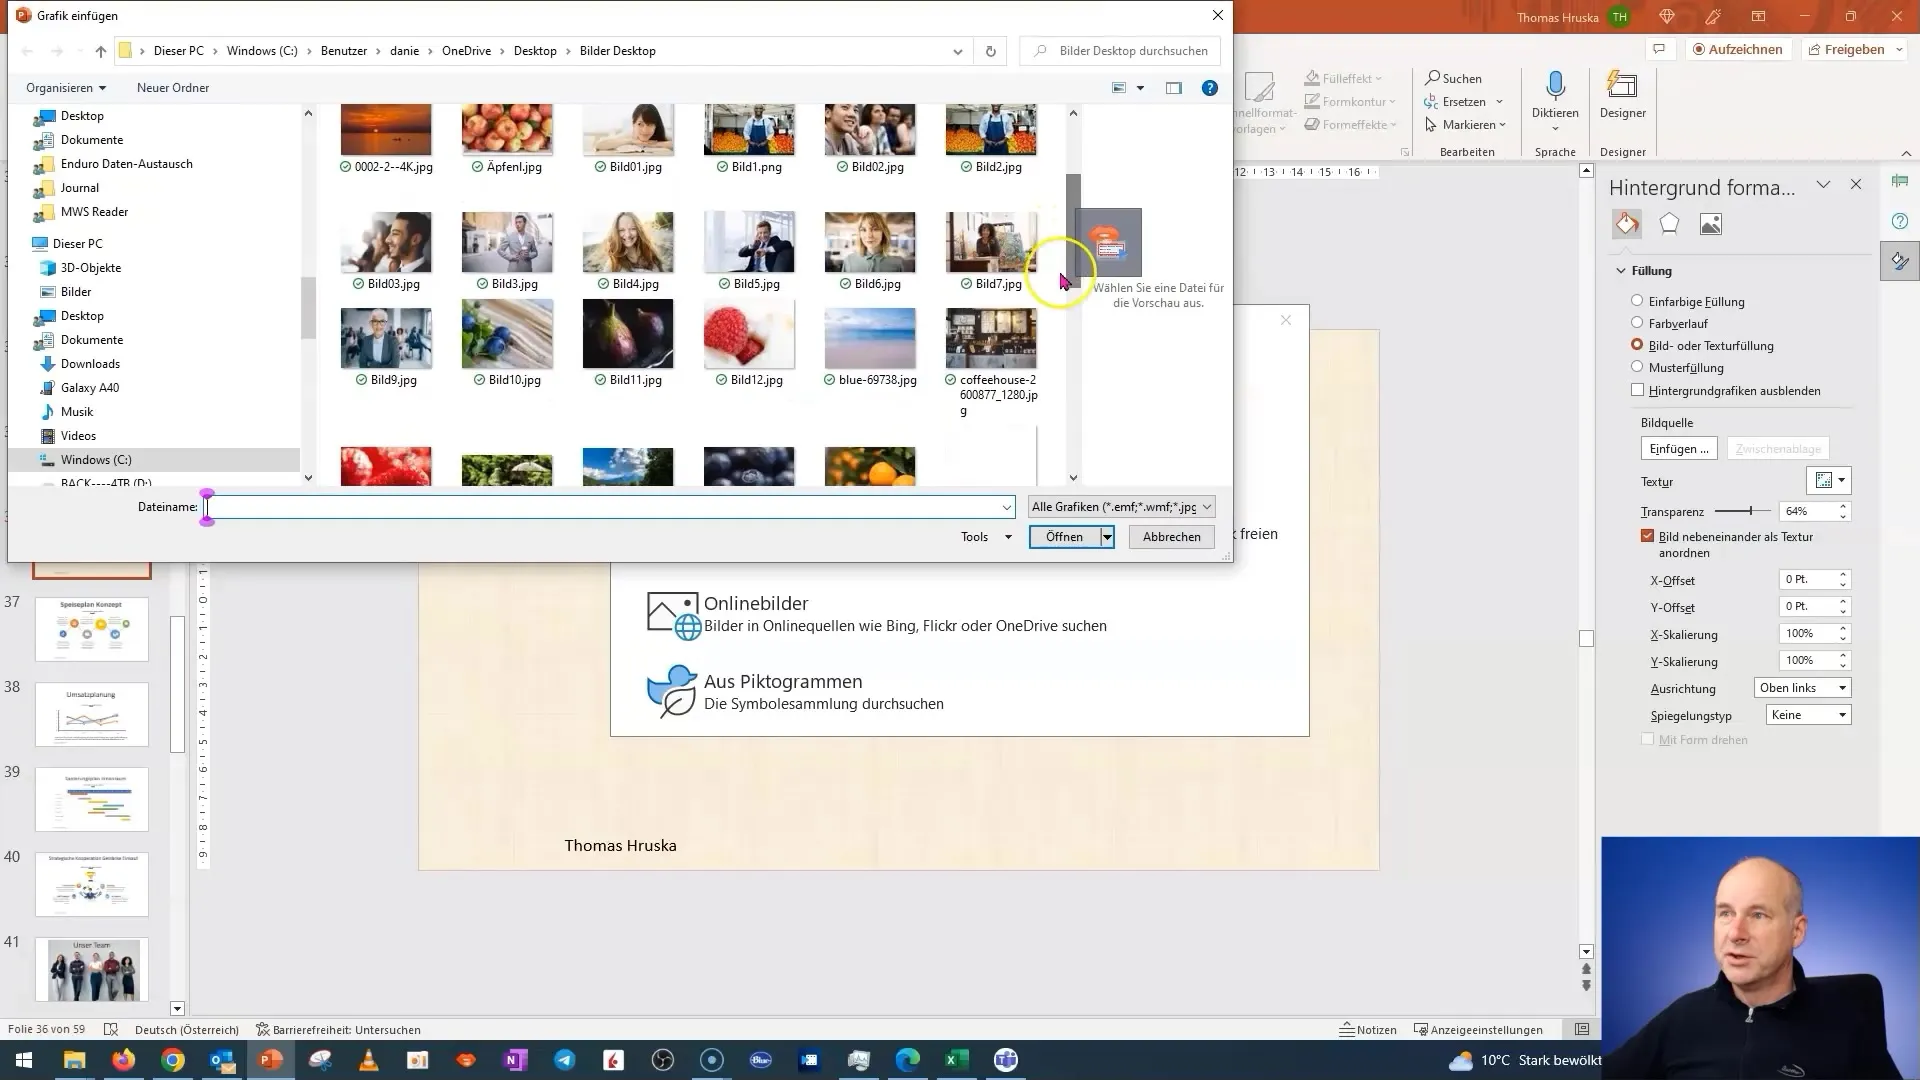
After adding all the elements, review the overall display of the slide once again to ensure that everything is well placed and clearly visible. A harmonious design conveys professionalism and gives your presentation the finishing touch.
Now you can activate the review functions so that your audience can jump back to specific details they are interested in at any time during your presentations.
Summary
In this guide, you have learned how to create a creative dashboard in PowerPoint that vividly and interactively presents your business plan. You have discovered the importance of using suitable graphics and icons and how to strategically structure your content to convey a clear message. Use these tips to elevate your presentations to the next level.
Frequently Asked Questions
How much time does it take to create this slide?It depends on your experience; however, with the right templates and images, it can be done quickly.
Can I use this technique for other presentations as well?Yes, this method is suitable for many different types of presentations, whether for marketing, finance, or other business areas.
Where can I find suitable icons?You can use free or paid graphic websites to search for the right icons for your project.


