The histogram is a fundamental tool in Adobe Lightroom Classic that helps you analyze the brightness distribution of your photos and make precise adjustments. The histogram is often perceived as a mystery that many photographers inadequately understand. In this tutorial, we will shed light on the histogram from the ground up, explain its significance, and show you how you can use it to improve your image editing.
Key Insights
The histogram shows the brightness distribution of the pixels in your image and allows you to obtain crucial information about exposure and image quality. It is important not only to view the histogram as an indicator of overexposed or underexposed areas but also to understand how it affects the quality of your photos.
Understanding the Histogram
What is a Histogram?
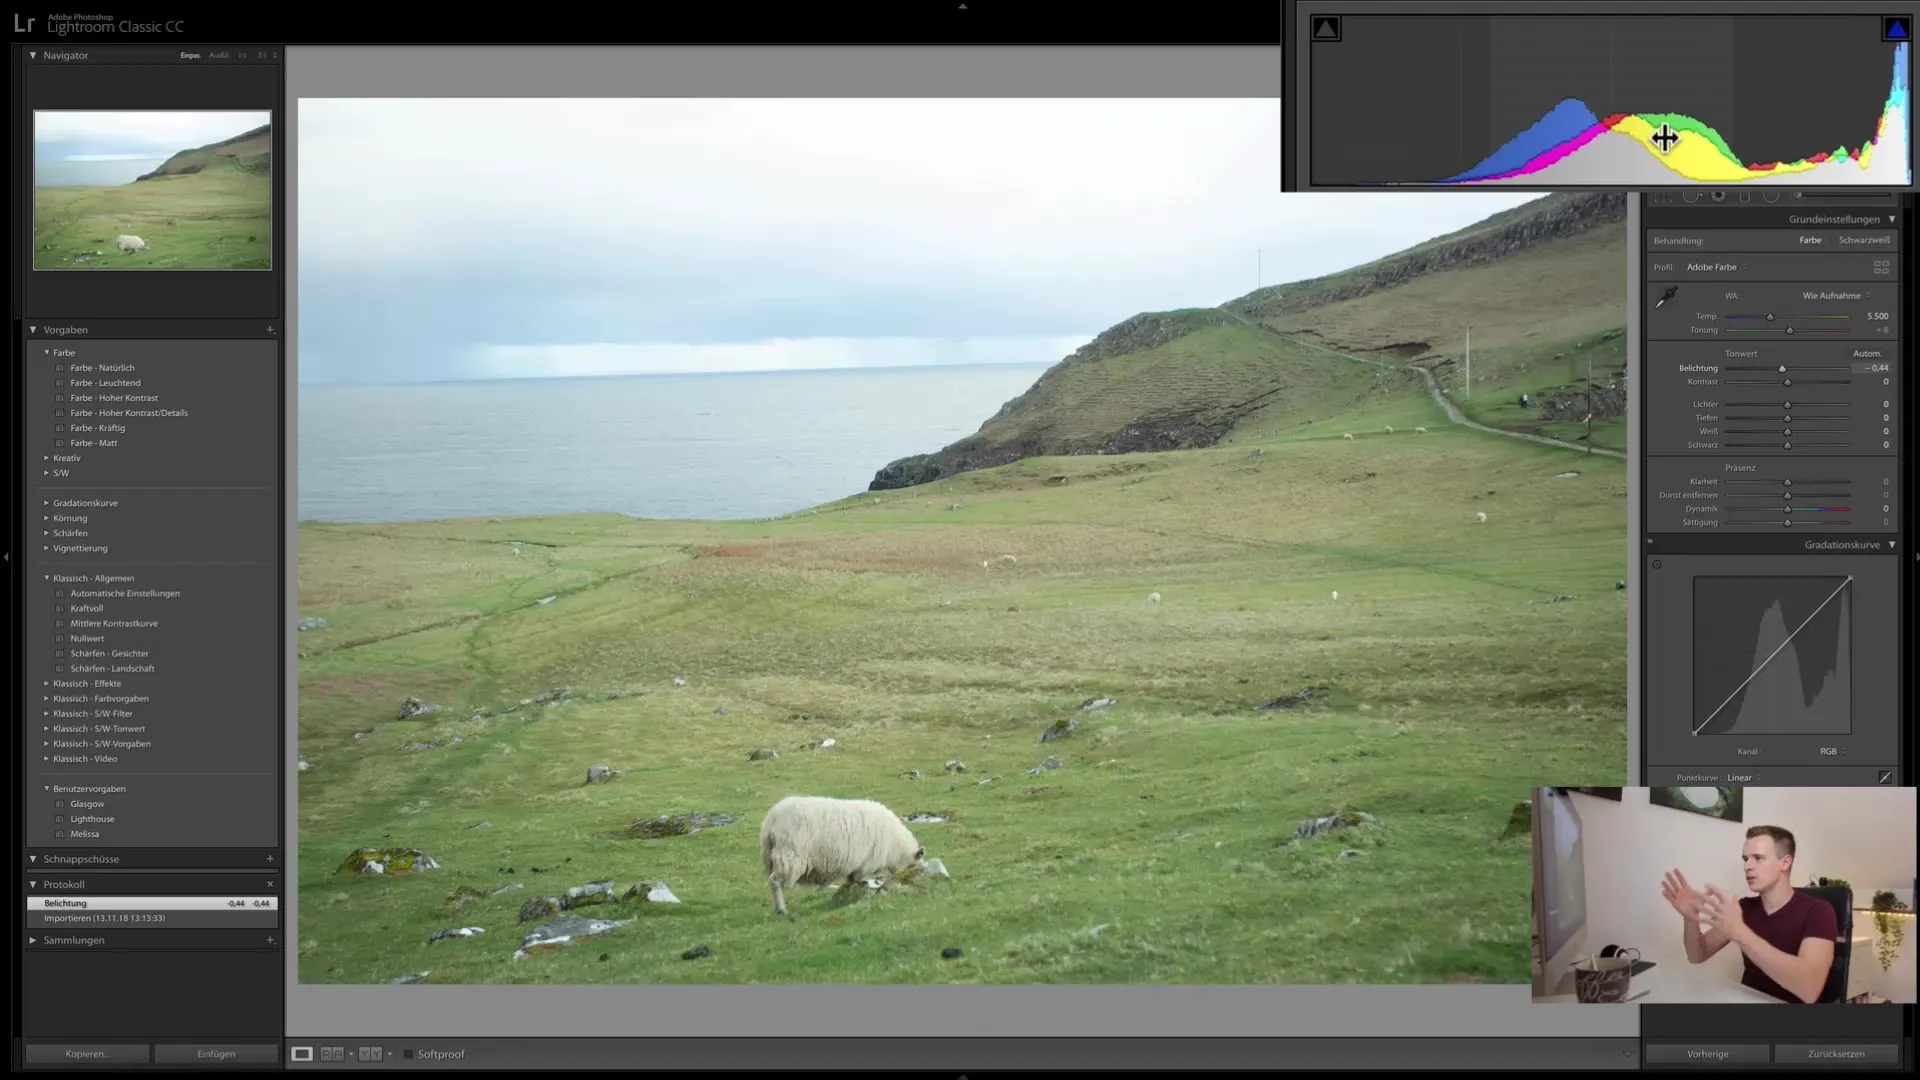
The histogram is a graphical representation that displays the number of pixels on the vertical axis and the brightness values (from 0 to 255) on the horizontal axis. You can think of the histogram as a kind of brightness statistics of your image, providing you with information on how many pixels are present in different brightness ranges.
Analyzing Brightness Distribution
When working with a histogram, it is crucial to understand the distribution of brightness values. This means being able to determine how many pixels are present in the dark, mid-tone, and bright areas of your image. This way, you can ascertain whether your image is well-exposed or if adjustments may be necessary.
Using the Histogram for Image Editing
Identifying Overexposure and Underexposure
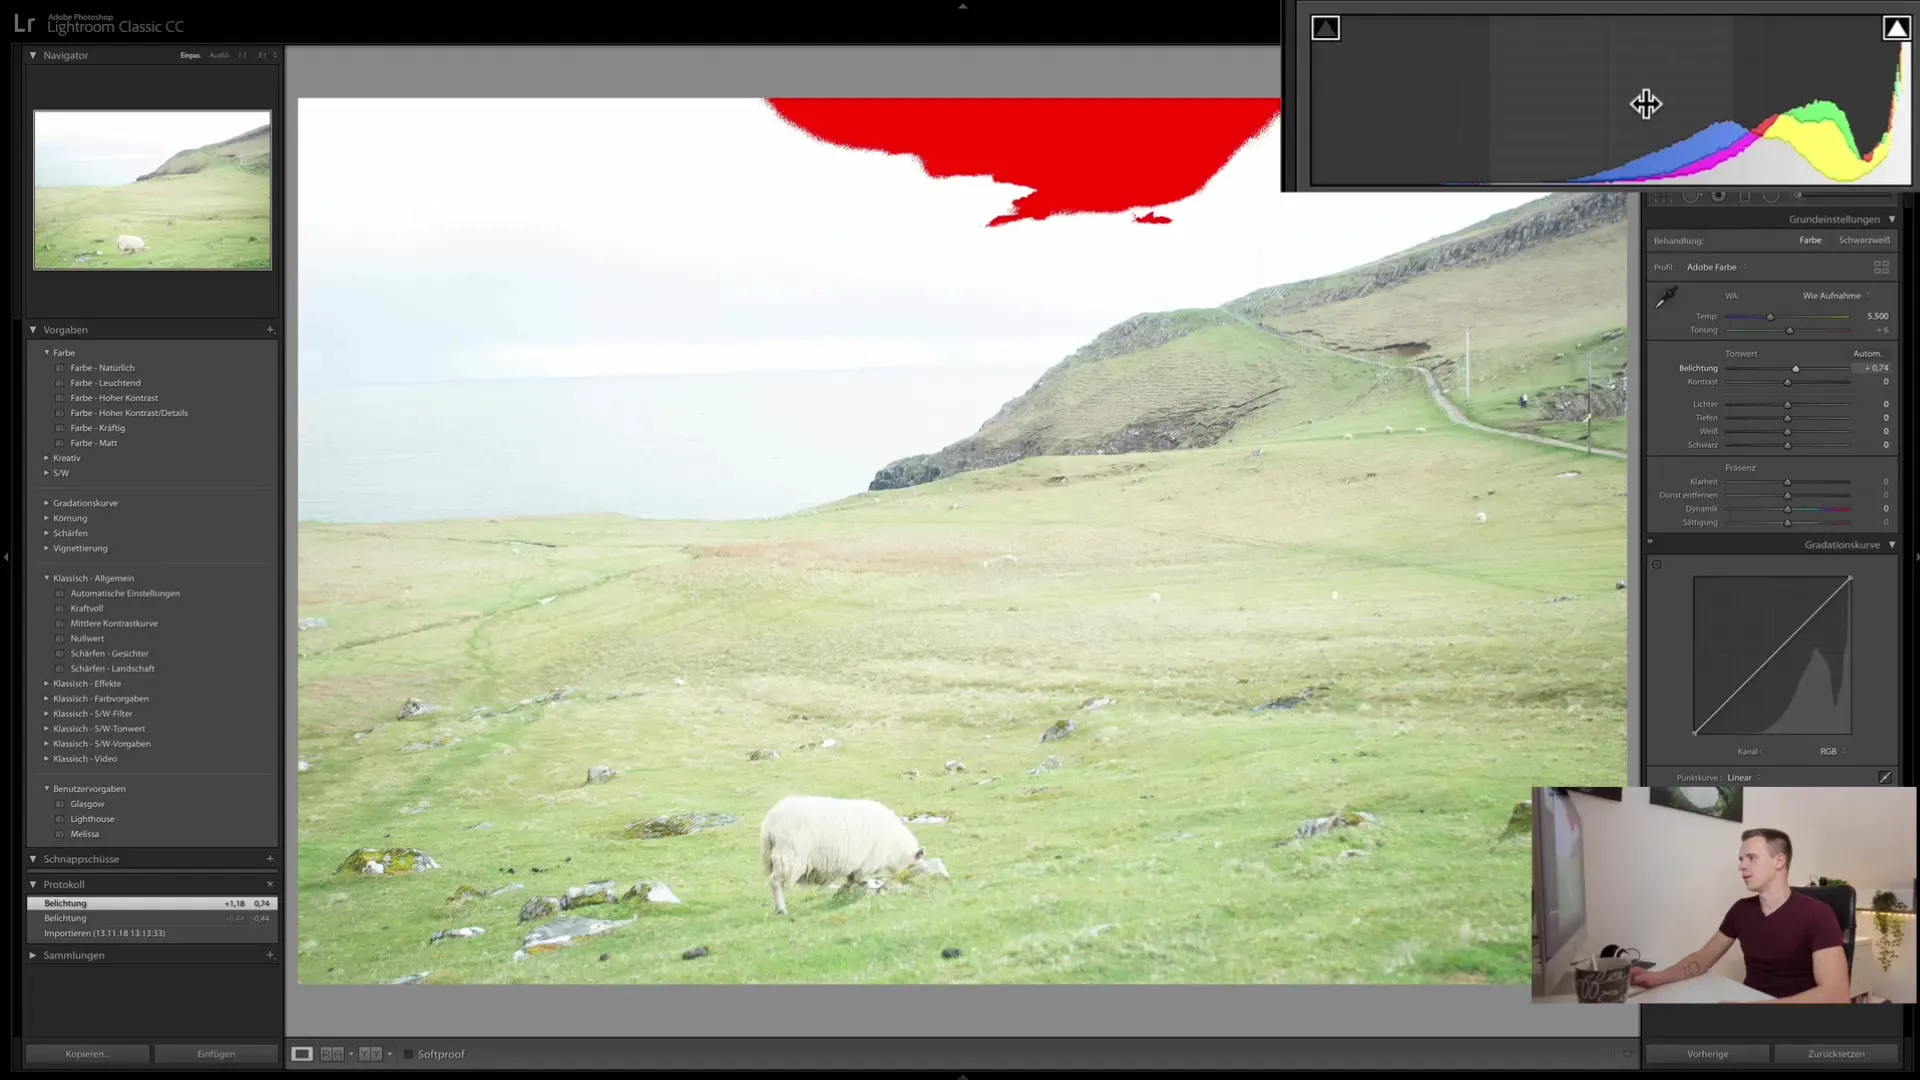
When you have an image, the first thing you should do is take a look at the histogram. Overexposure is indicated by a high spike to the right in the histogram. This means that parts of your image, especially bright areas, may lack detail information.

To check this, you can enable the highlight warning in Lightroom. This warning will show you in red color when a part of your image is overexposed, helping you make critical adjustments.
Adjusting Exposure
If you find that your image is too bright, you can adjust the exposure. Move the exposure slider to the left to darken the image, and pay attention to how the histogram changes. Ideally, the spike should not go too far to the right, as this indicates correct exposure of the image.

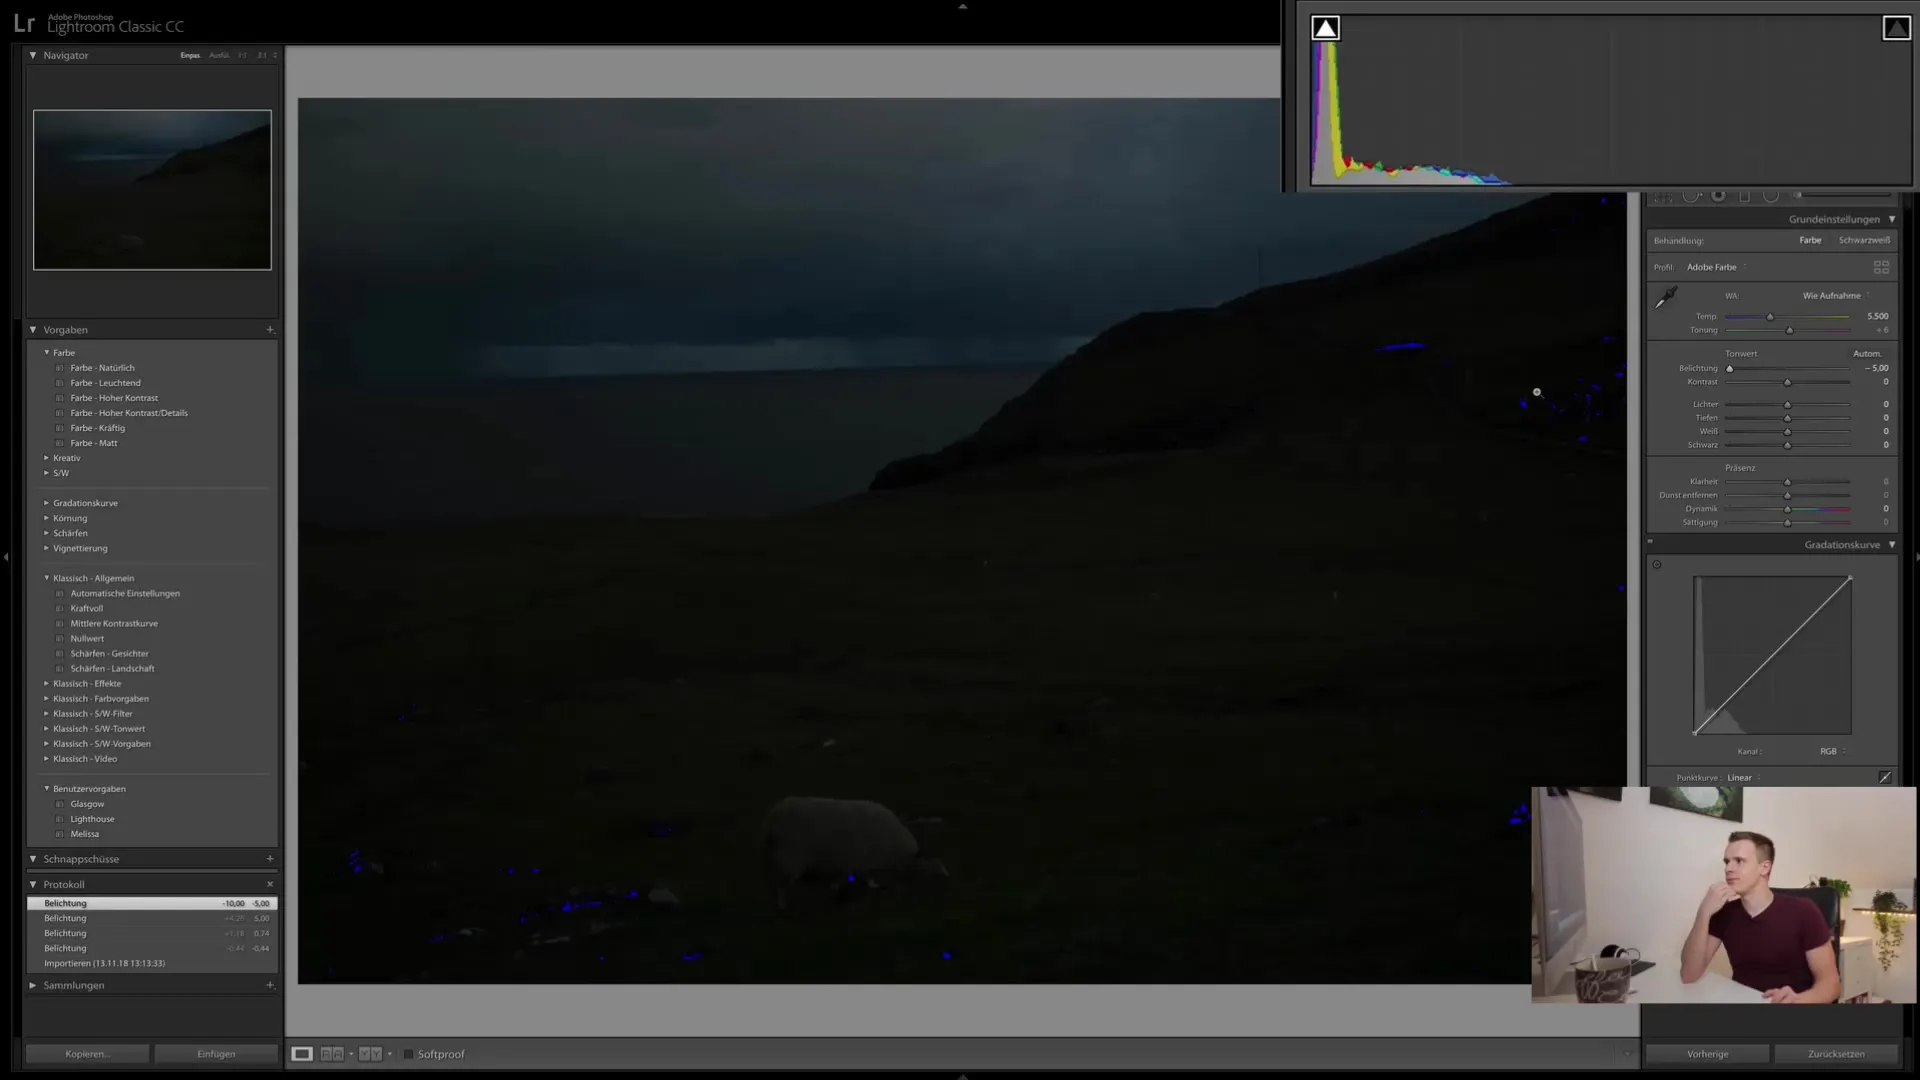
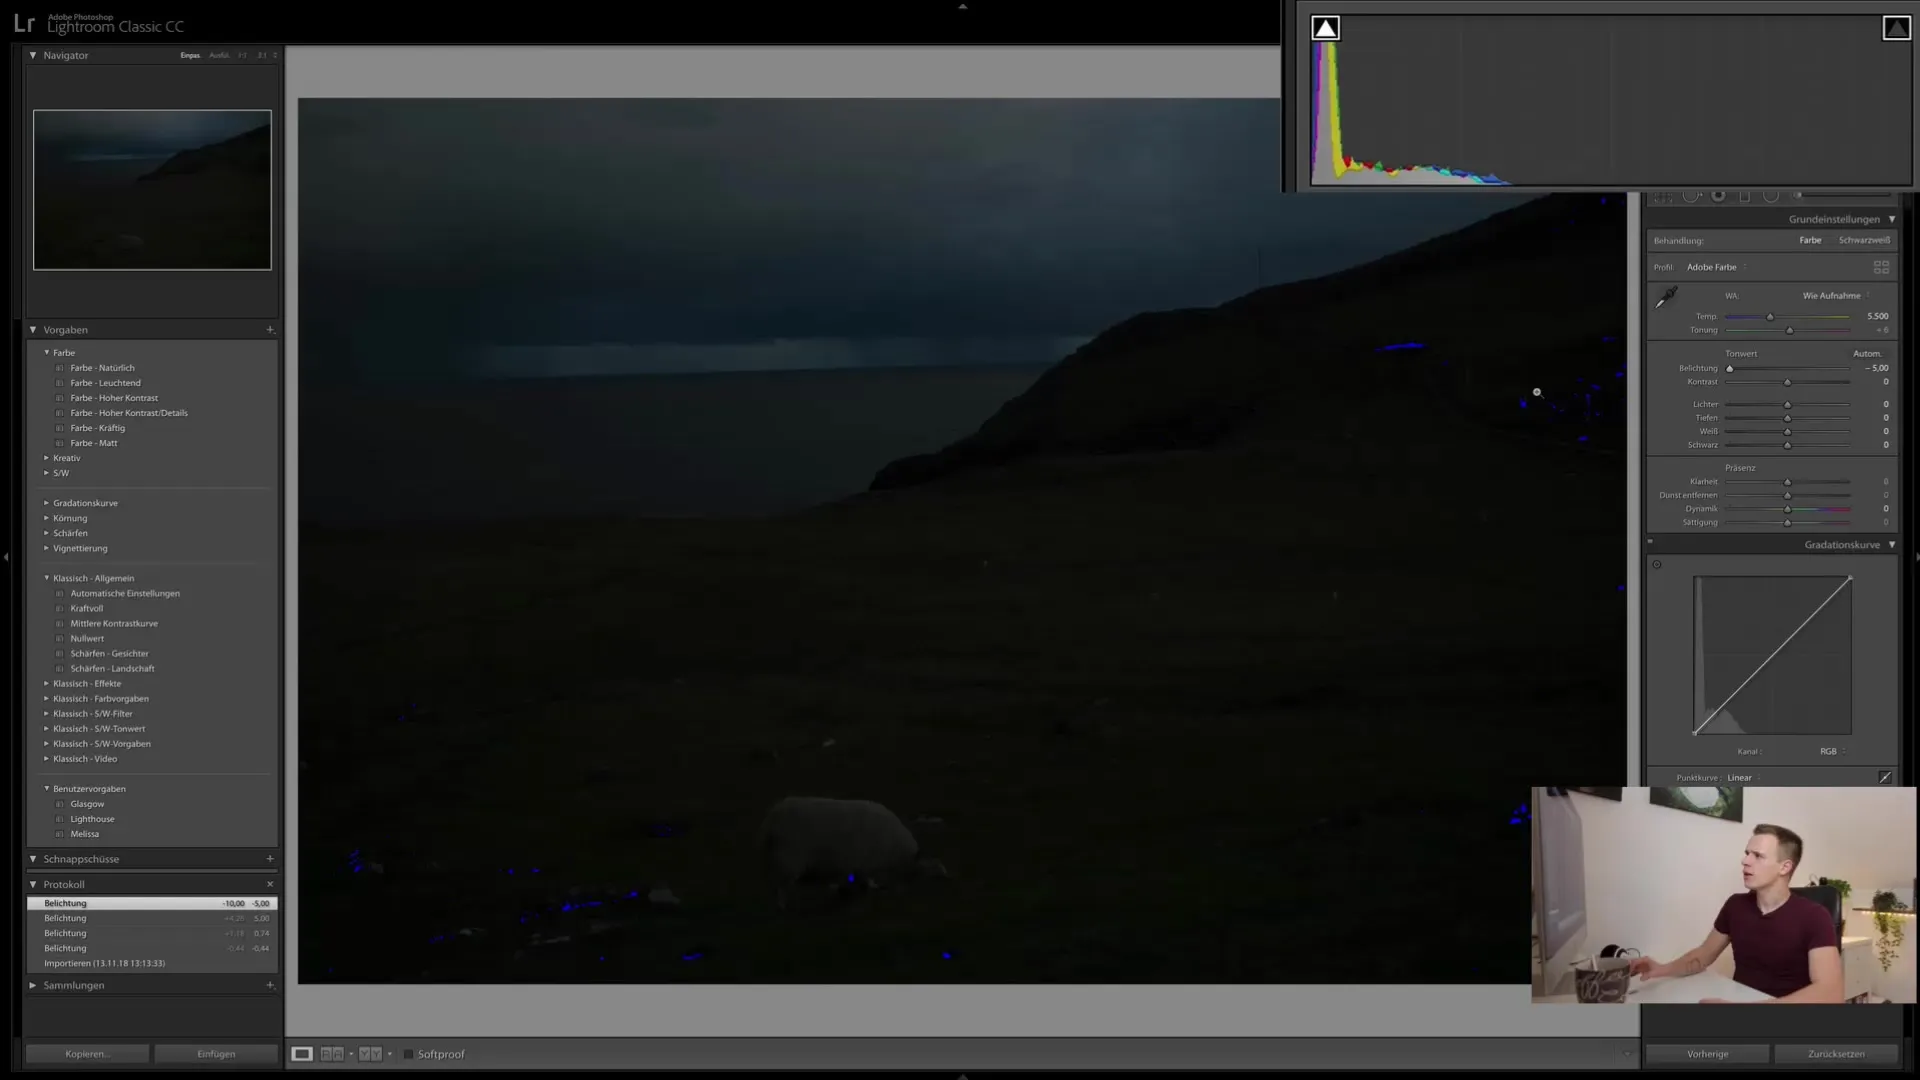
Conversely, the same applies to underexposed images. Here, a strong spike to the left in the histogram may indicate that too many details have been lost in the dark areas.

Understanding the Significance of Color Overlays
When making image adjustments, it can be helpful to look at color overlays. This is done by activating the corresponding checkboxes. A bluish tint can indicate that areas in the image are too dark, while a red color cast suggests overexposure. Ensure that the histogram is not overloaded in critical areas.

Summary
The histogram is an indispensable tool for every photographer to understand the brightness distribution of an image in detail. By learning how to use the histogram correctly and adjust the brightness of your photos optimally, you can significantly enhance the quality of your image editing. Remember that the histogram only provides you with clues; the creative decision on exposure ultimately lies with you.
Frequently Asked Questions
What is a Histogram?A histogram is a graphical representation that shows the brightness distribution of pixels in an image.
How can I tell if an image is overexposed?An overexposed image displays a high spike to the right in the histogram and may have blown-out red color areas.
How do I adjust exposure?You can adjust exposure by shifting the exposure slider to the left or right and observing the histogram.
What does a red color warning indicate?A red color warning indicates that a section of the image is overexposed and lacks detail information.
Are color overlays important?Yes, color overlays can help you identify problematic areas in your image and make adjustments based on them.


