If you have programmed with Python, you have probably encountered errors at some point. Sometimes, it is easy to identify them, but in more complex applications, debugging can be challenging. This is where the Python Debugger, also known as PDB, comes into play. With it, you can check the state of your program at any time, inspect variable values, and figure out what went wrong. In this guide, you will learn how to effectively use the PDB debugger to optimize your Python projects.
Key Insights
- The PDB debugger allows you to step through the code line by line.
- Using the pdb.set_trace() function, you can pause the debugging process at any point in the code.
- You can inspect variables, execute code interactively, and easily identify errors.
Step-by-Step Guide
Import PDB Module
To use the debugger, you need to import the PDB module. This is done with the command import pdb. Setting a breakpoint at the beginning of your code makes it easier to check execution at any point.
Define Variables
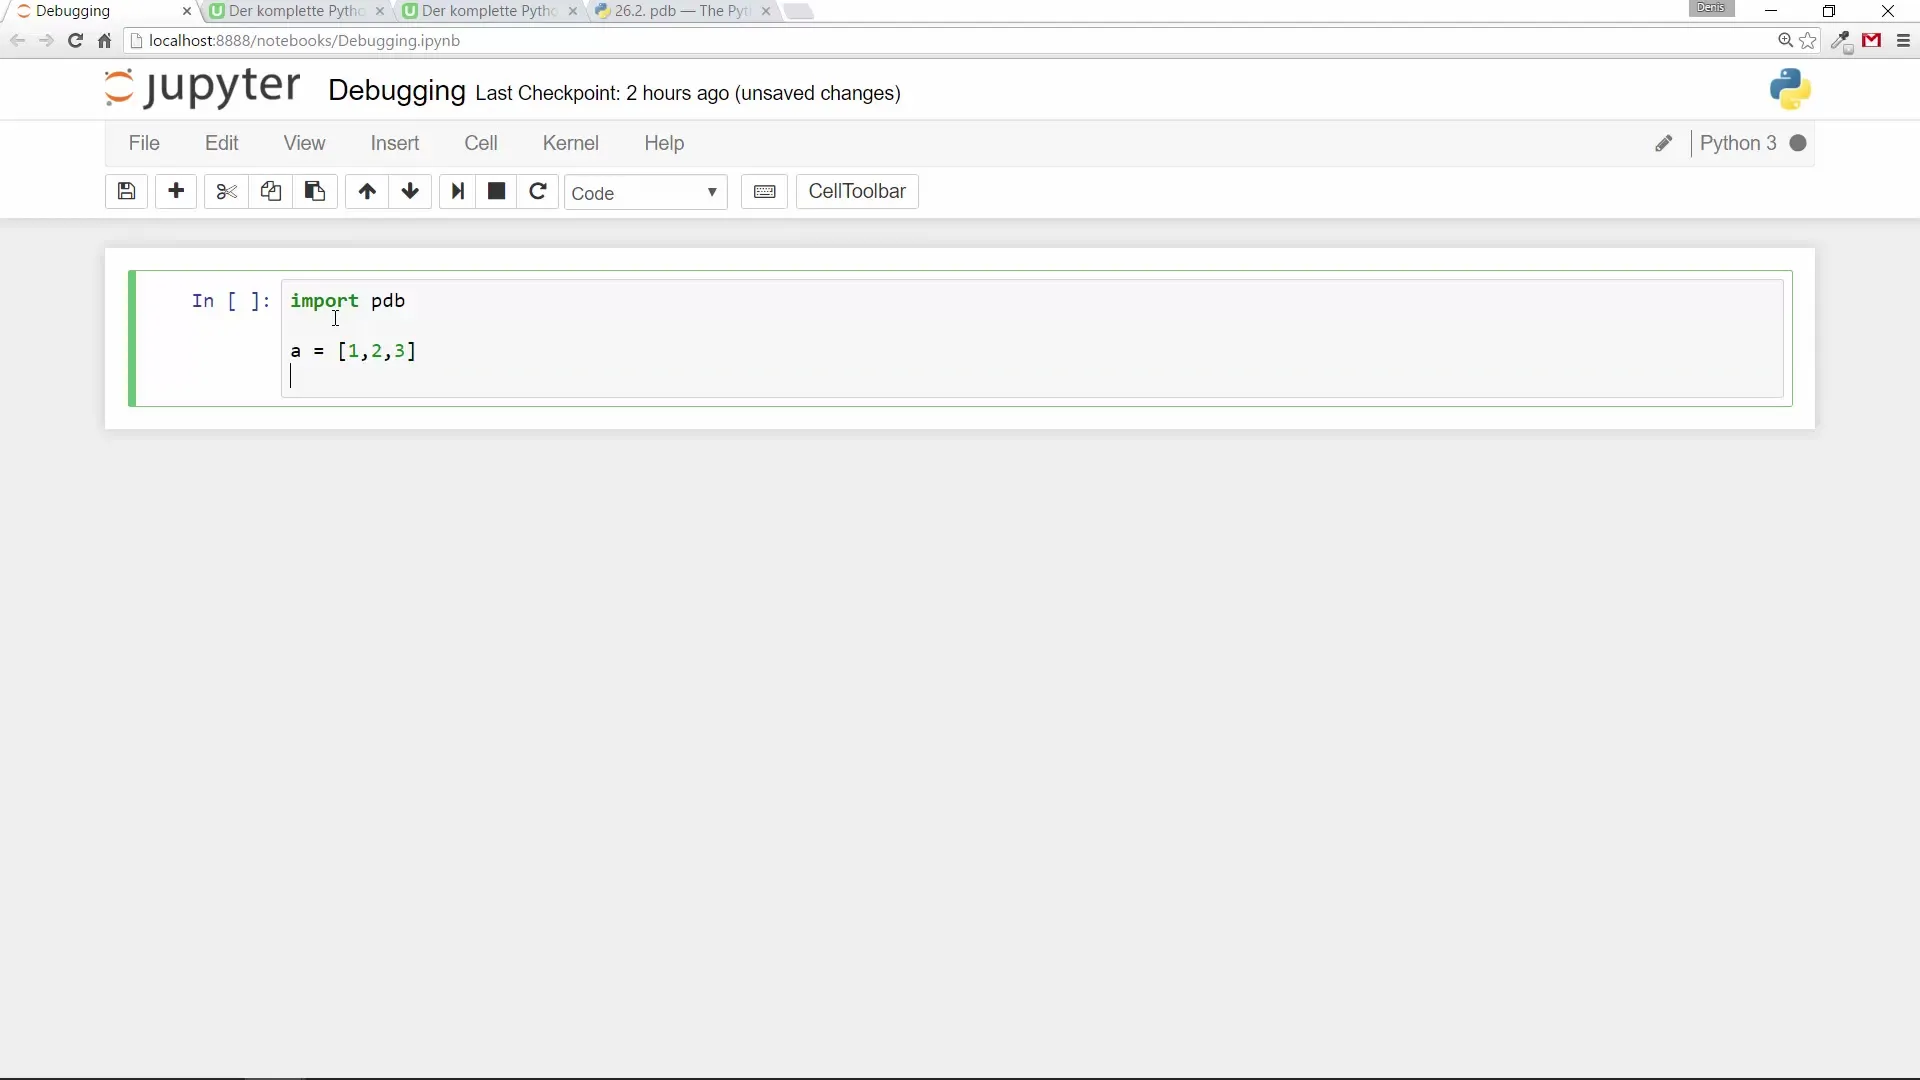
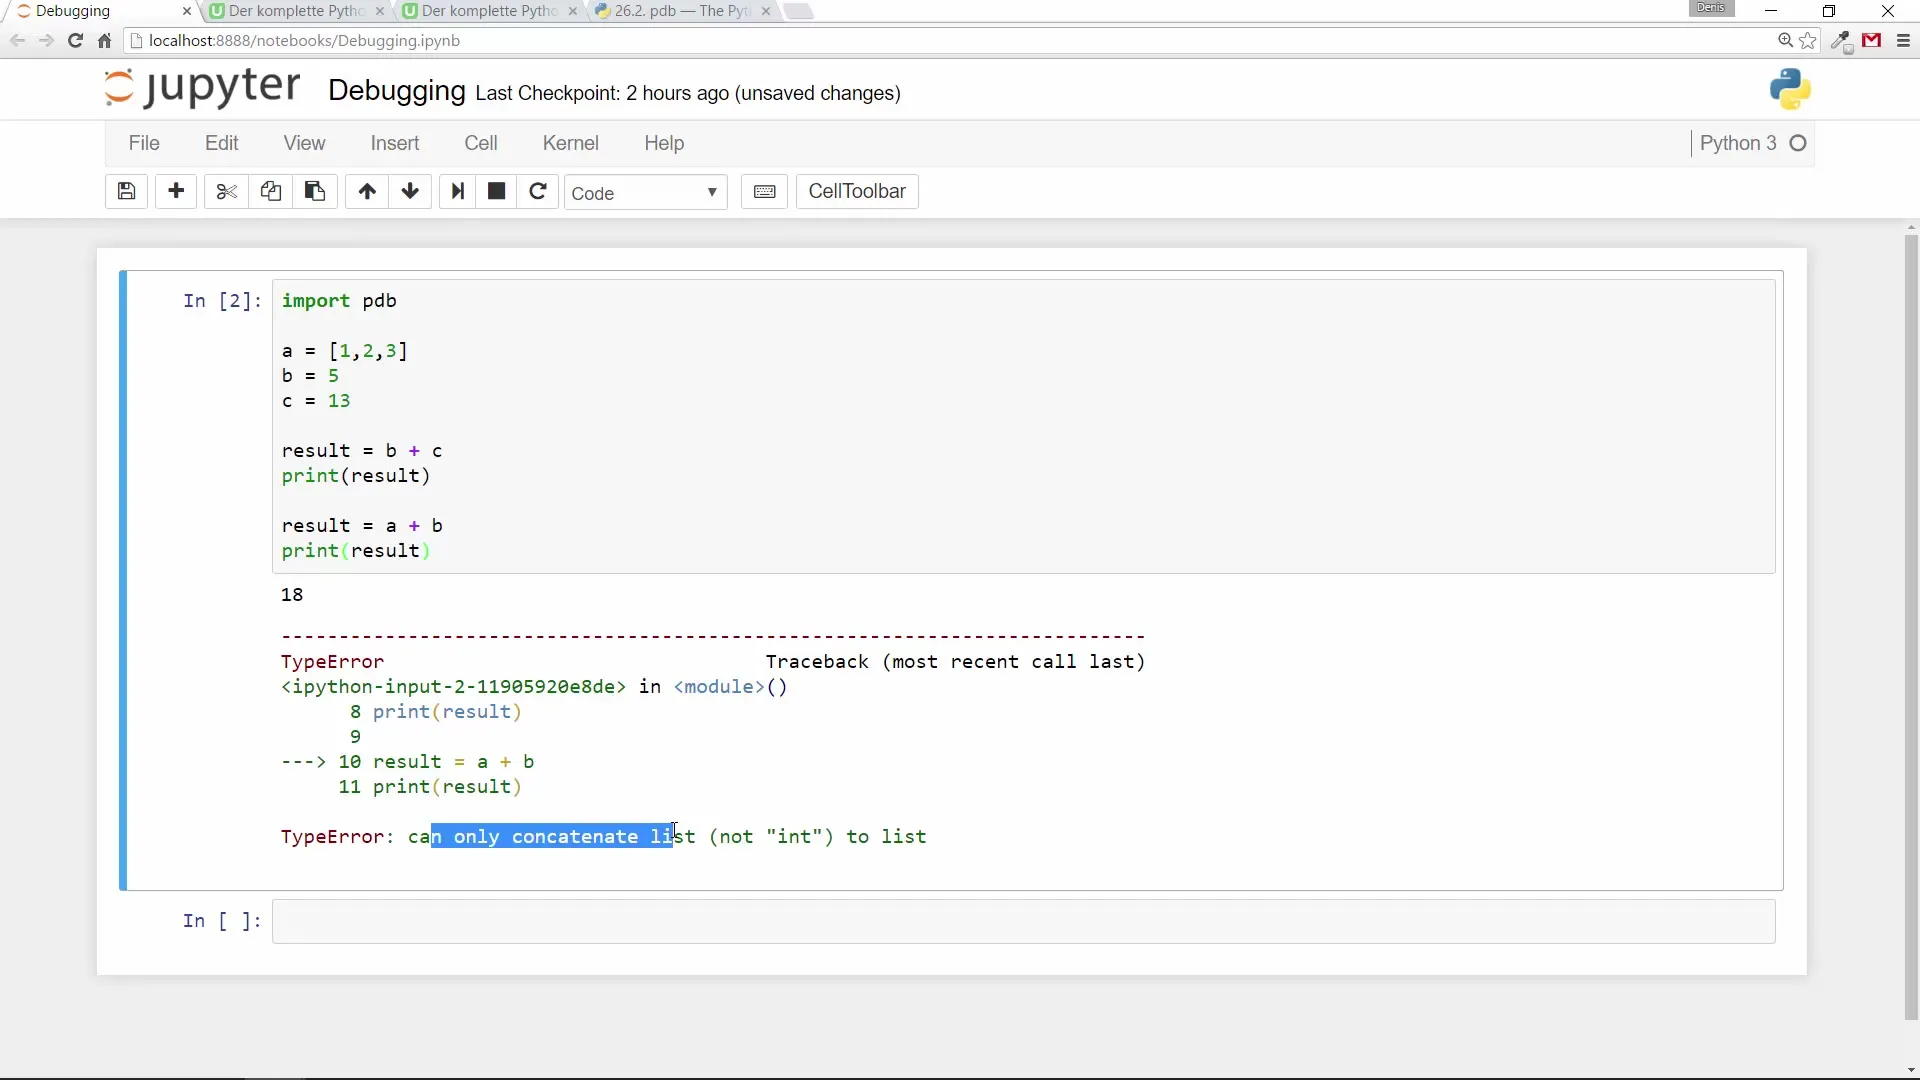
Now you will define some variables for your application. For example, create a list a with values and two more variables b and c that represent simple integers. You can then perform various calculations and observe the results.
Perform Simple Calculations
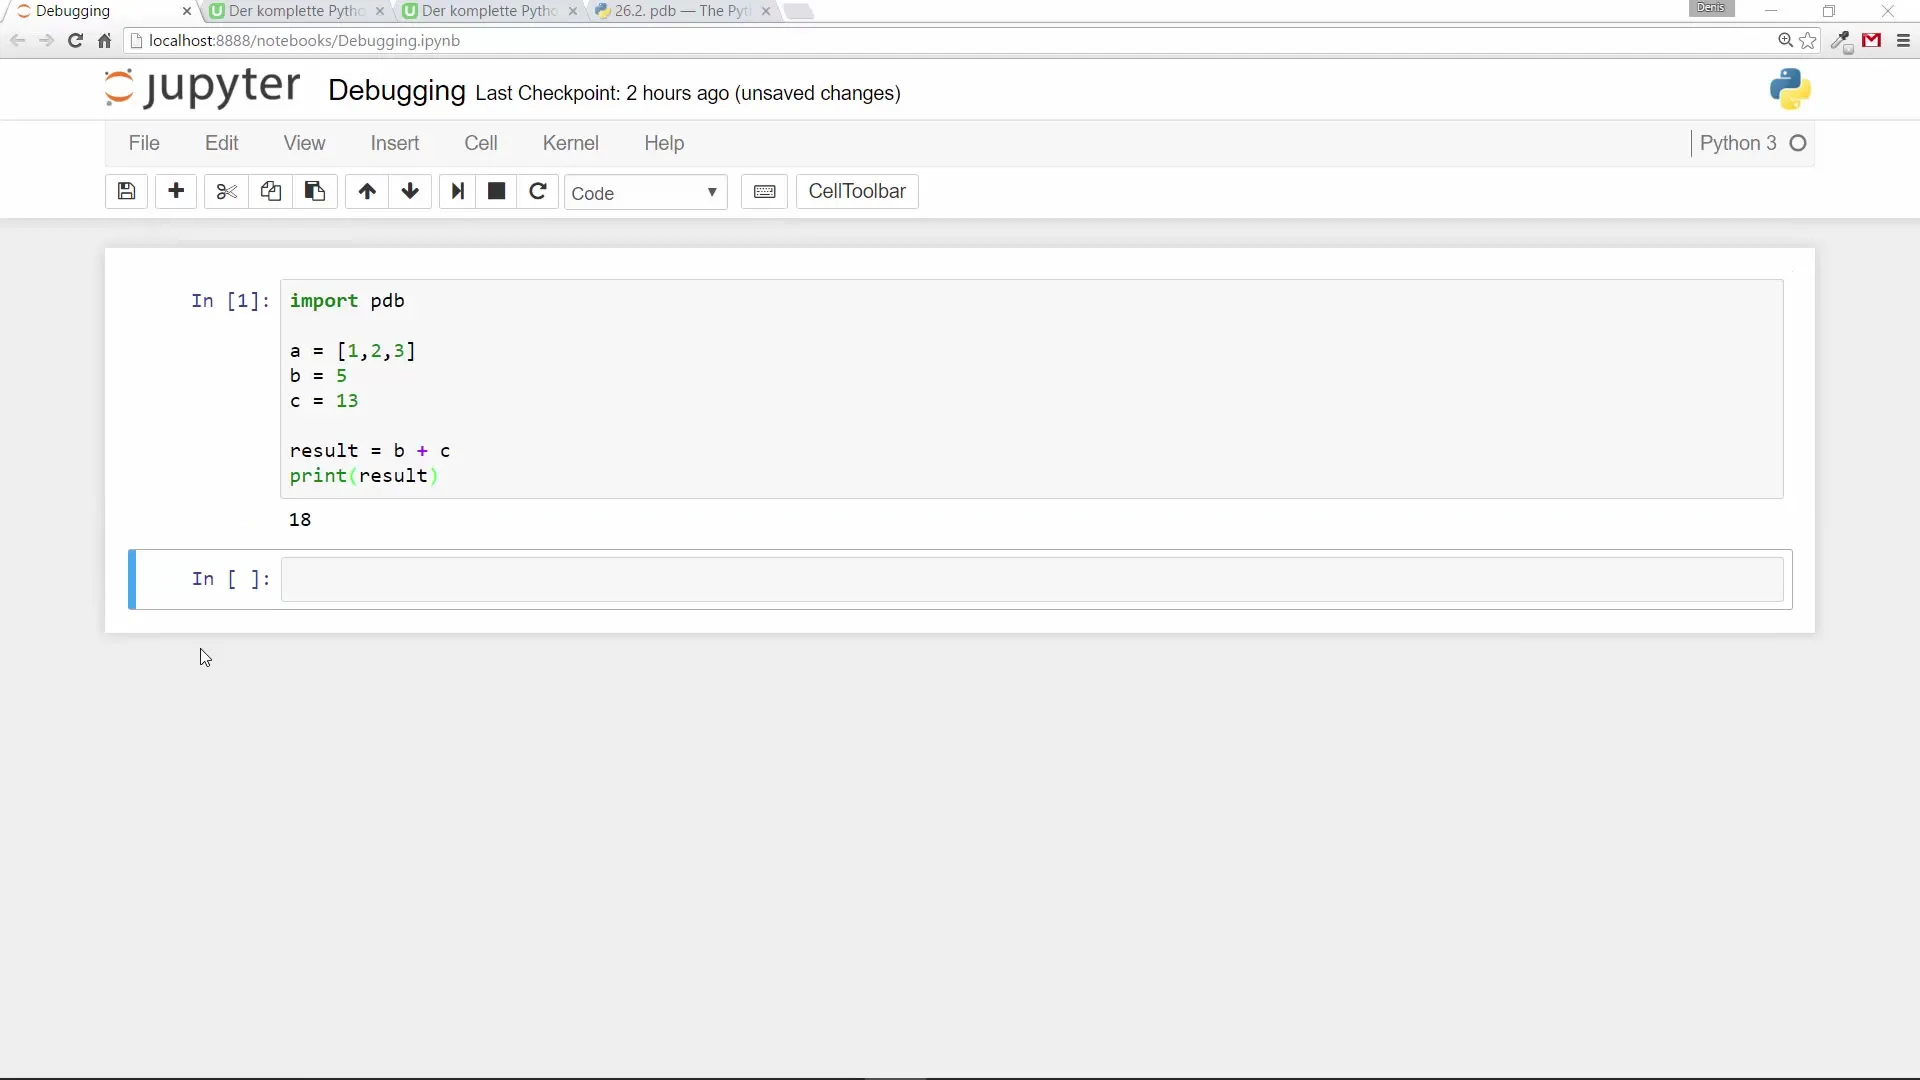
Perform a simple calculation, such as adding b and c. This is a simple step to ensure that the code works as expected. The expected output should be 18 when you add b (5) and c (13).
Error Handling
Now an error occurs when you try to add the list a to the integer b. Python will raise a TypeError indicating that you are trying to concatenate a list with an Integers. This can cause confusion at first, especially in a larger program.
Using pdb.set_trace()
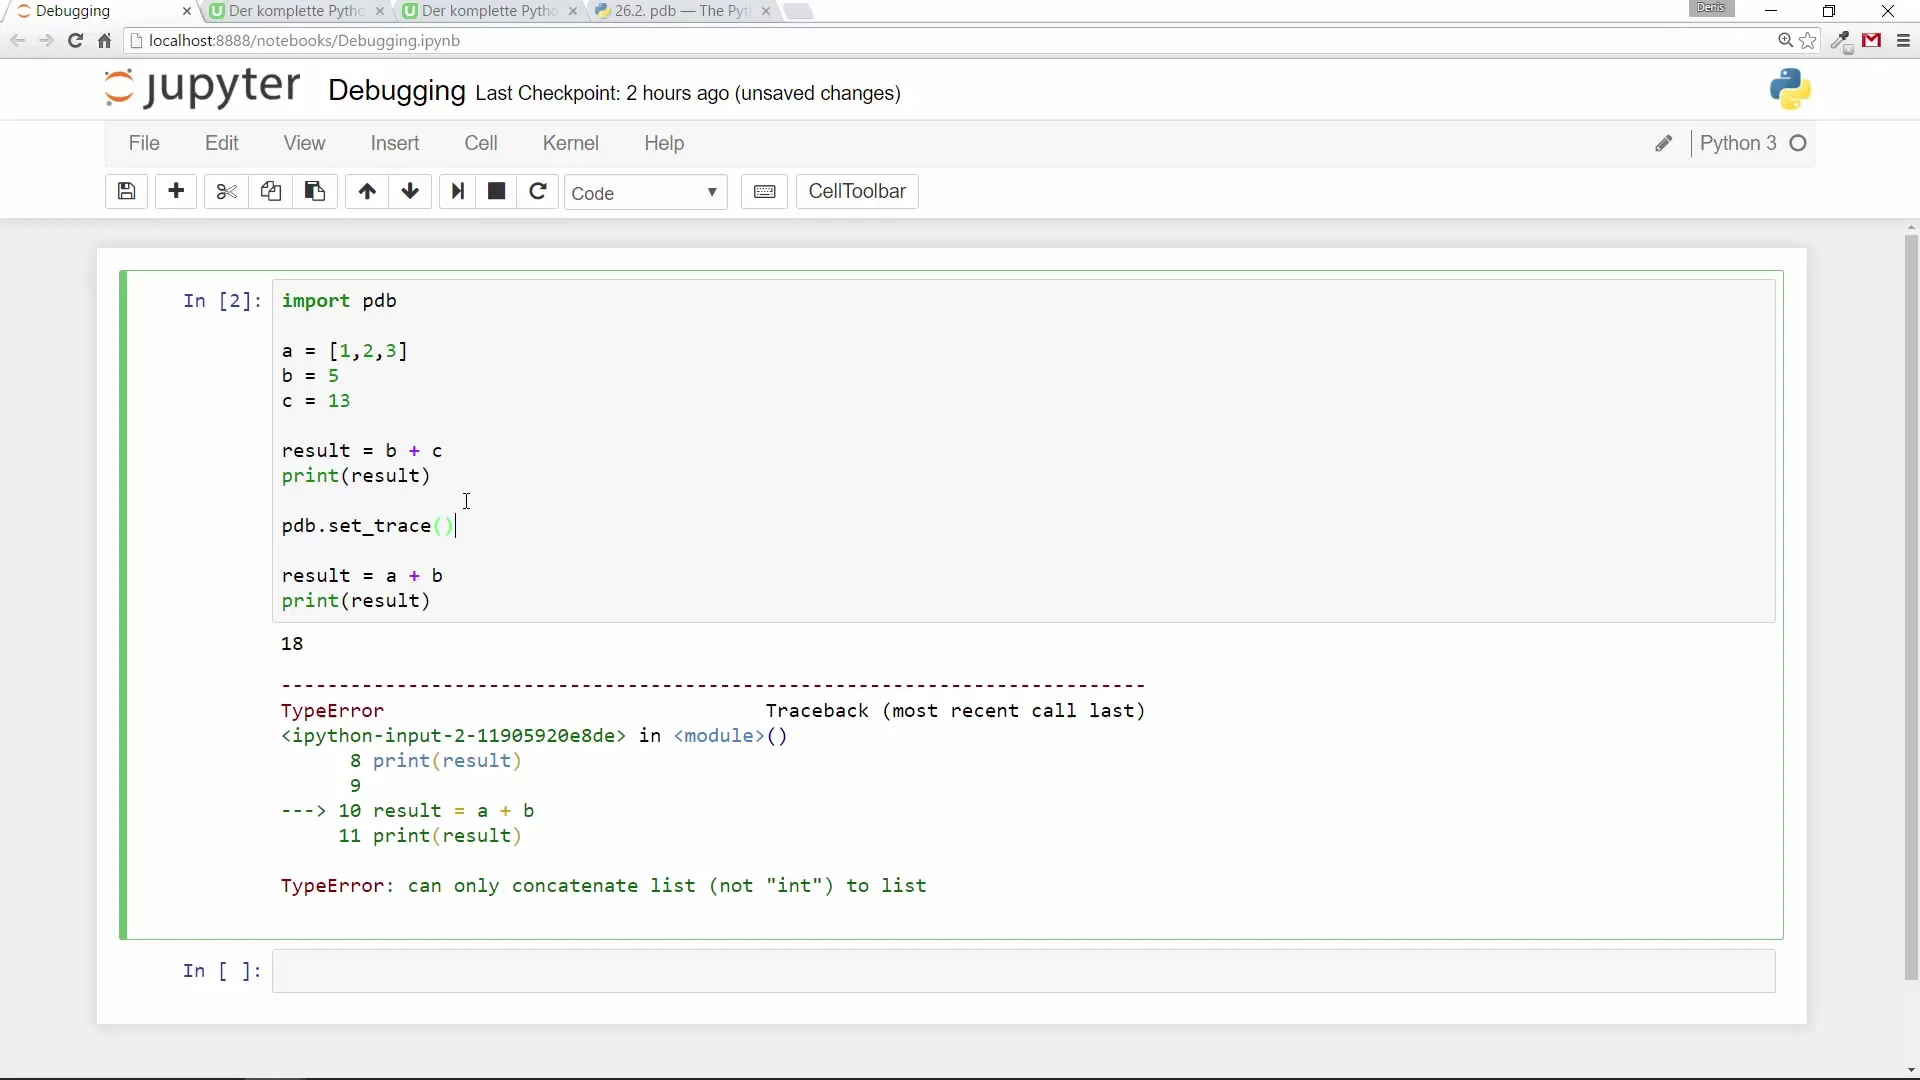
To learn more about the cause of the error, you insert the command pdb.set_trace() before the problematic line. When you now run the code, execution will pause at that exact point. This gives you the opportunity to interact with the code and see what the variables actually contain.
Inspecting Variables
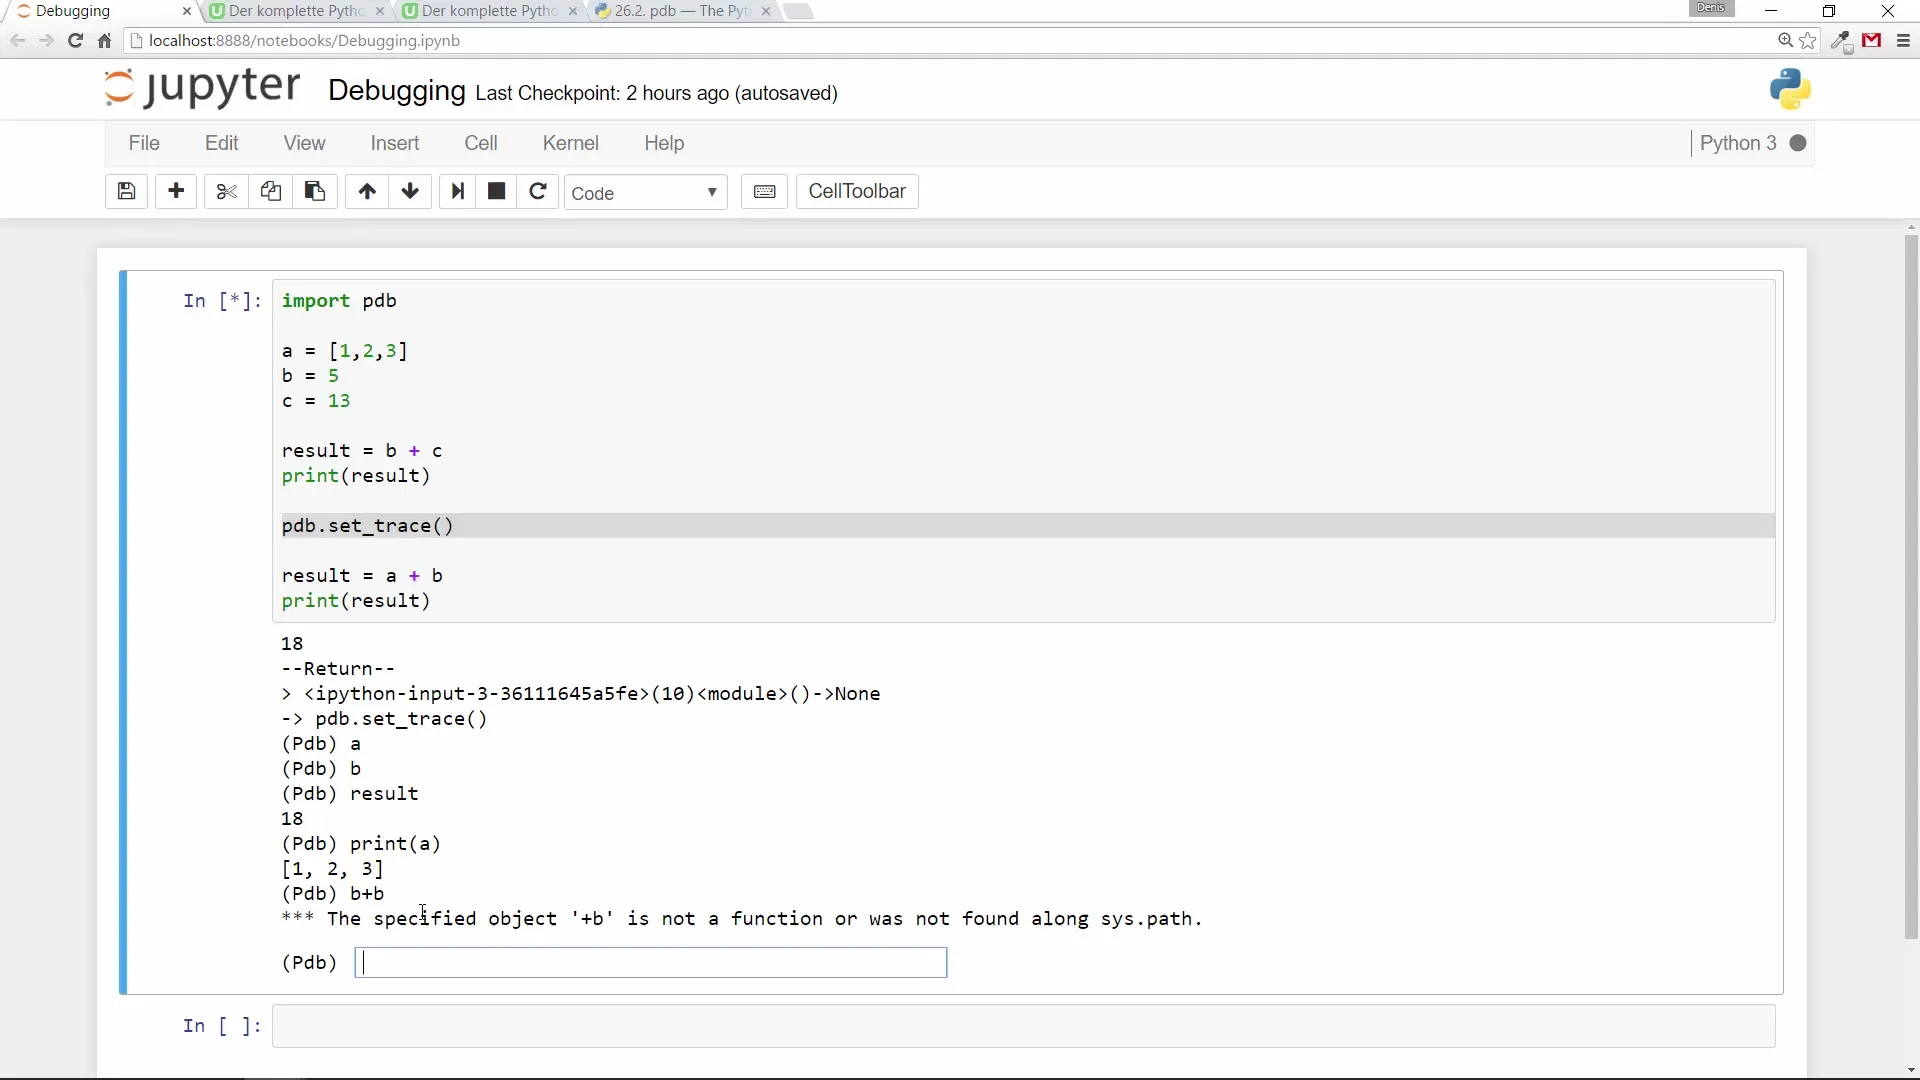
Once the execution is stopped, you can inspect various variables. This allows you to check which values are assigned to them. If you simply type the variable name into the terminal, you will see the current value. For example, if you pass a, you will get the list you defined at the beginning.
Testing Expressions
In addition to variables, you can also test code expressions in the debugger. For example, you can try b + b to see what happens. This may lead you to any logical errors in your code, or you can simply try executing print(b) to see the result directly.
More Usage Options
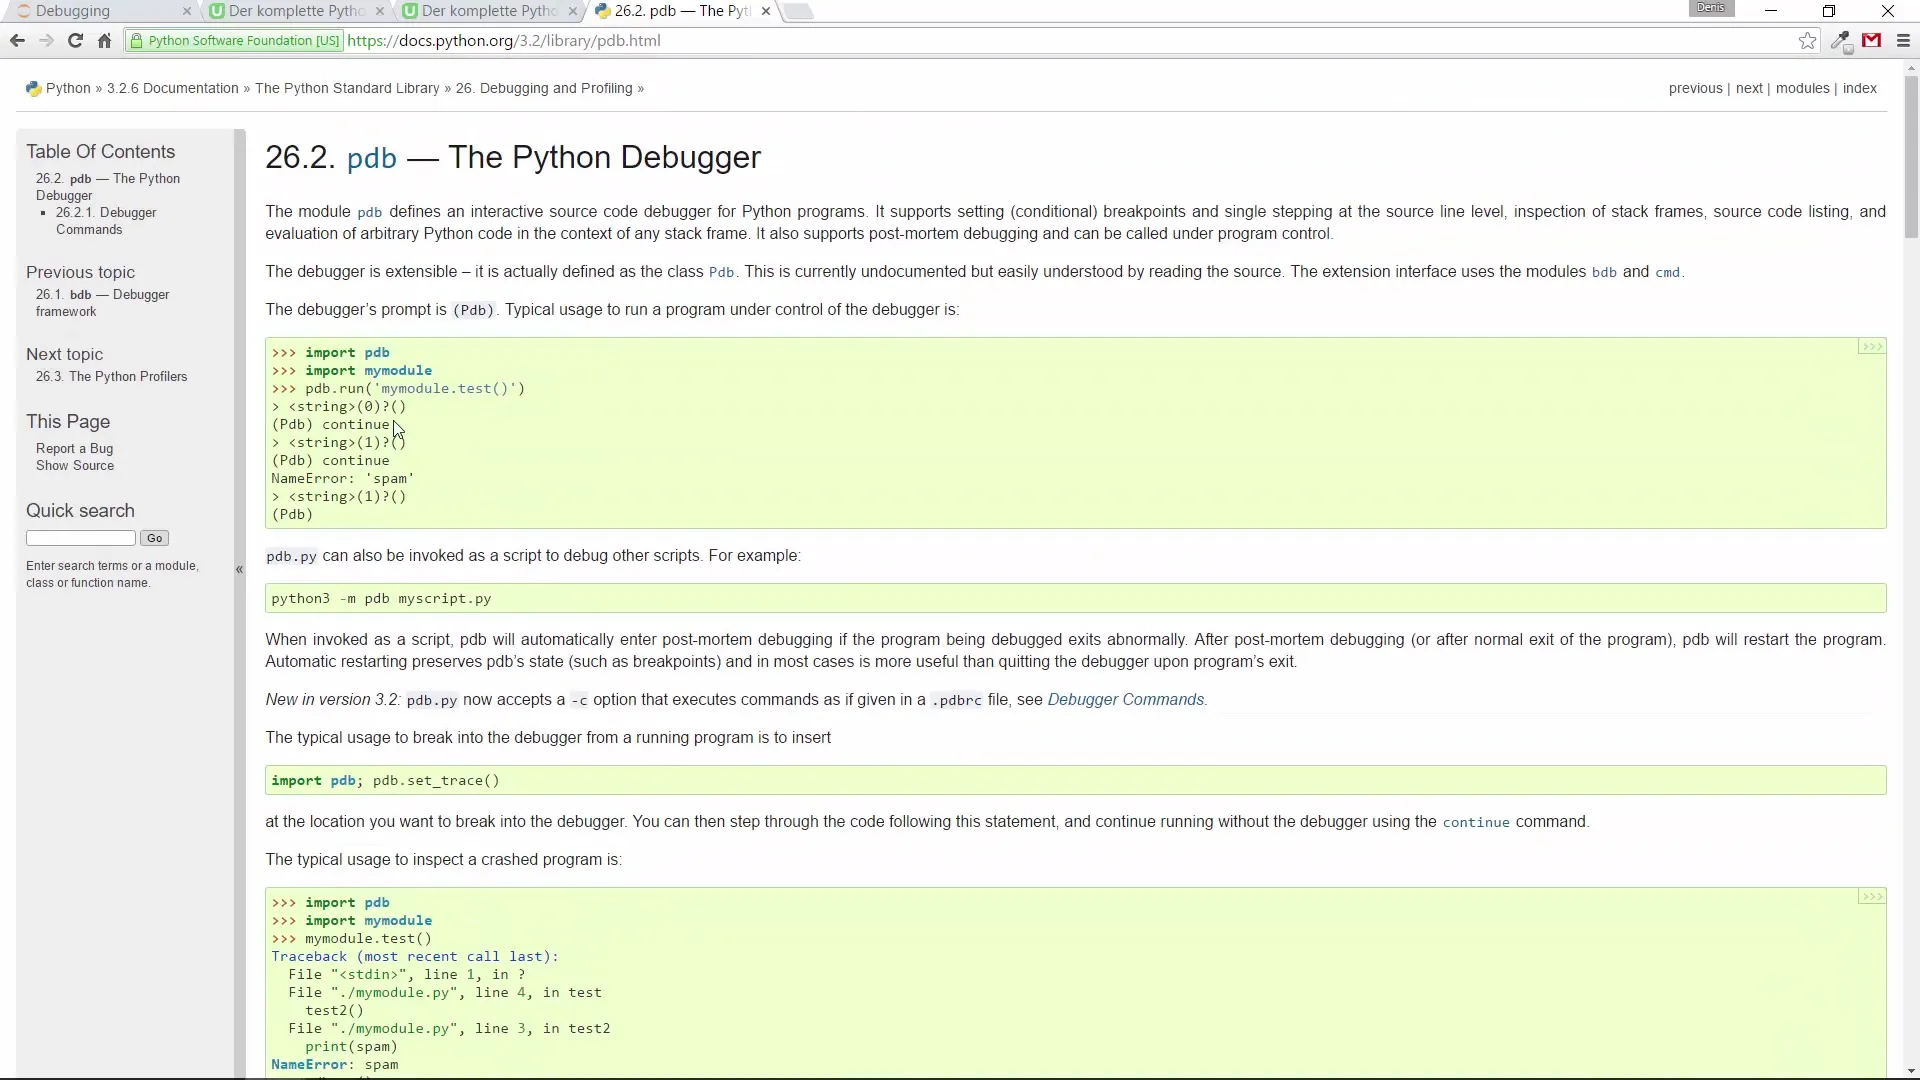
The PDB debugger offers many more functionalities that you can read about in the official documentation. Particularly, the variety of interactive options makes this tool extremely useful. So check out what other features the module offers and how you can use them for your programs.
Ending the Debugging Process
Once you have gathered all the necessary information, you can end the debugging process and continue with the next part of your code. Remember that you can use pdb.set_trace() at any time to pause the execution of your program at a specific point and inspect the variables.
Summary
With the PDB debugger, you have a powerful tool at hand to facilitate troubleshooting in your Python projects. Using pdb.set_trace(), you can interrupt the code, inspect variables, and check the current state of the program. These techniques are particularly useful when working on more complex applications and wanting to maintain oversight.
Frequently Asked Questions
What is PDB?PDB is the Python debugger that allows you to perform debugging of Python code.
How do I import the PDB module?You import PDB by placing import pdb at the beginning of your script.
What does the function pdb.set_trace() do?This function allows you to pause the execution of the code and inspect the current variable values.
Can I perform calculations in the debugger?Yes, you can execute commands and inspect variables at any time while in the debugger.
Where can I find more information about the PDB module?You can find more information in the official Python documentation at doc.python.org.
