Livestreaming is an indispensable tool for content creators, streamers, and companies to connect with their audience. But how can you ensure that your livestream reaches the desired audience and is successful? The key lies in the right analyses. In this tutorial, you will learn how to analyze and interpret the most important metrics for livestreams on YouTube in order to improve your performance. We will examine the different aspects of YouTube Analytics and find out what steps you can take to promote the growth of your livestreams.
Key Findings
To maximize the success of your livestreams, you should keep an eye on the click-through rates, average watch time, and concurrent viewer numbers. With these metrics, you can assess how well your stream is resonating with your audience and identify areas for improvement. Experiment with thumbnails, content, and presentations to enhance your statistics.
Step-by-Step Guide
Step 1: Access YouTube Analytics
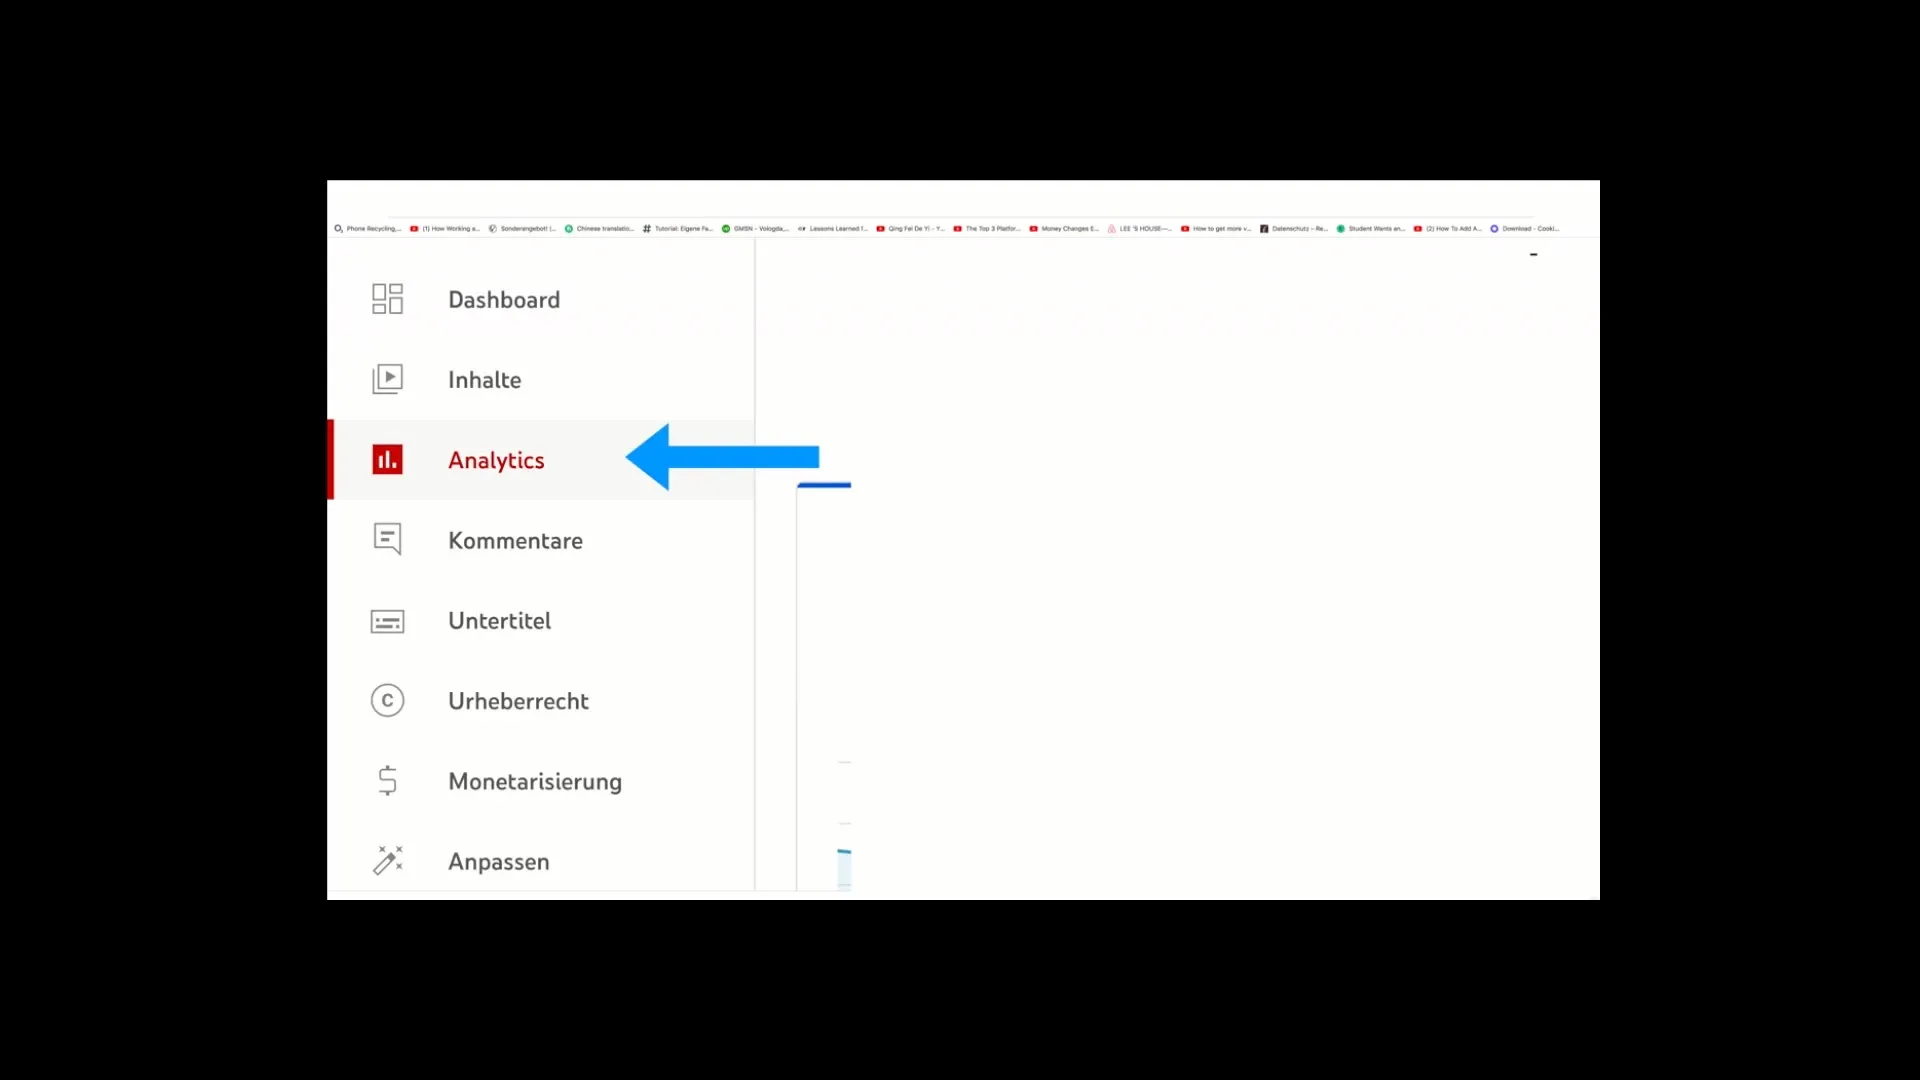
To analyze the data of your livestreams, you first need to access the YouTube Studio. To do this, go to the top right corner of YouTube and click on your profile picture. Then select "YouTube Studio." In the left menu, you will find the "Analytics" tab. Click on it, and you will be redirected to your channel analytics.
Step 2: Select Contents
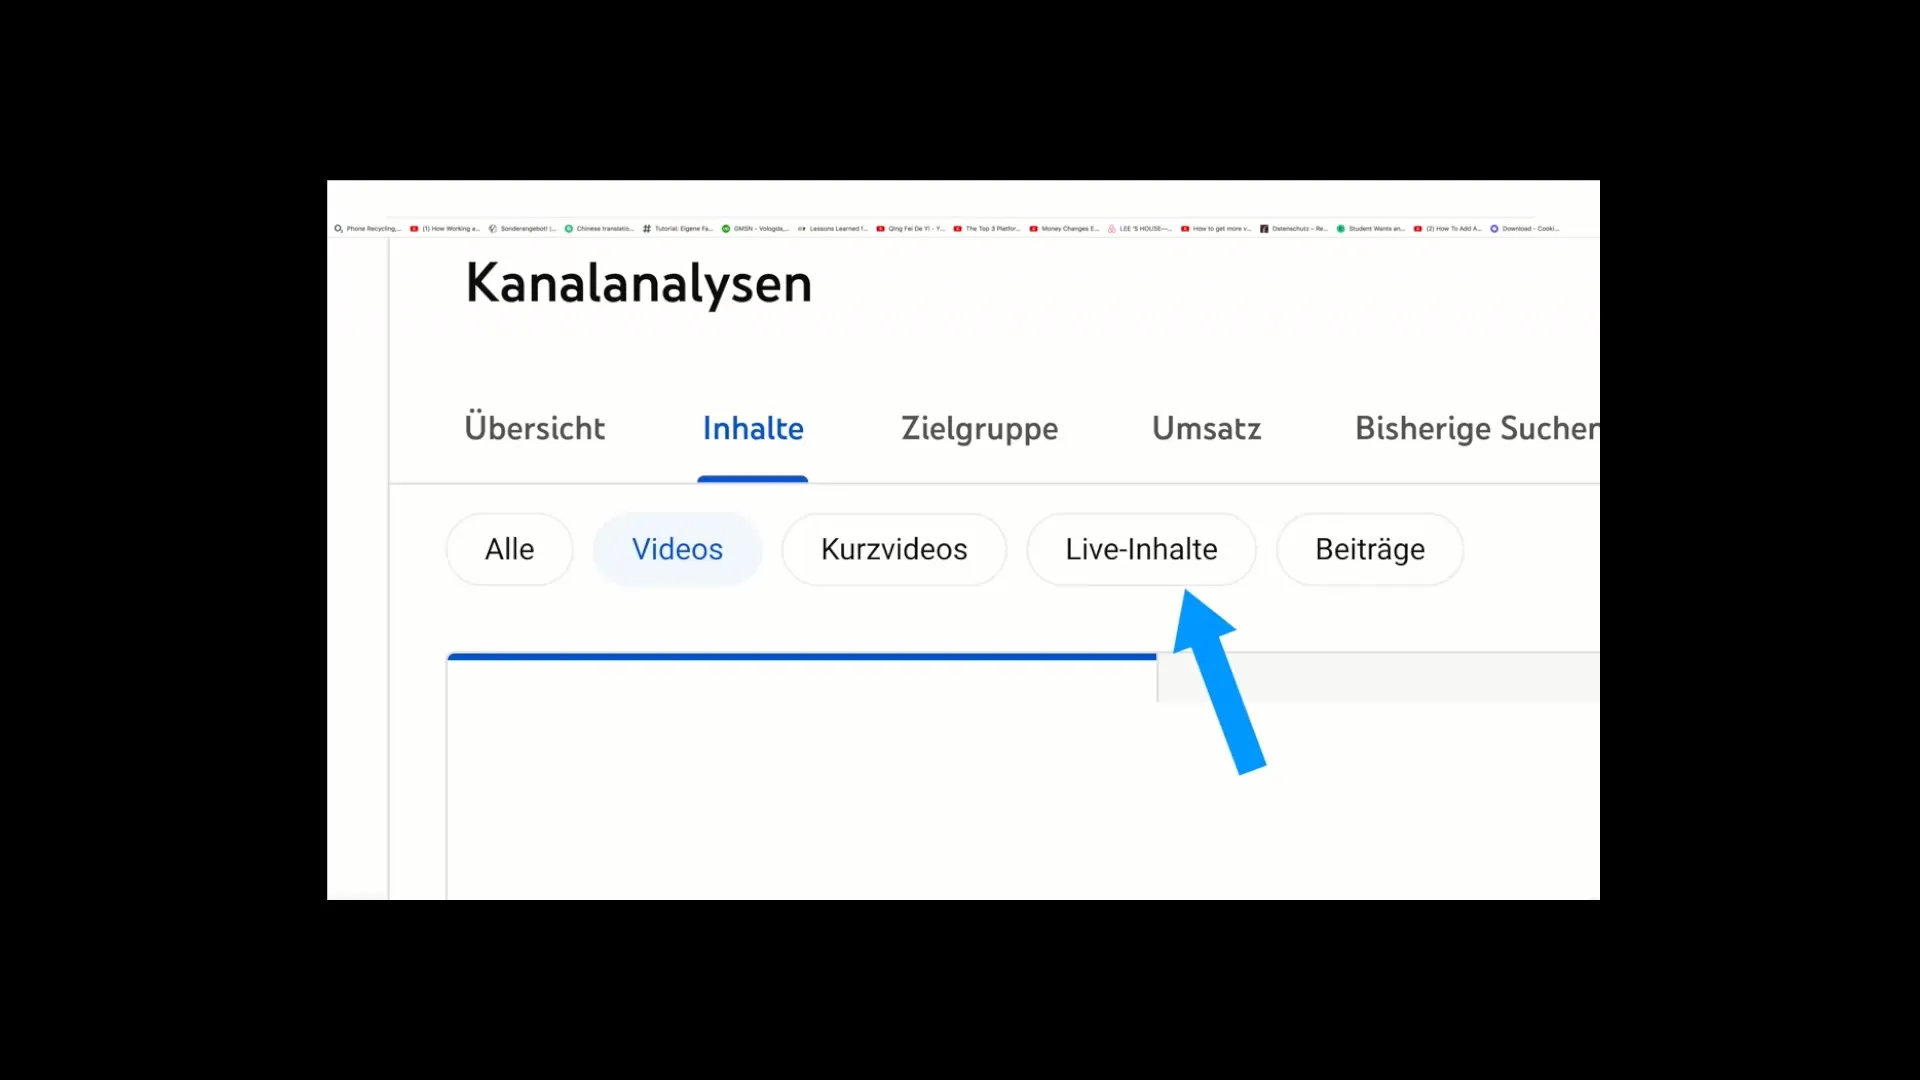
To see the specific data of your livestreams, click on the "Contents" tab at the top. At this point, you should then click on "Live Content" to view all livestreams that have already been conducted. You can analyze the performance of your livestreams over different periods, such as the last 28 days or the last 365 days.
Step 3: Identify Relevant Metrics
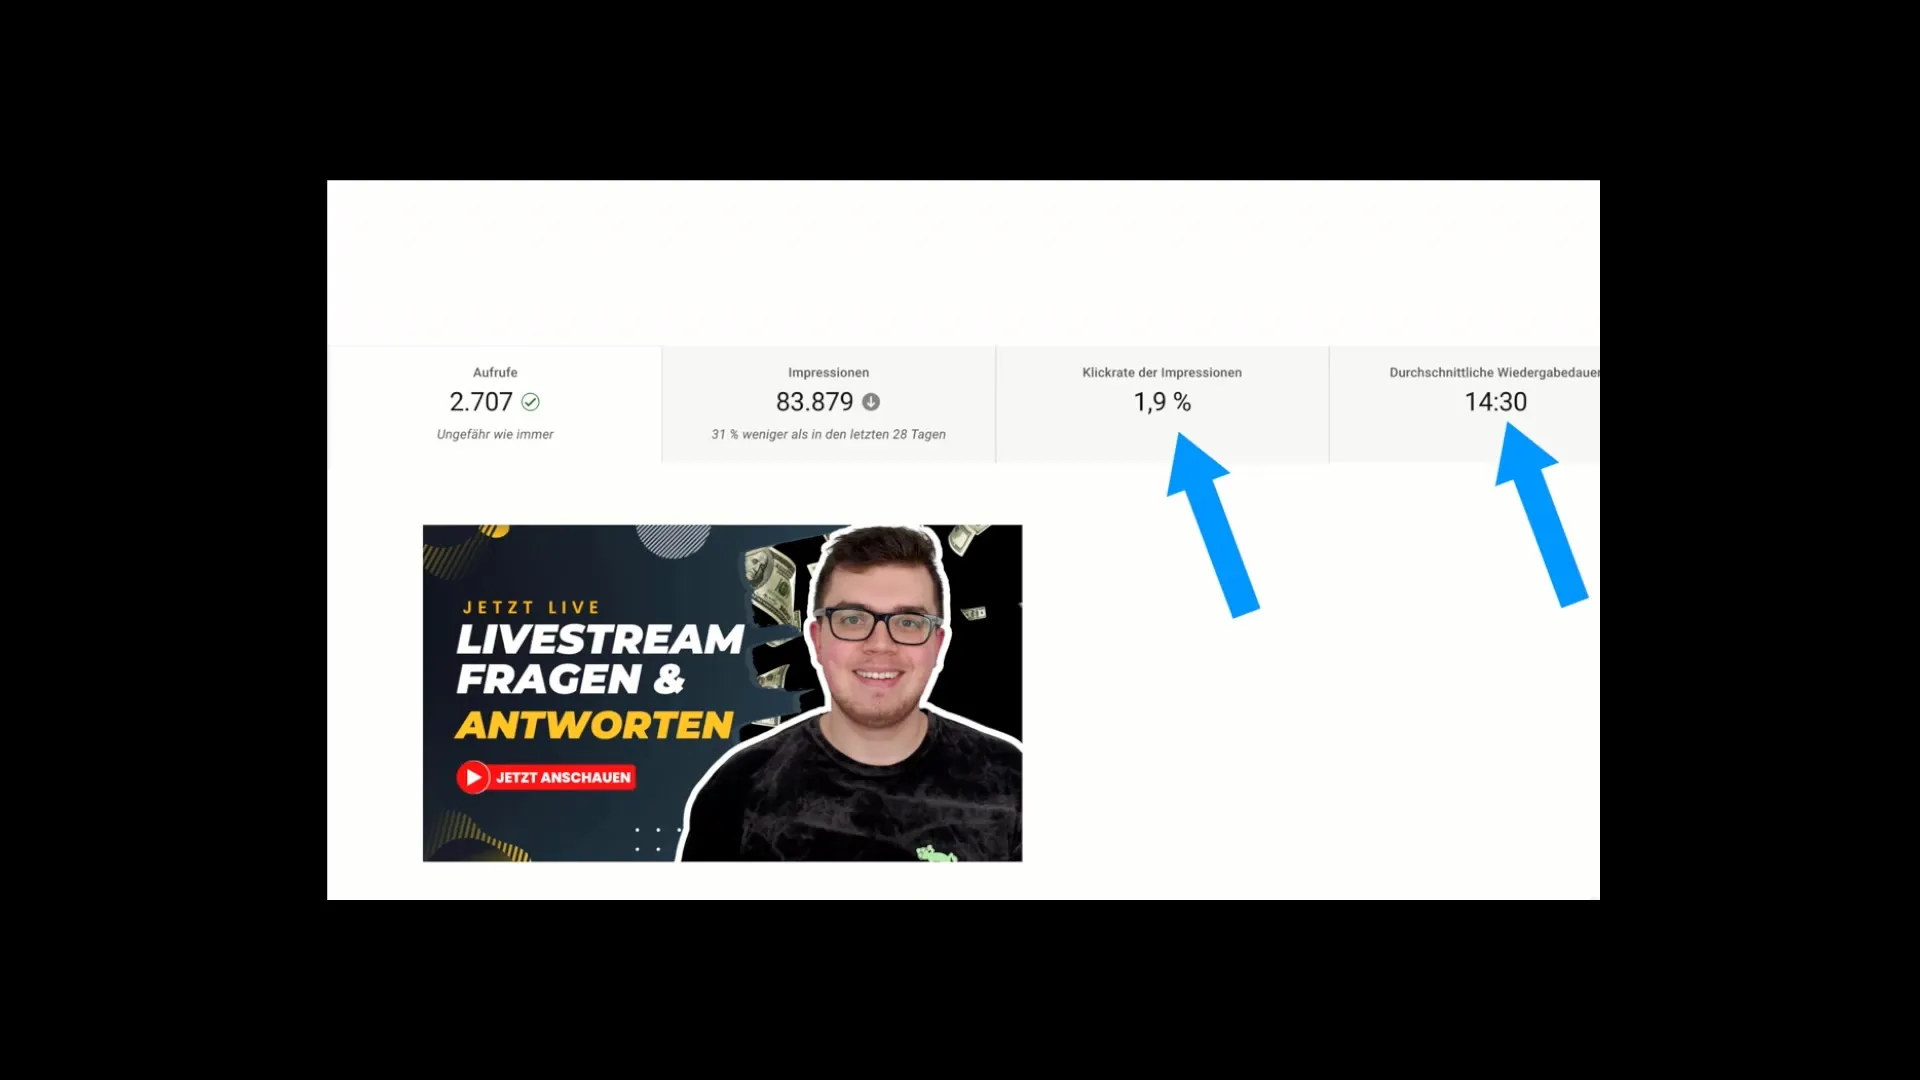
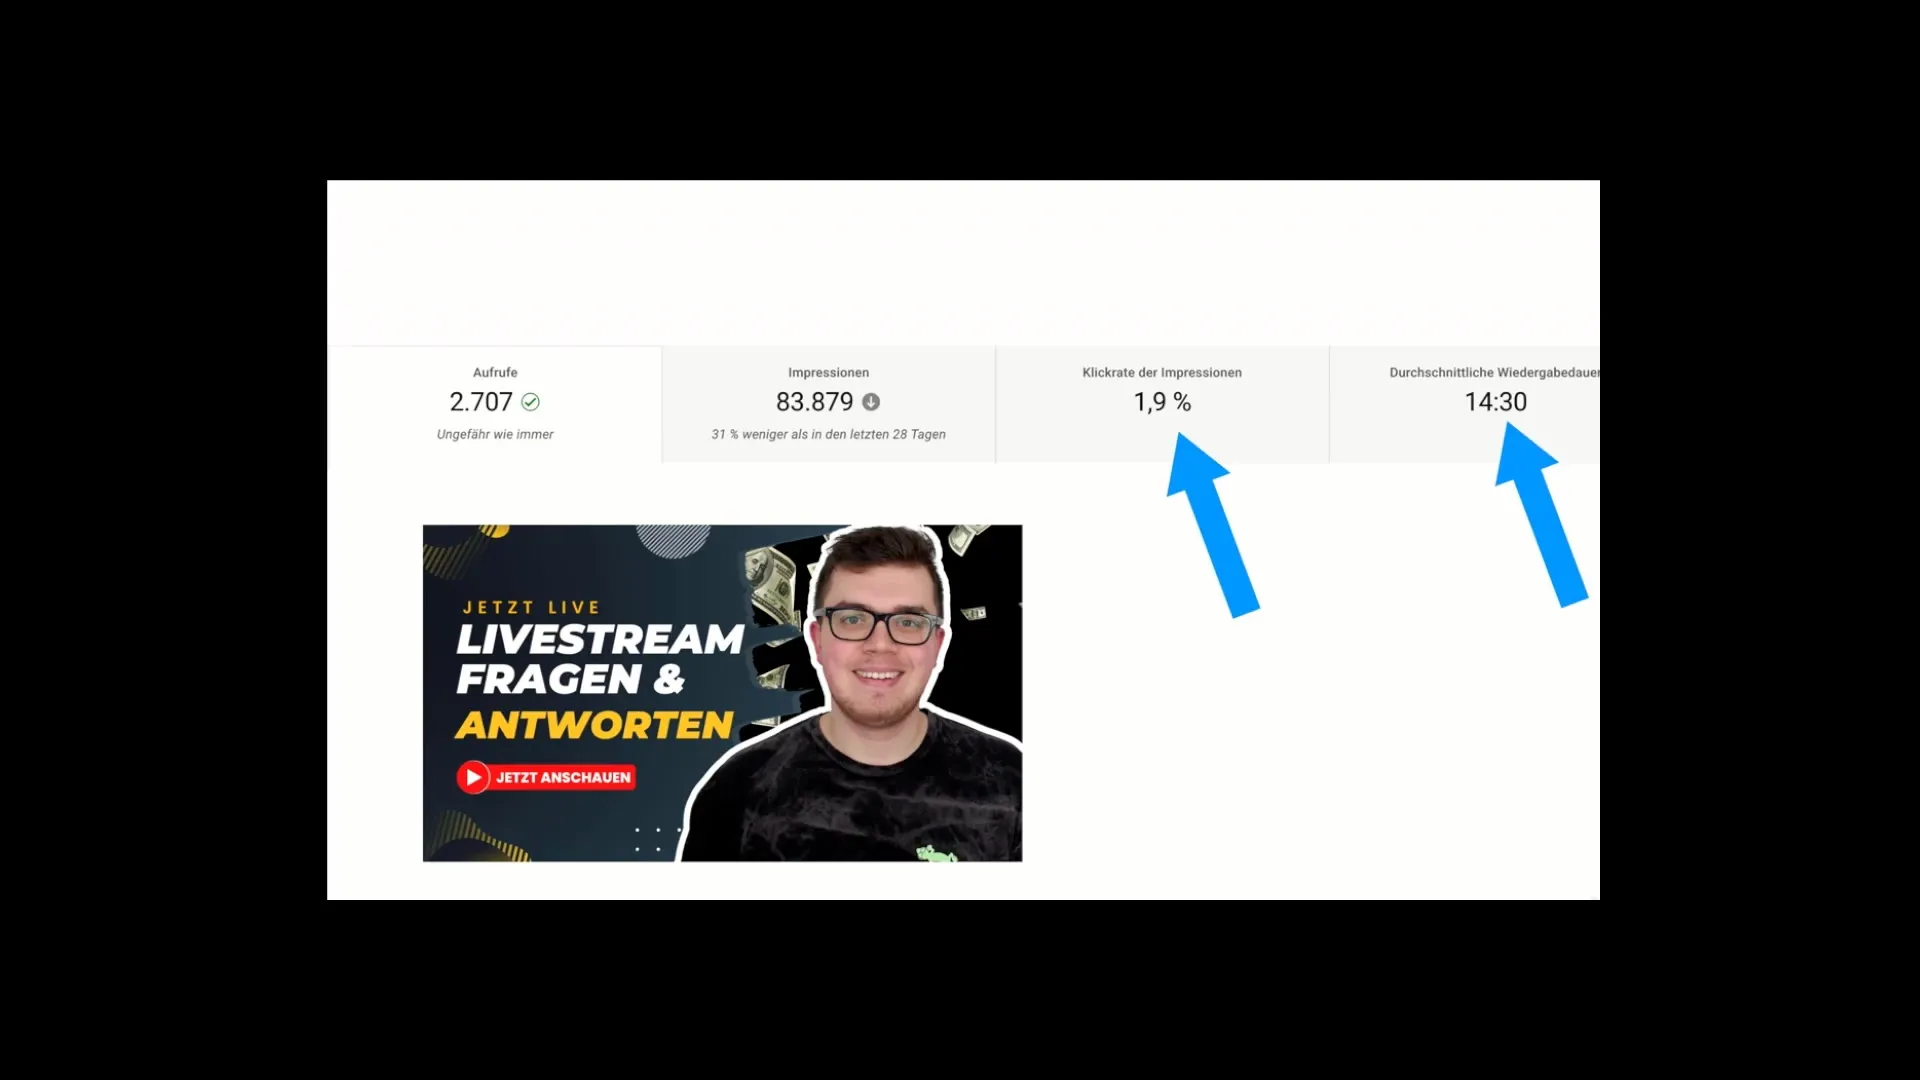
Once you have accessed the livestreams, it is important to identify the relevant metrics. An important point here is the click-through rate of impressions. A low click-through rate may indicate that your thumbnail or title is insufficient to pique viewers' interest. You should keep an eye on the click-through rates and the average watch time to gain insights into your stream's performance.
Step 4: Check Performance
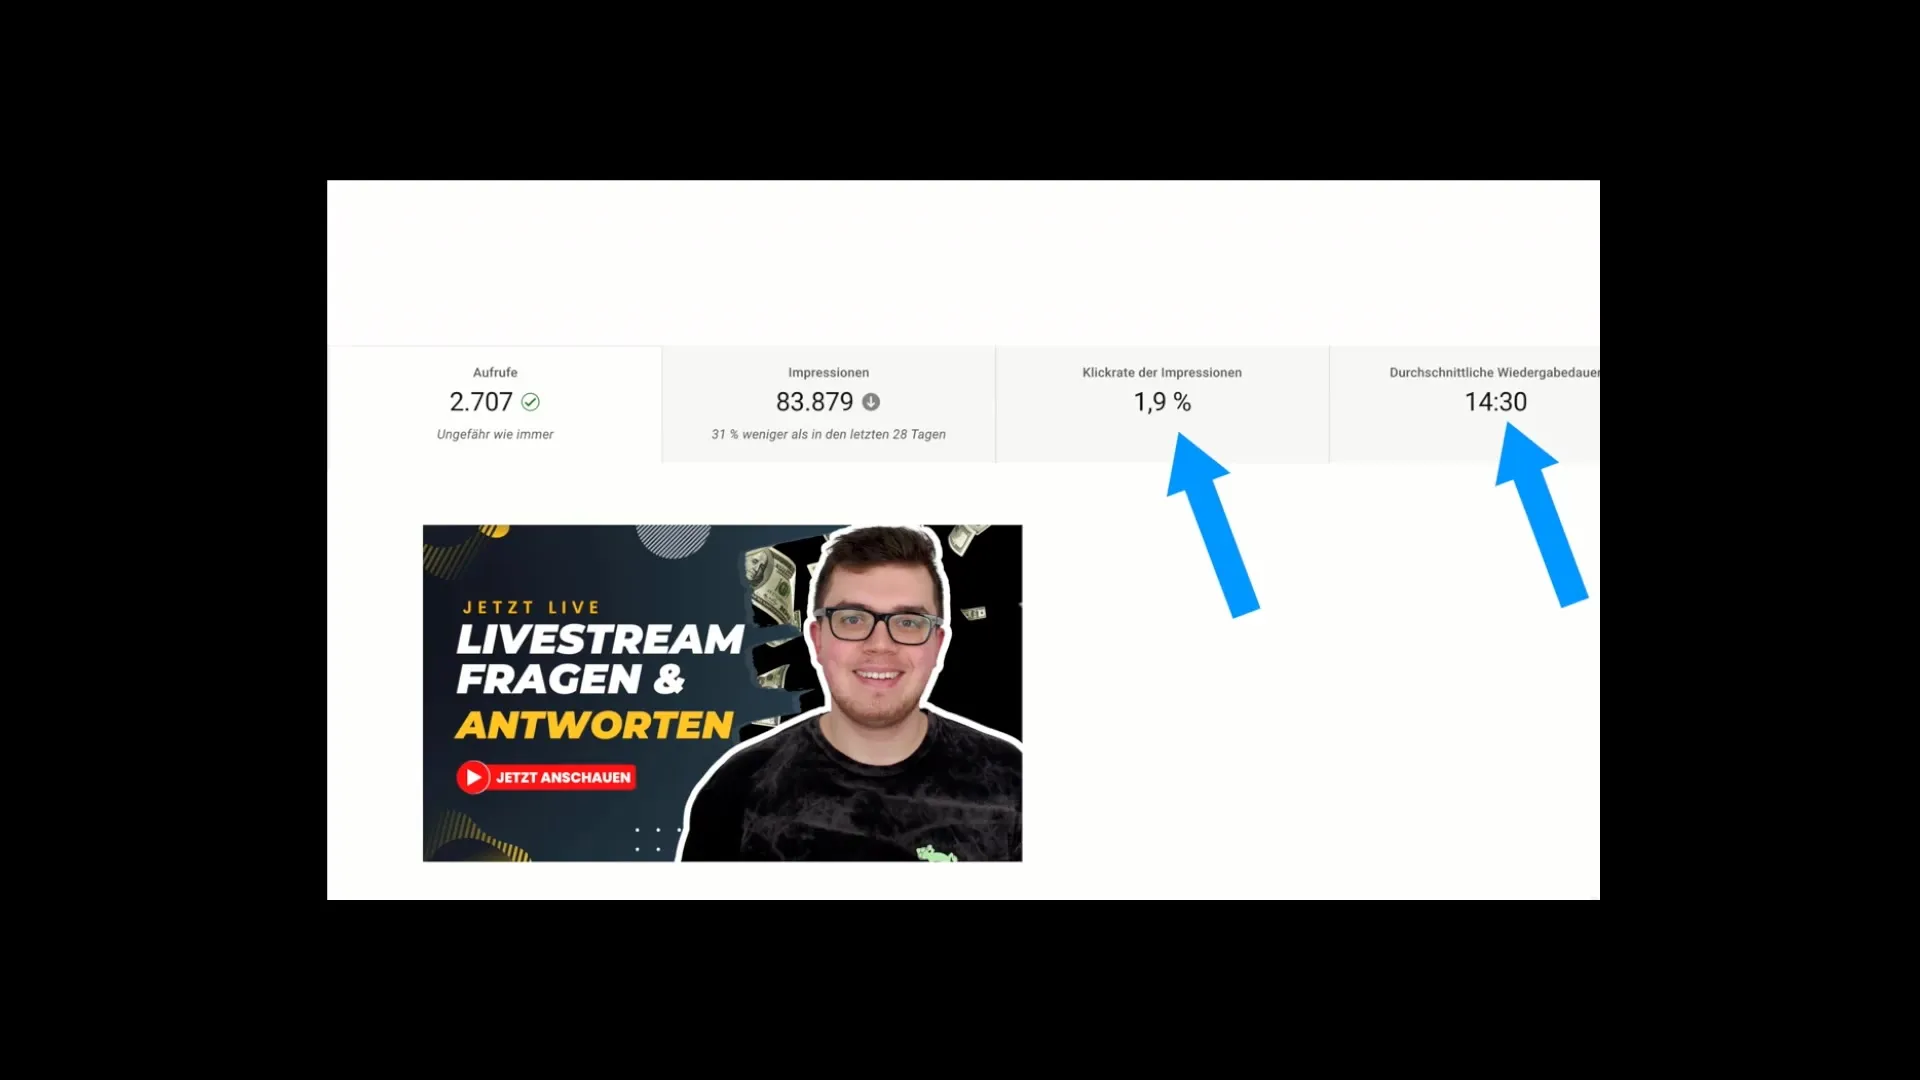
The key performance indicators (KPIs) that you should keep an eye on are the click-through rates of impressions and the average watch time. These two values provide insights into how well your livestream is performing. If the click-through rates are low, it could be a sign that you need to make changes to your thumbnail or title.
Step 5: Optimize Thumbnails and Titles
If you find that your click-through rates are poor, it is advisable to optimize your thumbnails and titles. Consider what type of titles or images could arouse viewers' curiosity. A/B testing is helpful here; upload a new thumbnail and monitor its performance over time to determine which one performs better.
Step 6: Adjust Contents
Think about how you can structure the first few minutes of your livestream to capture viewers' interest. An exciting opening or a presentation that leads directly to the topic can help keep viewers engaged longer. Increased engagement in the first few minutes will have a positive impact on your average watch time.
Step 7: Analyze Viewer Numbers
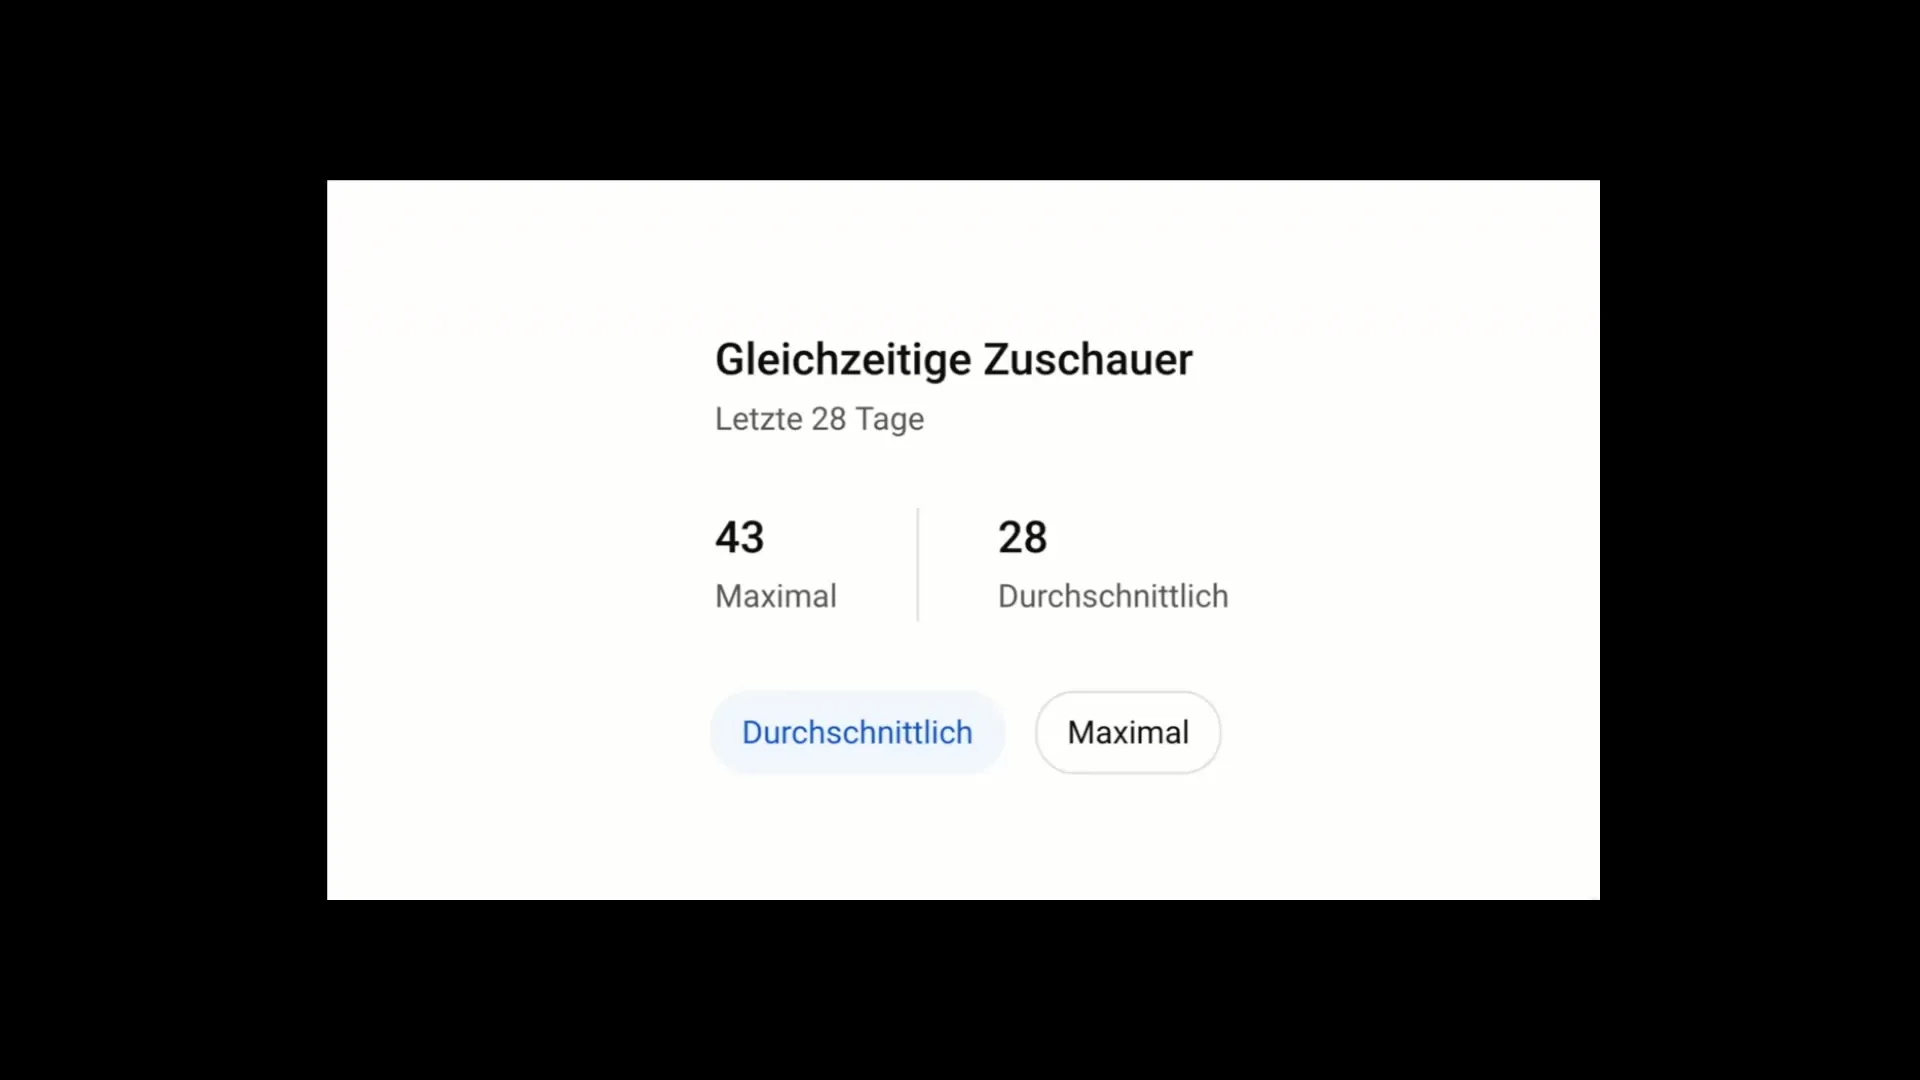
The simultaneous viewer count is another important indicator. Compare the max. viewer count with the average viewer count. A significant discrepancy could indicate that the content was not engaging for viewers. Ensure that the two values are not too far apart. Consistent viewer engagement is crucial for the success of your streams.
Step 8: Conduct Trend Analysis
After every livestream, you should conduct a trend analysis to check how your content is evolving. See if the number of viewers is increasing or decreasing, and then adjust your content, presentation, and even promotion to achieve better results.
Summary
In this tutorial, you have learned which key figures are essential for analyzing livestreams. You have found out how to access your YouTube Analytics, evaluate relevant data, and what you can do to improve your performance. By working on thumbnails, titles, and content, you can significantly increase your number of viewers. Make sure to make adjustments and regularly monitor your statistics to fully maximize the potential of your streams.
Frequently Asked Questions
How do I access YouTube Analytics?You need to click on your profile picture, then on YouTube Studio, and then on the "Analytics" tab.
What are the key KPIs for livestreams?The key KPIs are the click-through rates of impressions and the average watch time.
How can I improve my click-through rates?Optimize your thumbnails and titles to pique viewers' interest.
How can I increase the average watch time?Make the first few minutes of your stream interesting and engaging to retain viewers long-term.
Why is the concurrent viewers number important?A large discrepancy between the maximum and average number of viewers can indicate unappealing content.


