In this guide, you will learn how to effectively use the revenue display in Shopify. This feature is essential for gaining insights into your e-commerce success. You will learn how to create and analyze reports to track your shop's total revenue. This will enable you to make strategic decisions for your business and optimize your sales.
Key Takeaways
- The revenue display gives you important insights into your total revenue and activities in your store.
- You can create specific reports for different time periods and export them for further analysis.
- Analyzing the data allows you to take targeted actions to improve sales figures.
Step-by-Step Guide
Let's start by accessing the revenue display in Shopify.
You log into your Shopify account and navigate to the dashboard. Here, you will see an overview of your current revenue. At the beginning, we see that the total revenue is €29, which is the value of a previously placed order. This information helps you keep track of your sales.
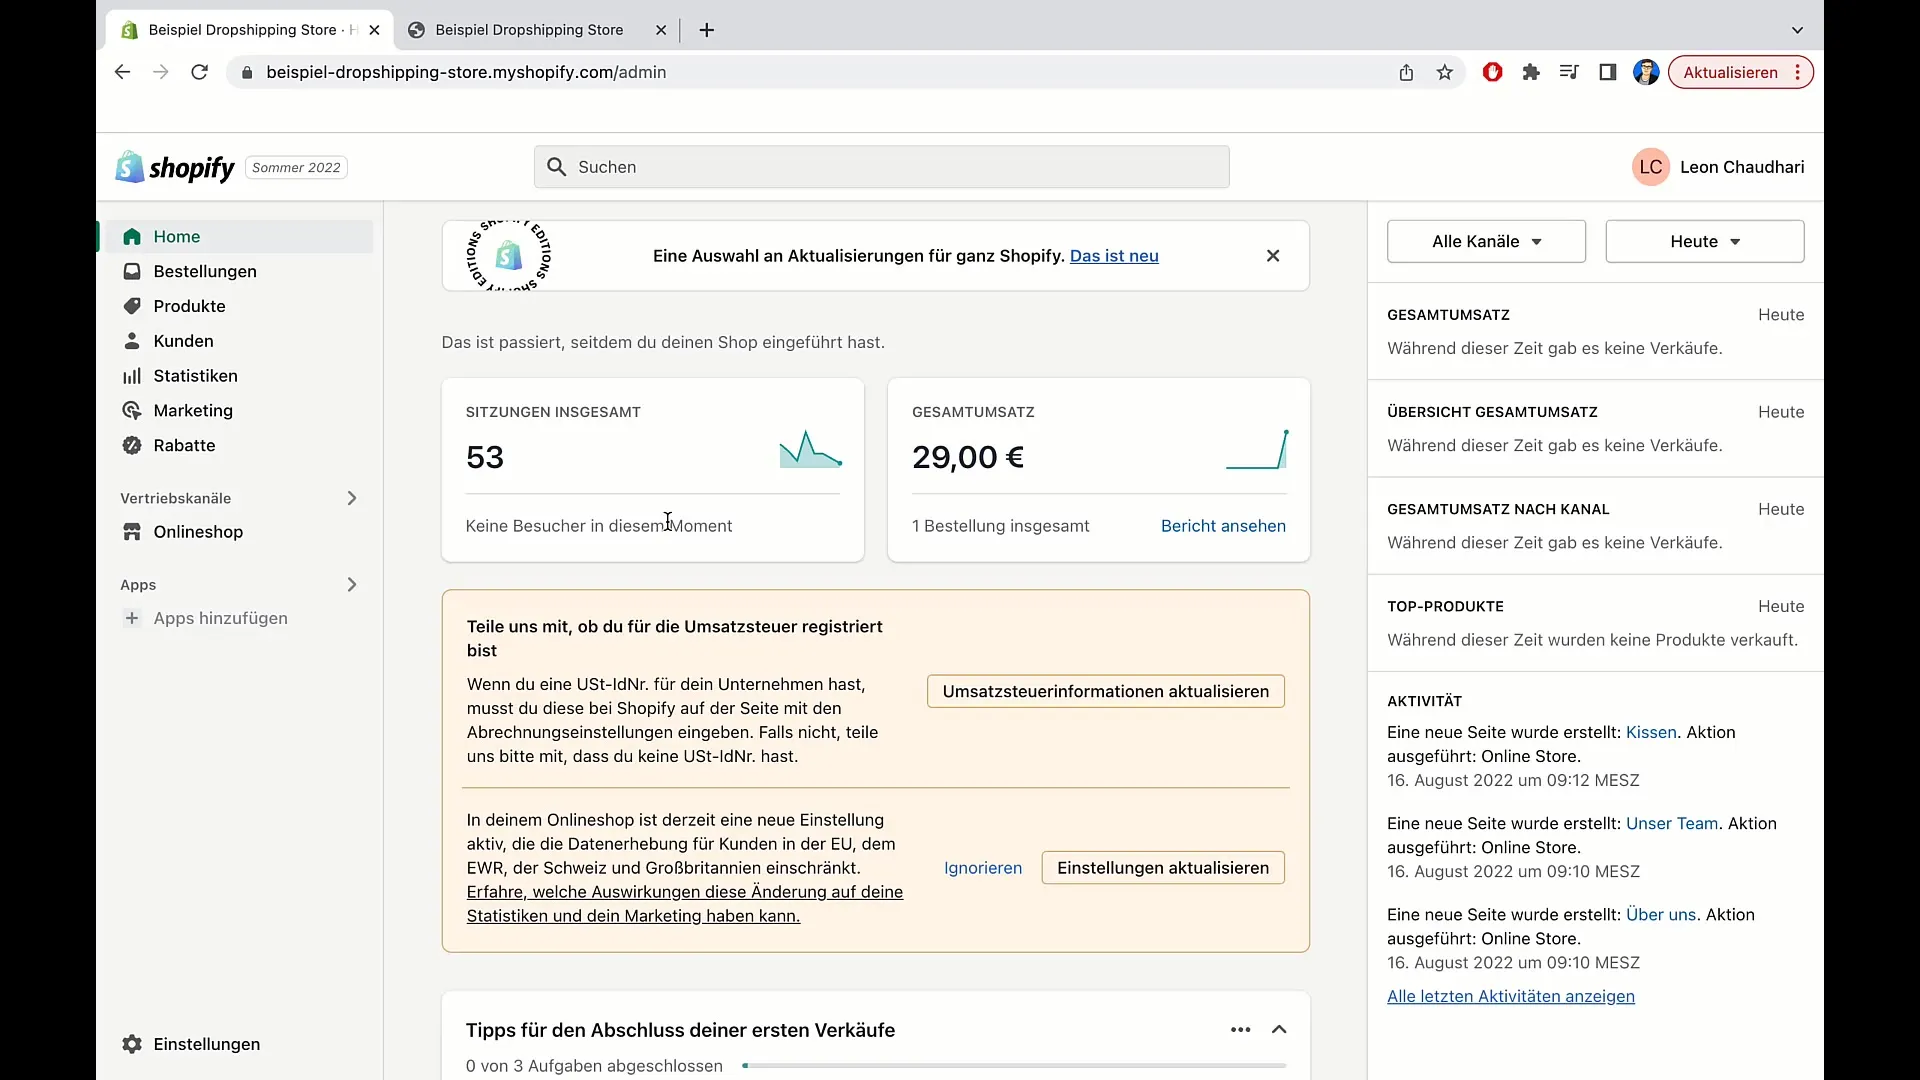
Once you are on the dashboard, you can scroll down to find more details. It is important to monitor the session to see how many people are on your shop. In this example, we have 53 sessions. This indicates that your shop is actively visited, which is a good basis for revenue.
To learn more about your revenue, click on the total revenue. This will take you to a more detailed report. Here, you can also explore the statistics section, which provides valuable information.
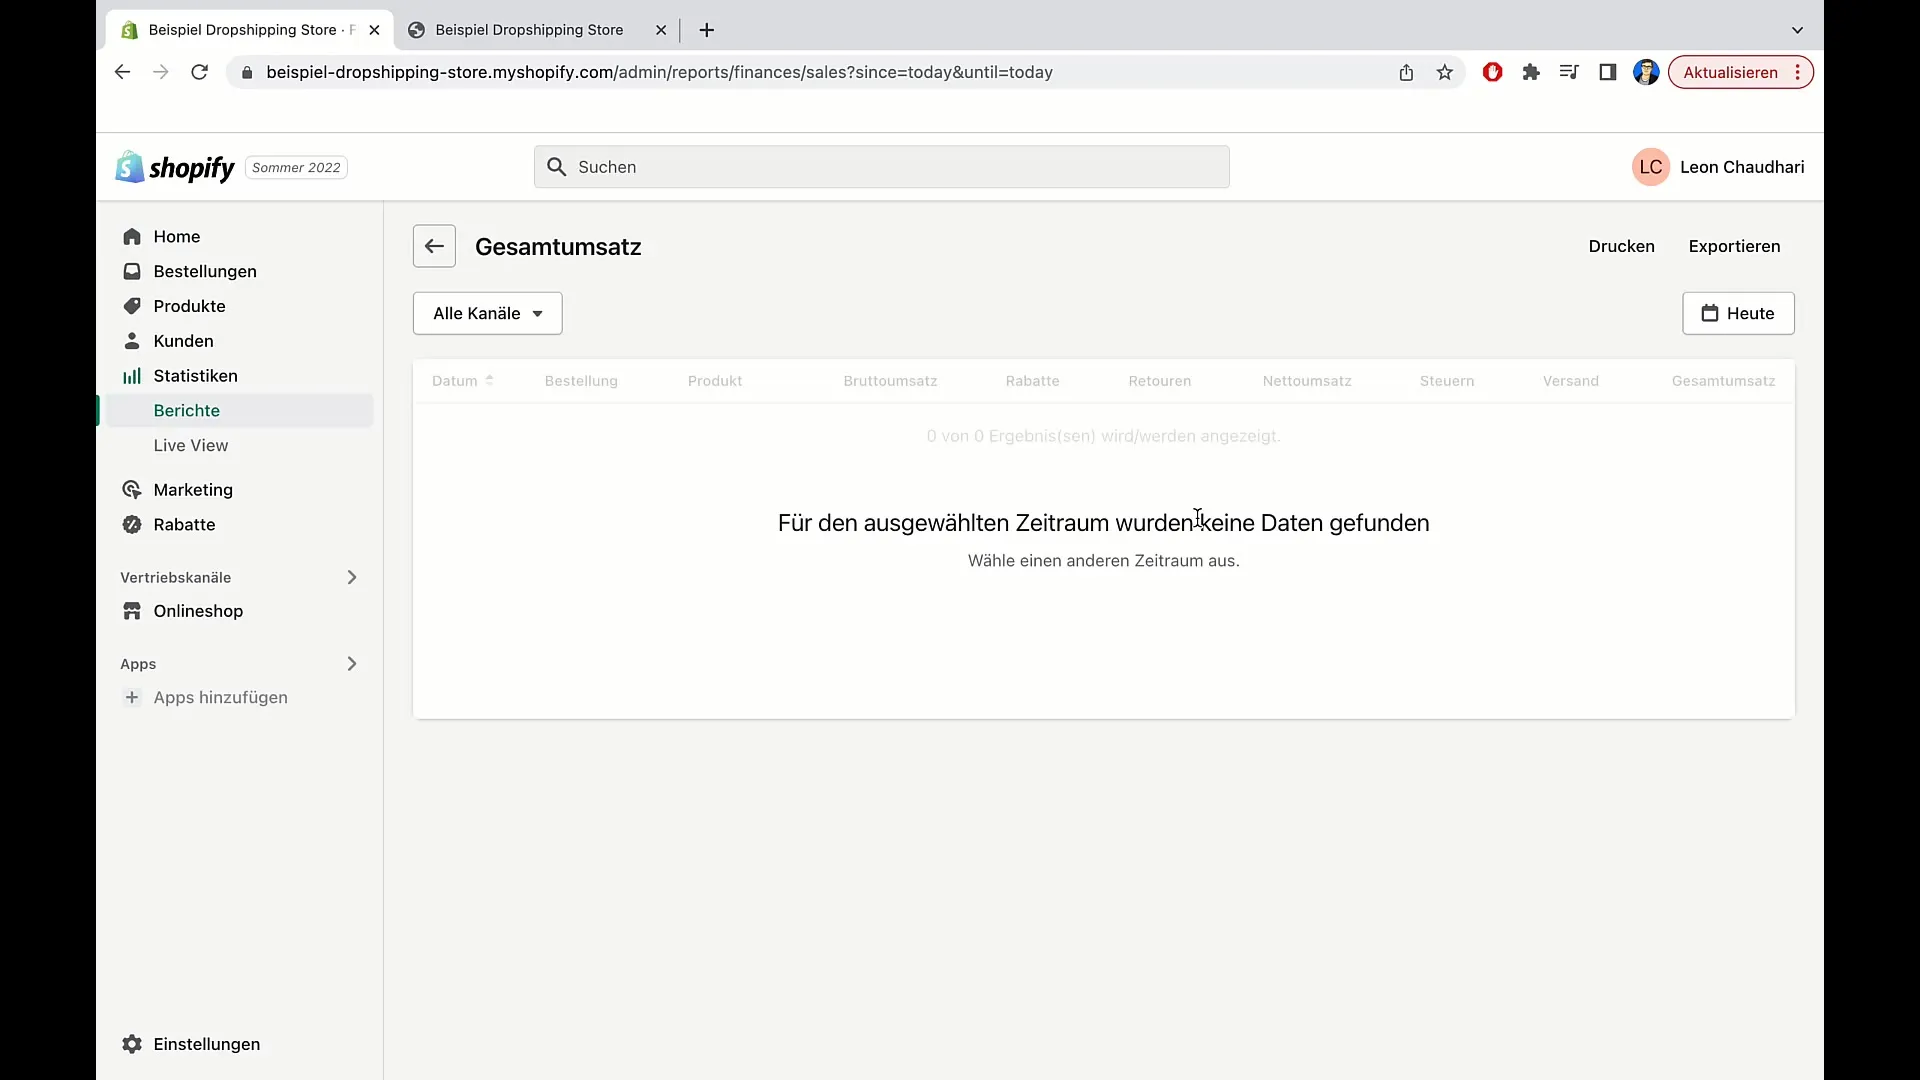
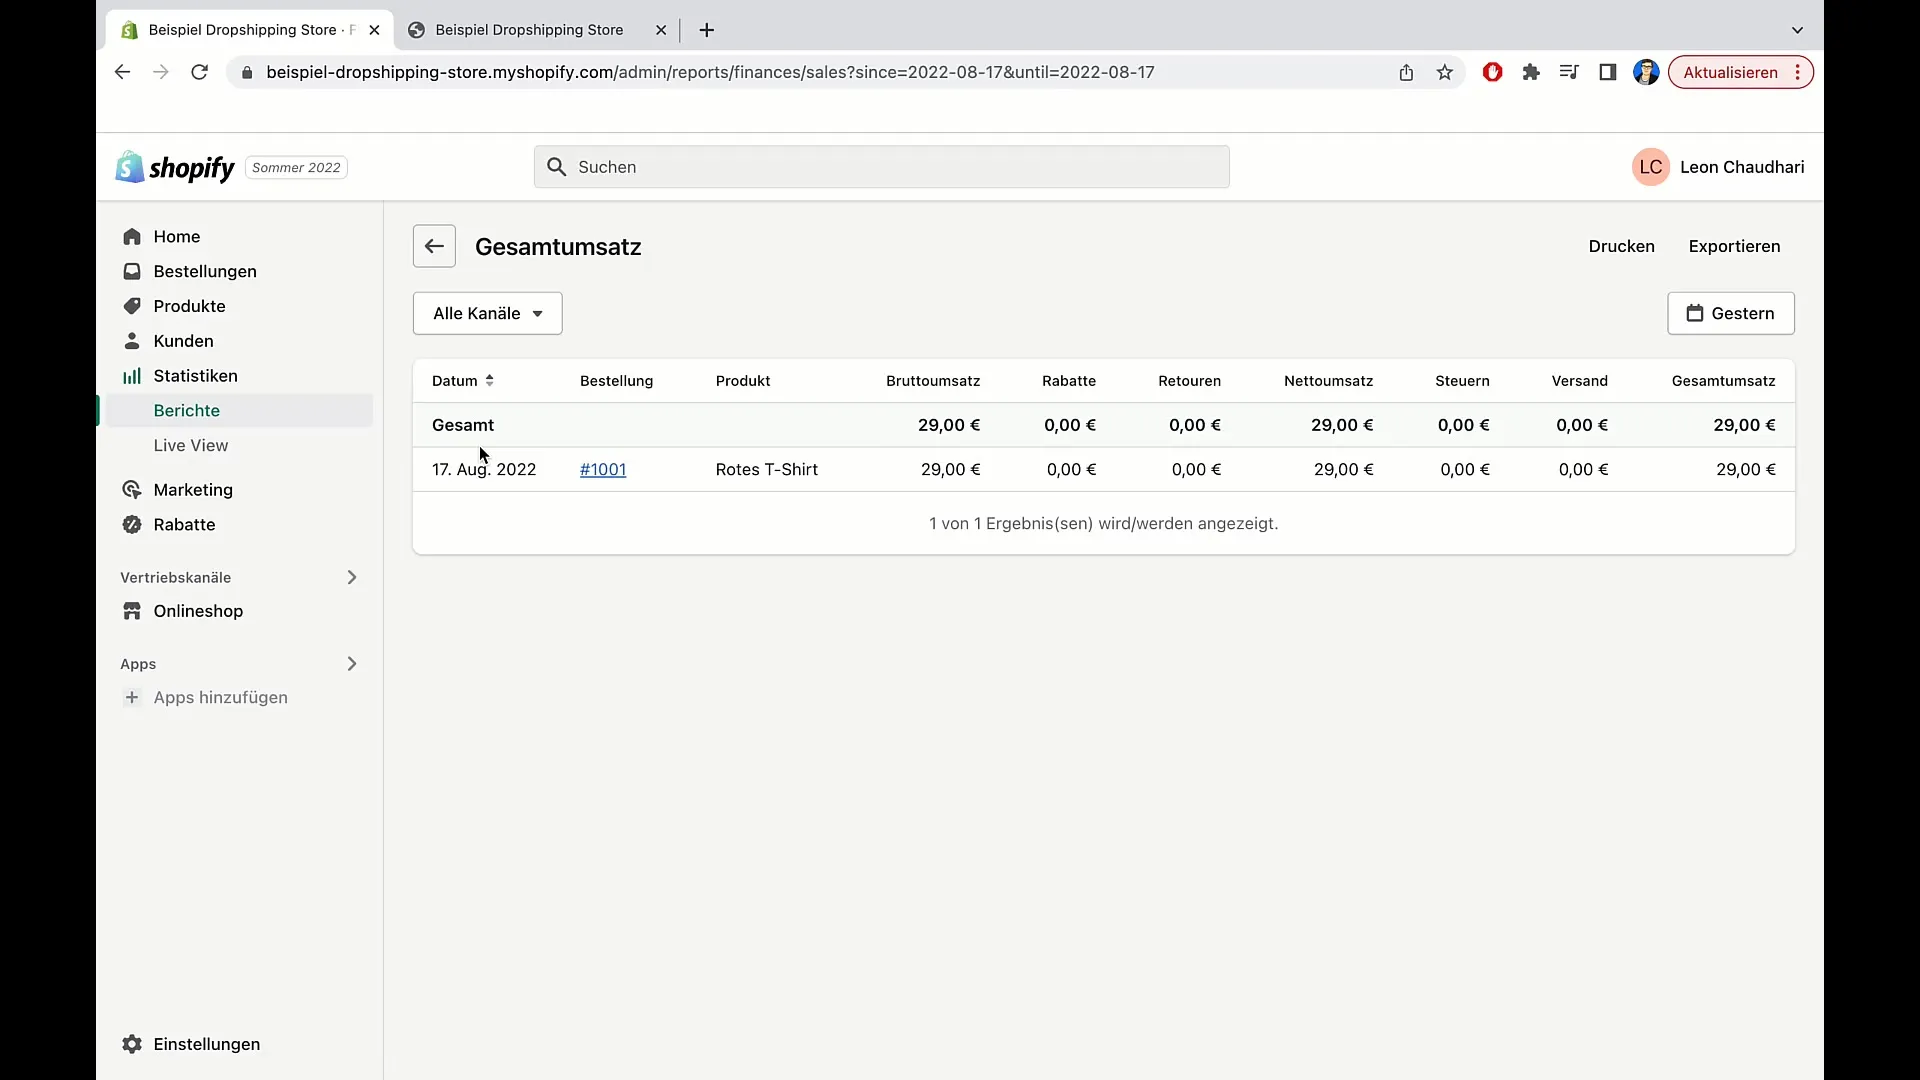
In the statistics section, you can select specific time periods to better analyze the revenue data. For example, you can query the revenue for the previous day. Click on "Yesterday" and then "Apply." You will now get an overview of how many orders you have generated. In our case, we have an order of €29 with no discounts or returns.
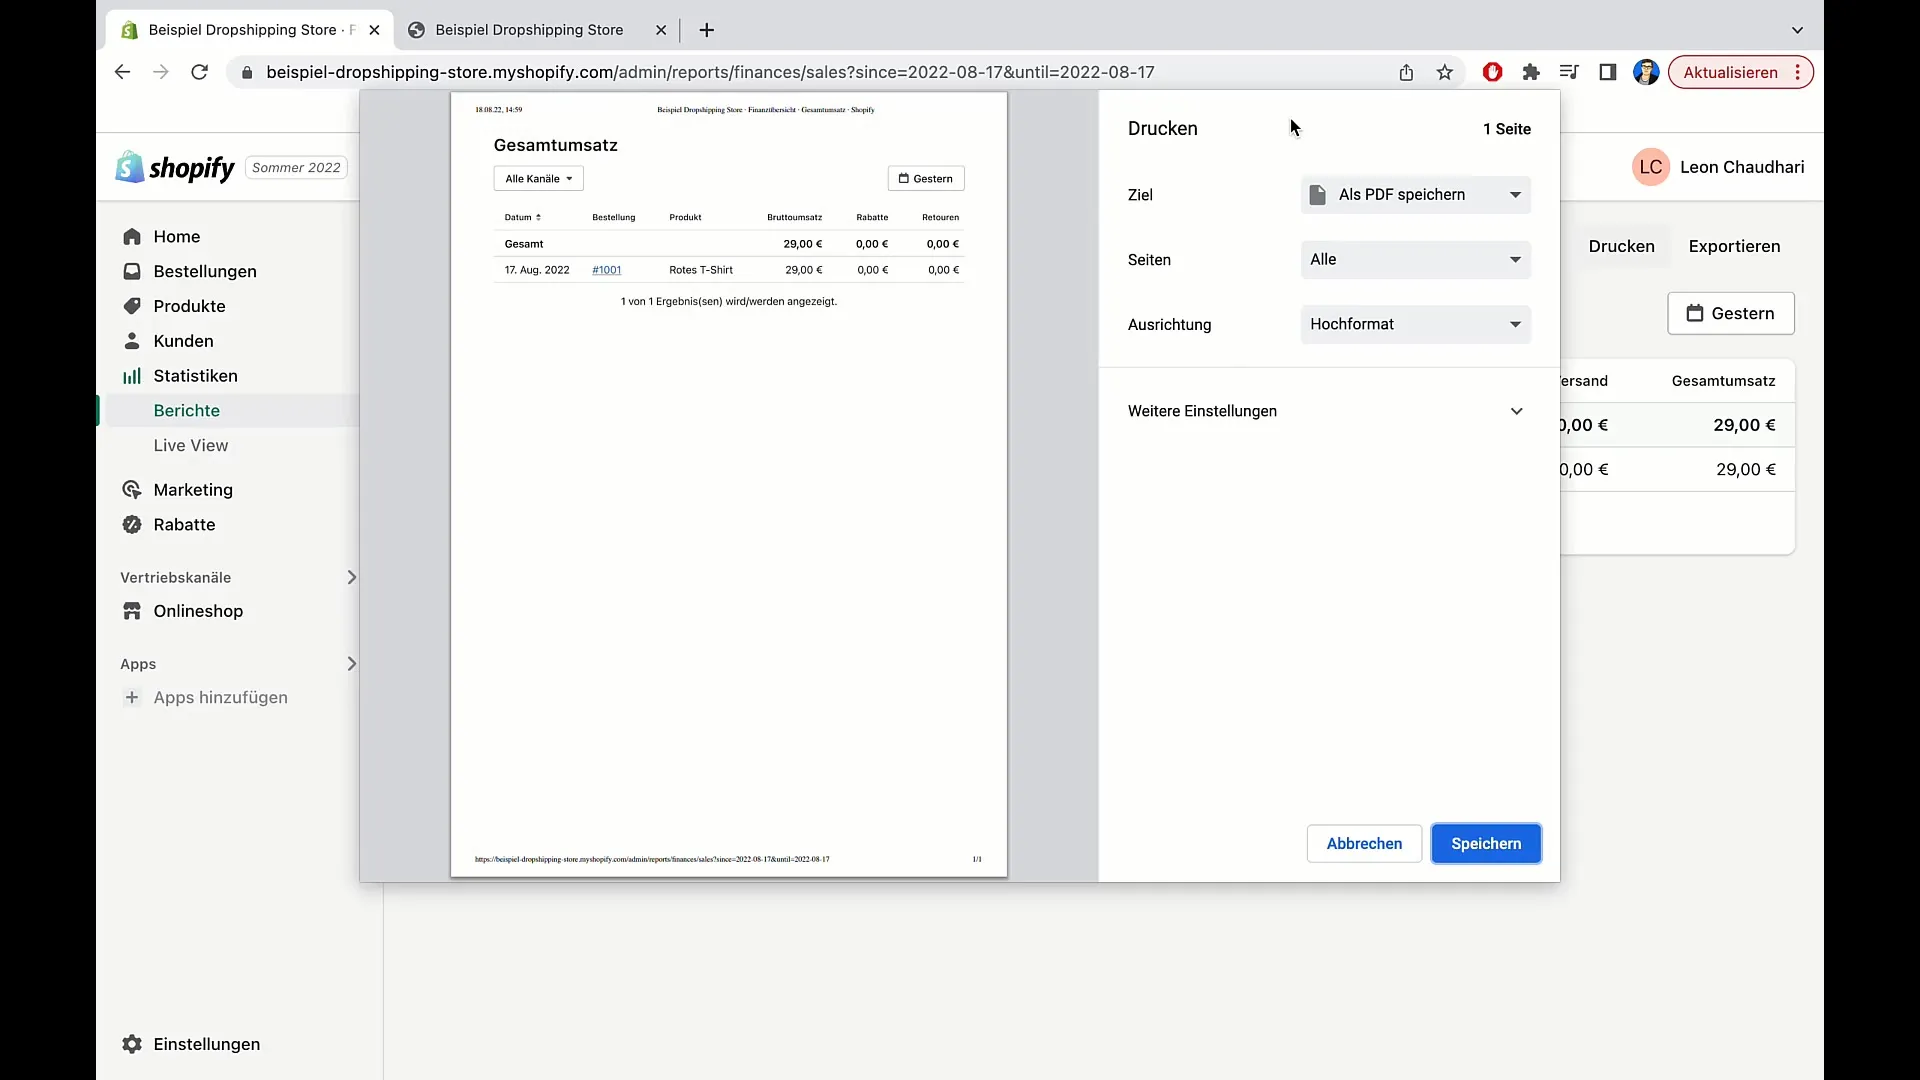
You also have the option to print this report or save it as a PDF. Click on "Print" to get a physical copy, or choose the "Save as PDF" option to archive the overview digitally.
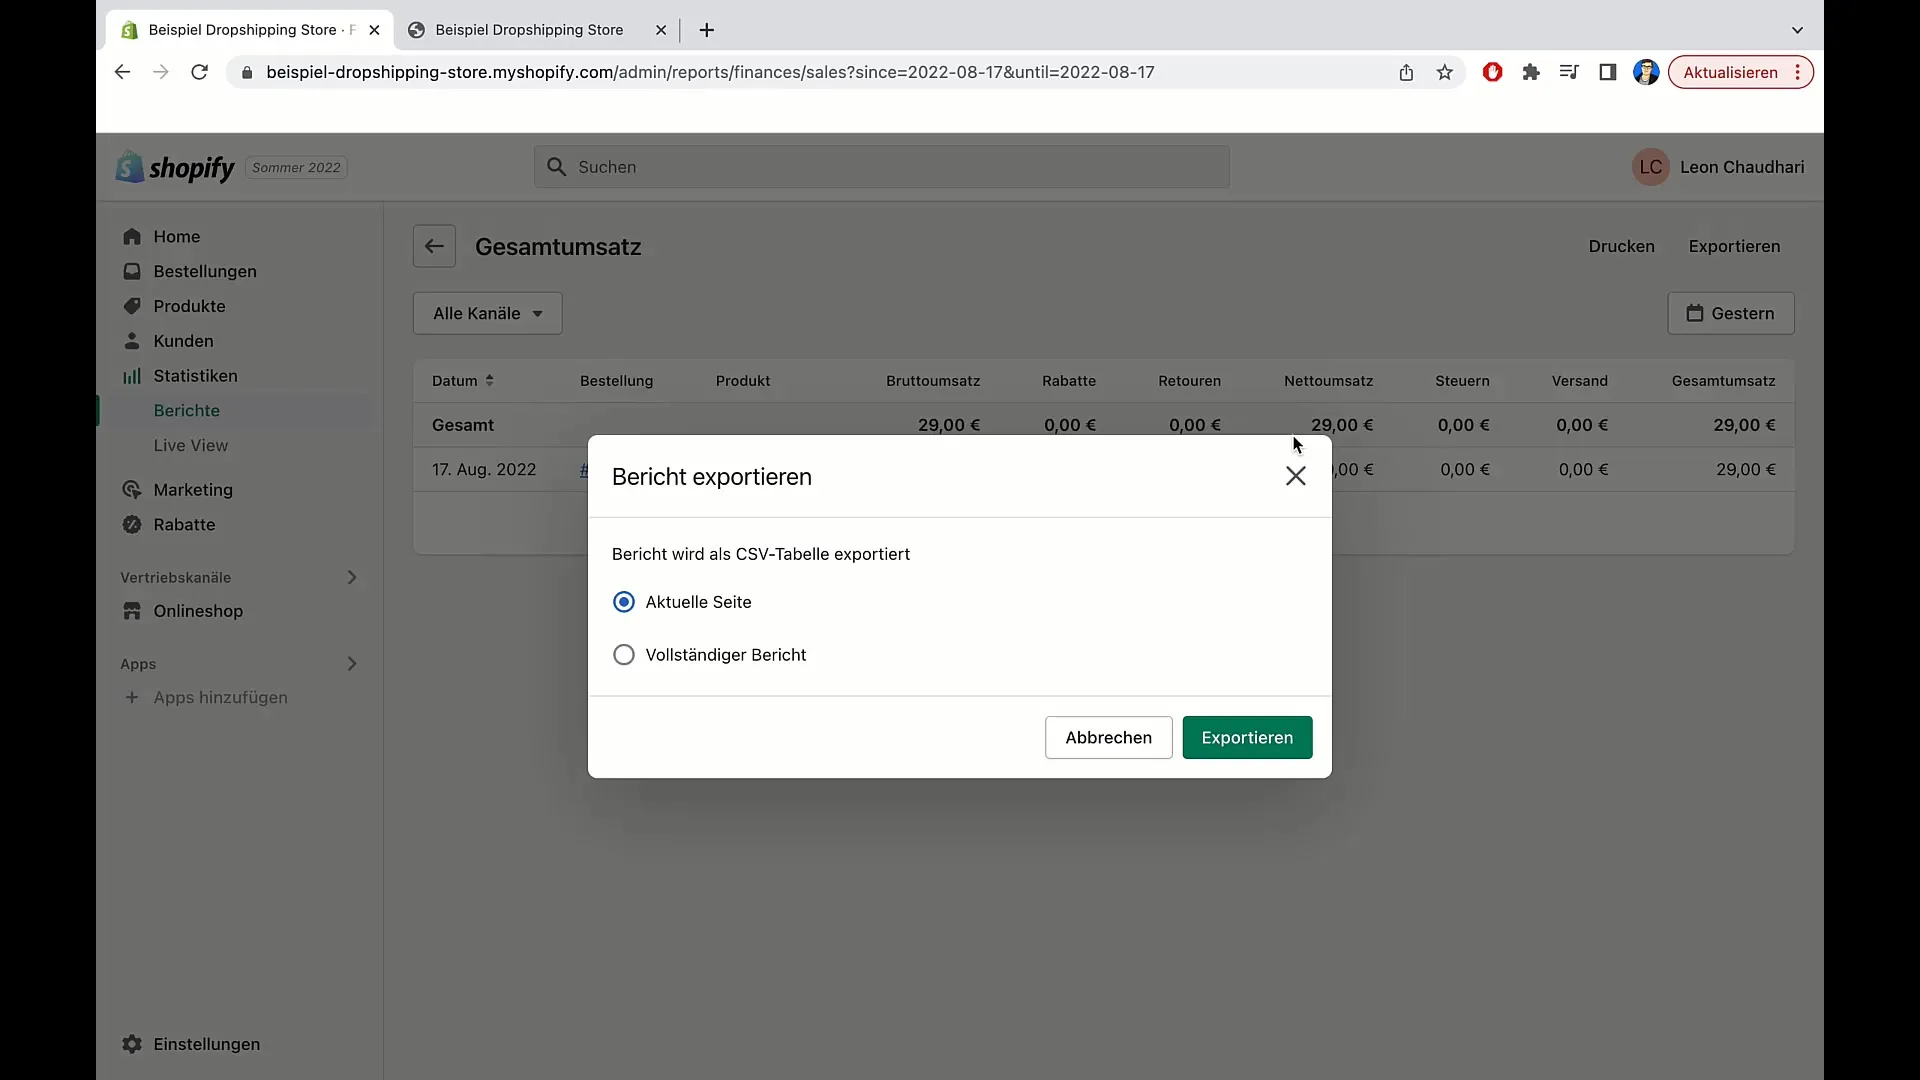
Another useful feature is the export function. Here, you can export the revenue data as a CSV file. Click on "Export" and choose the desired option. You can decide whether to export only the current page or a full report.
If you need more sales data, you can also use the live view. Here, you can see current visitors and their activities on your website. This is useful for getting a real-time sense of purchasing behavior.
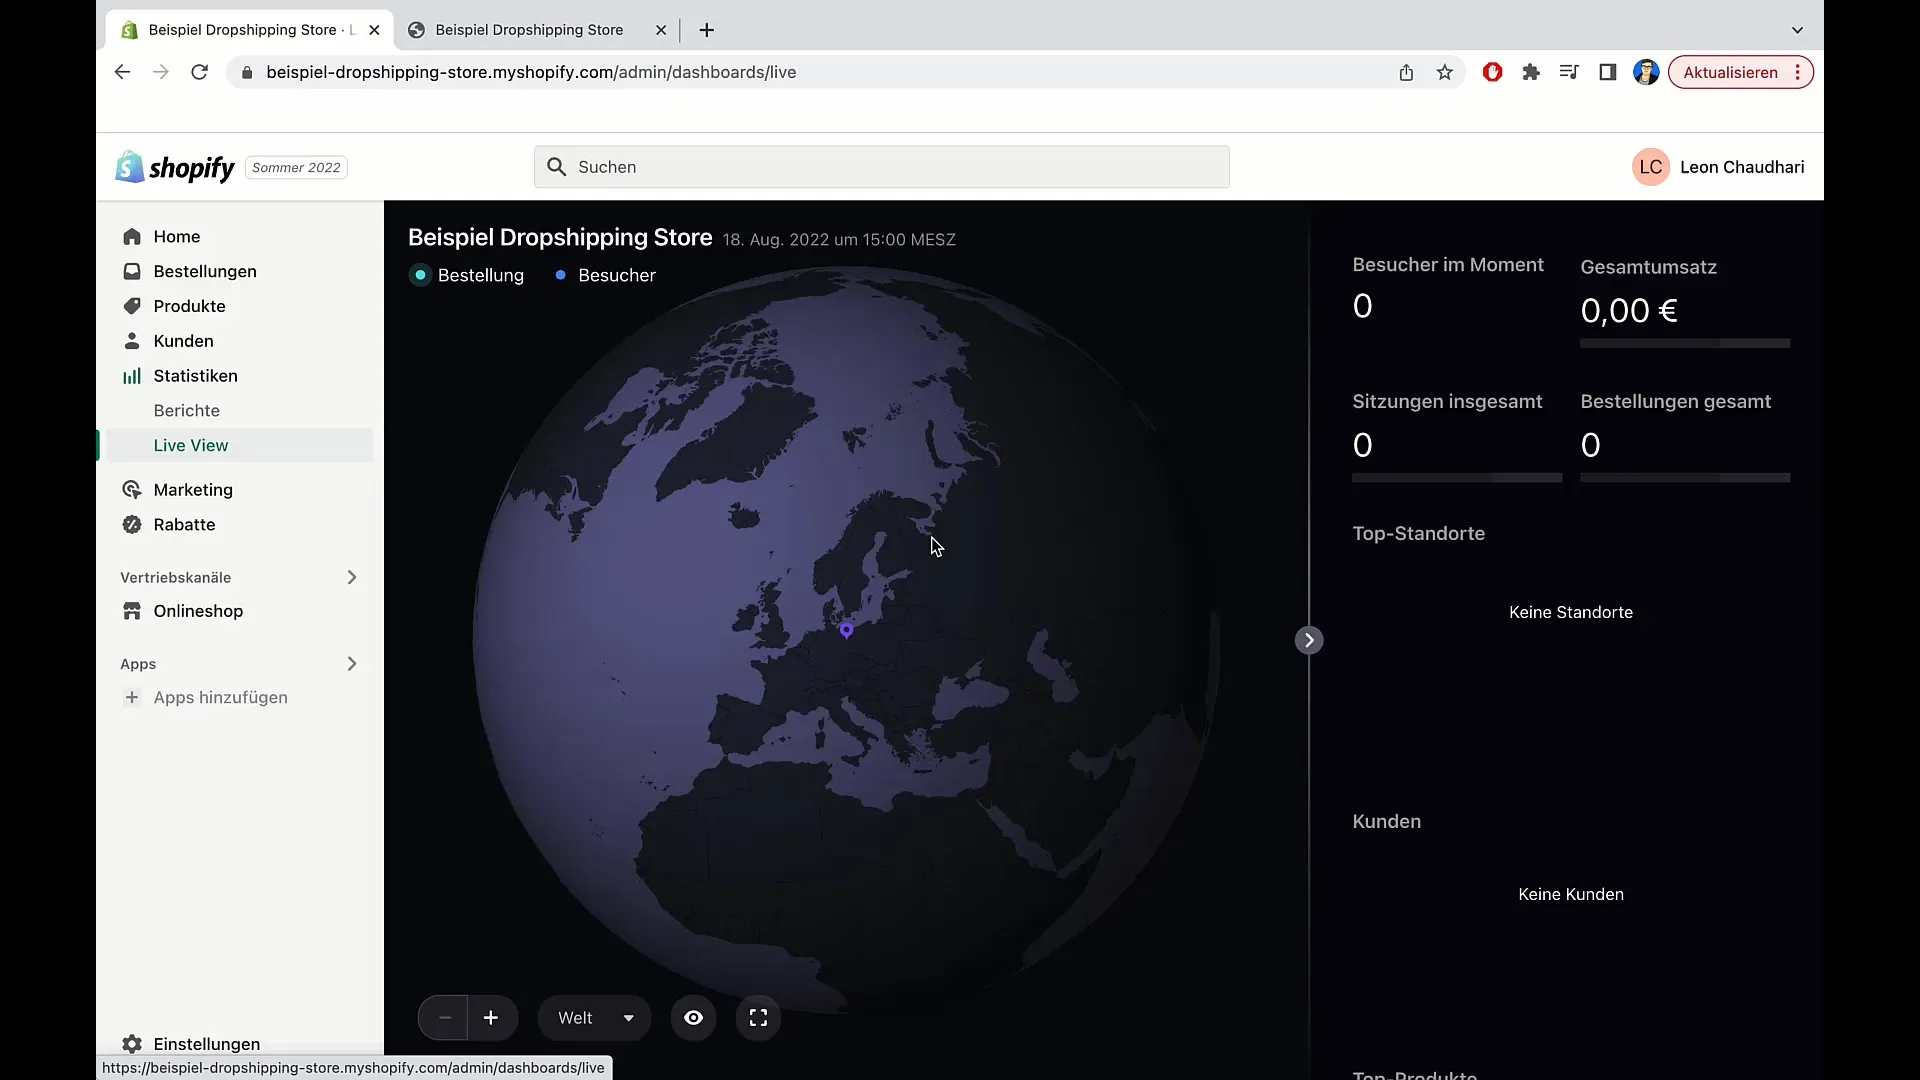
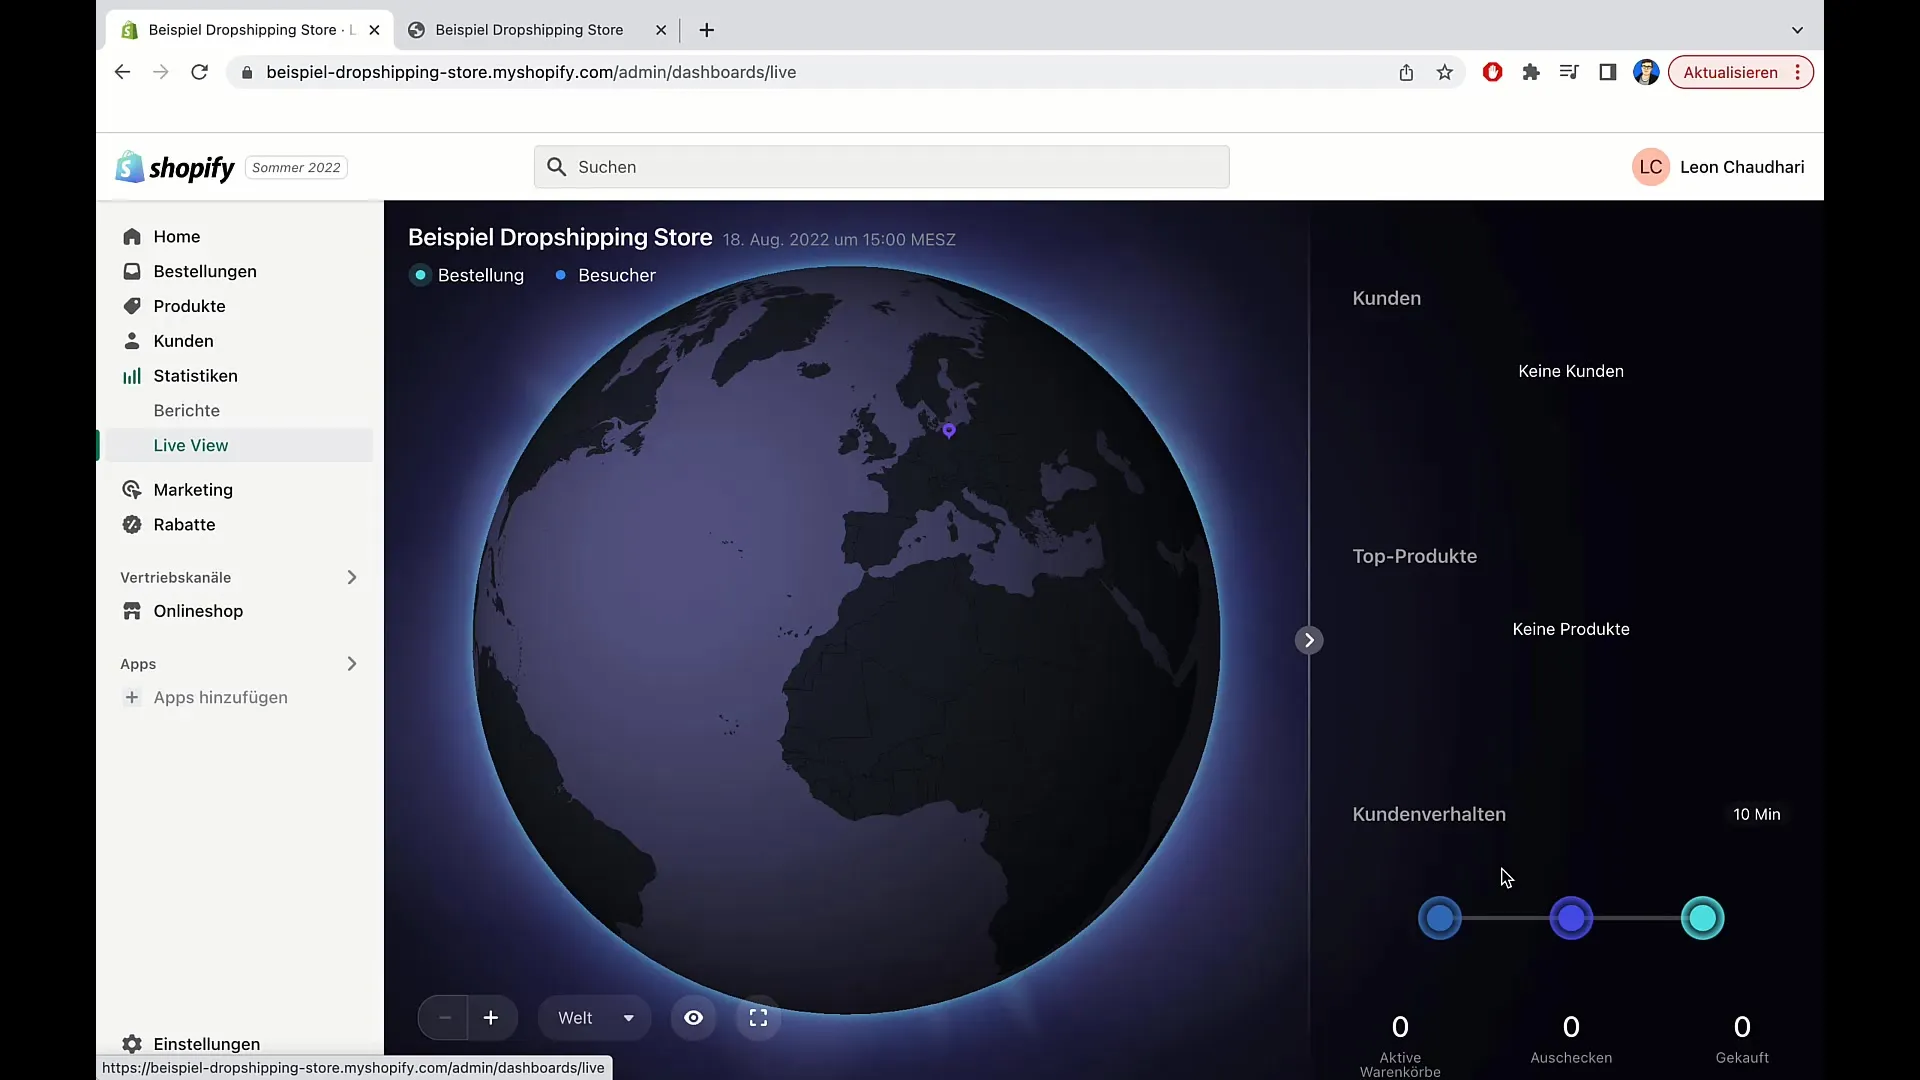
In addition to basic revenue data, you can also get deeper insights into customer behavior and visitor location data. The live area shows not only total sessions but also which products are currently being viewed.
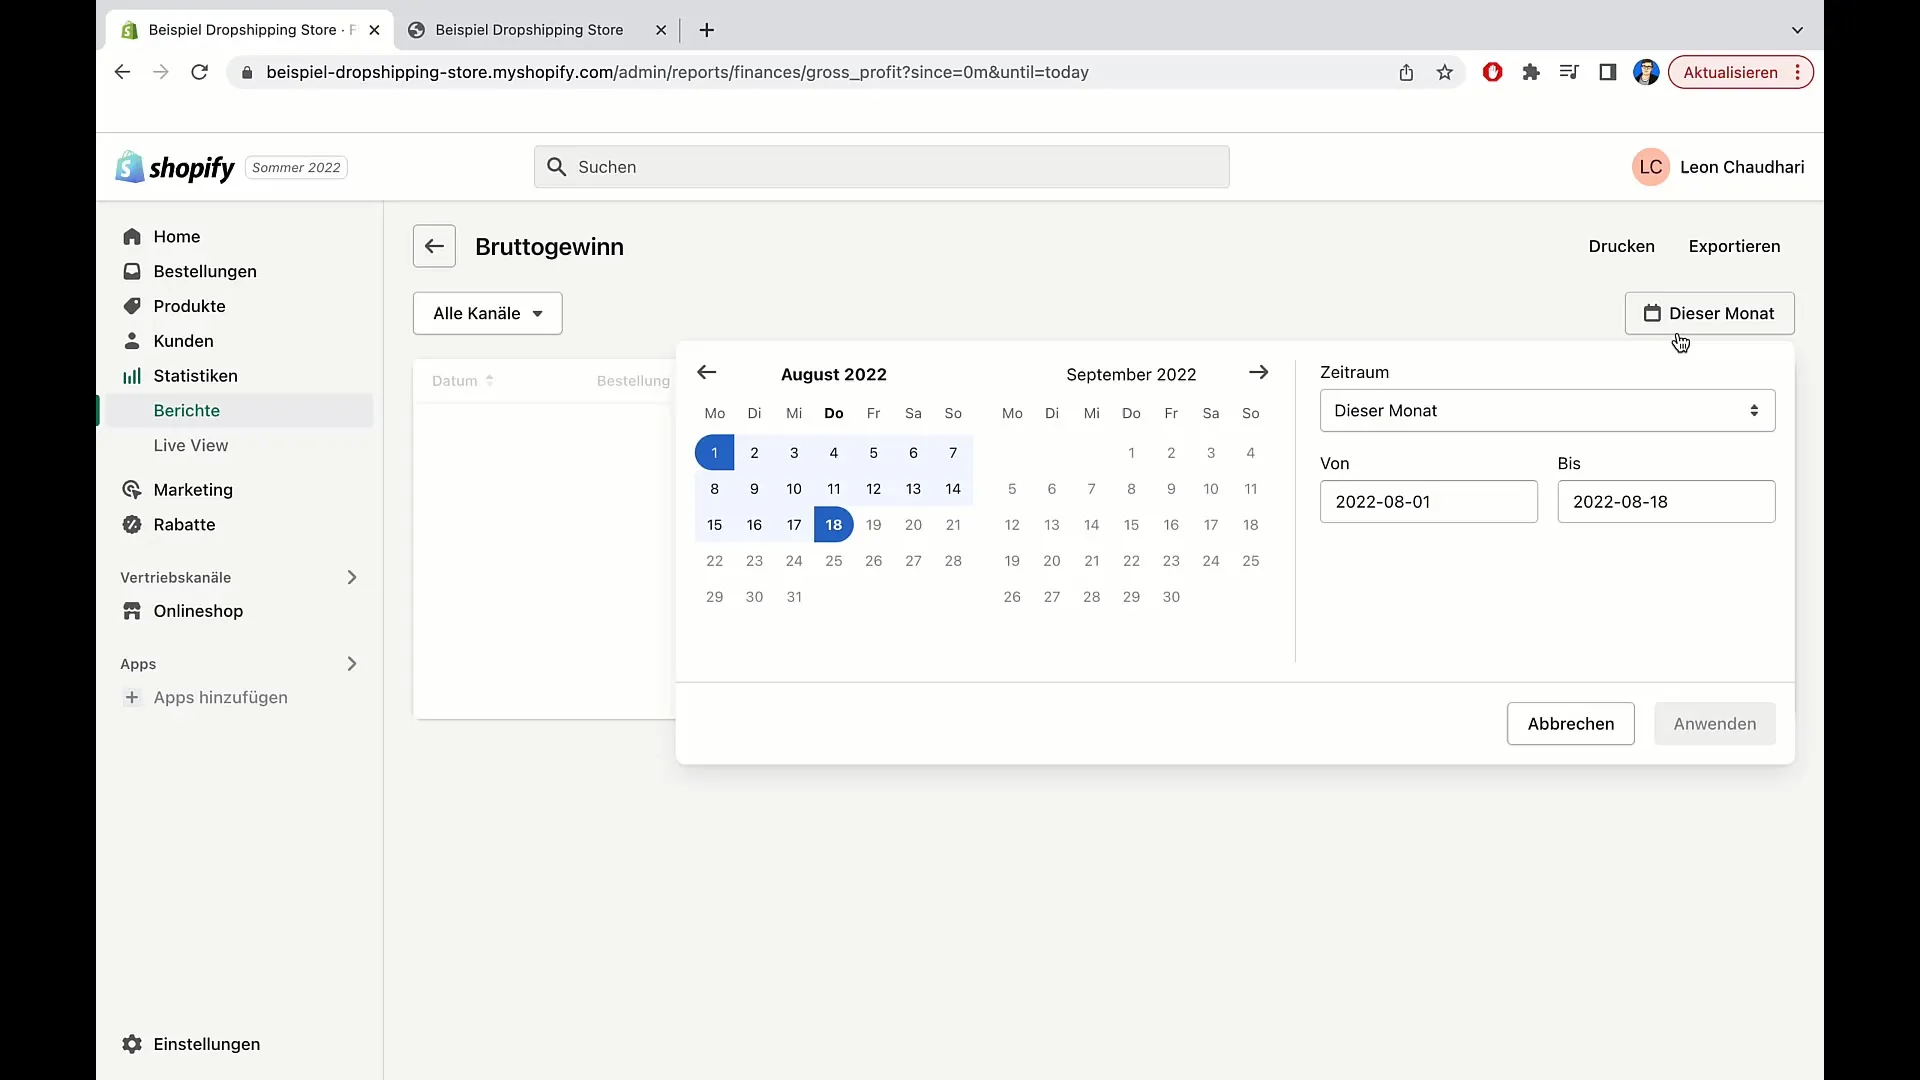
The final analysis includes the ability to create reports based on different criteria. For example, you can analyze sessions by location or by seller. If you want to find out your gross profit, simply go to the corresponding report and select the desired time frame.
A structured categorization is also possible. You can request reports on acquisition, finance, inventory, and marketing. If you are not satisfied with the desired settings, you have the option to reset them with a single click.
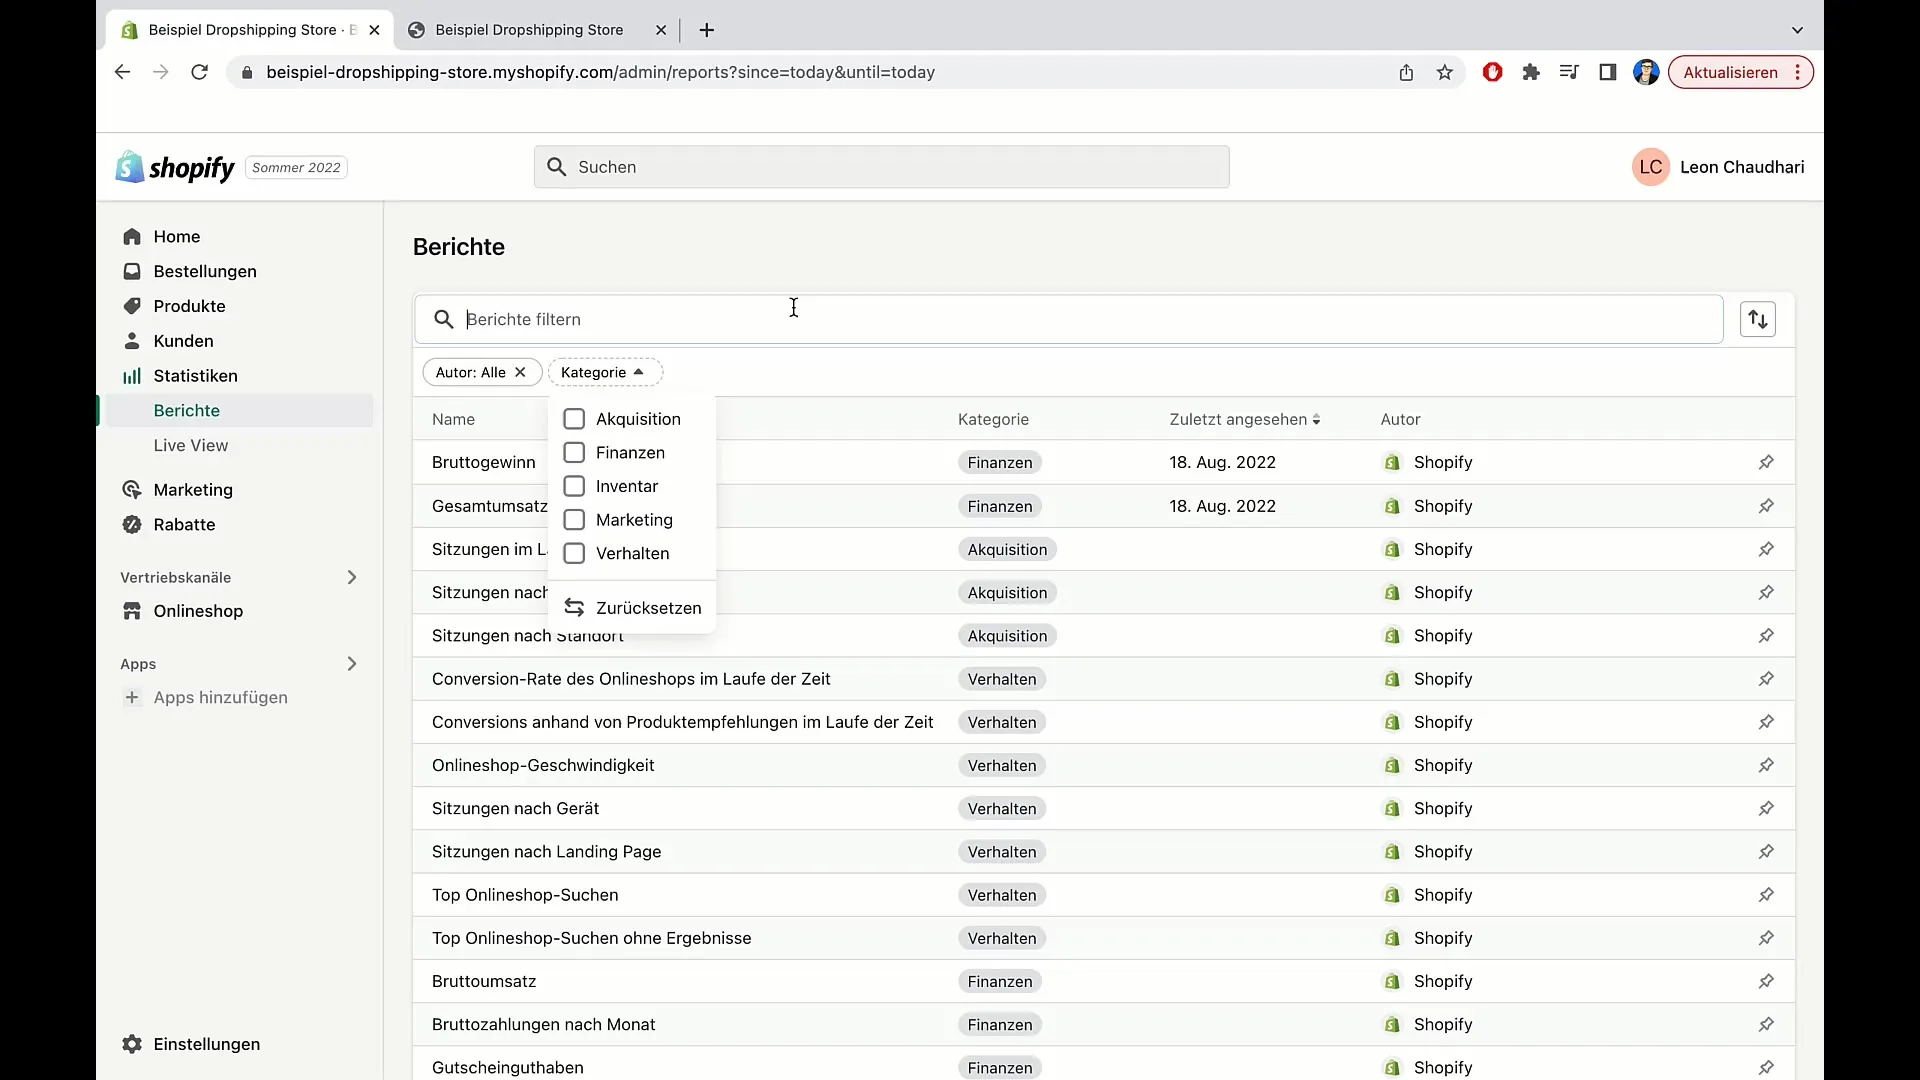
In addition, you can pin reports so that the most important ones are quickly accessible to you. To pin a report, simply click on the small pin icon. This keeps the report always visible and easily accessible.
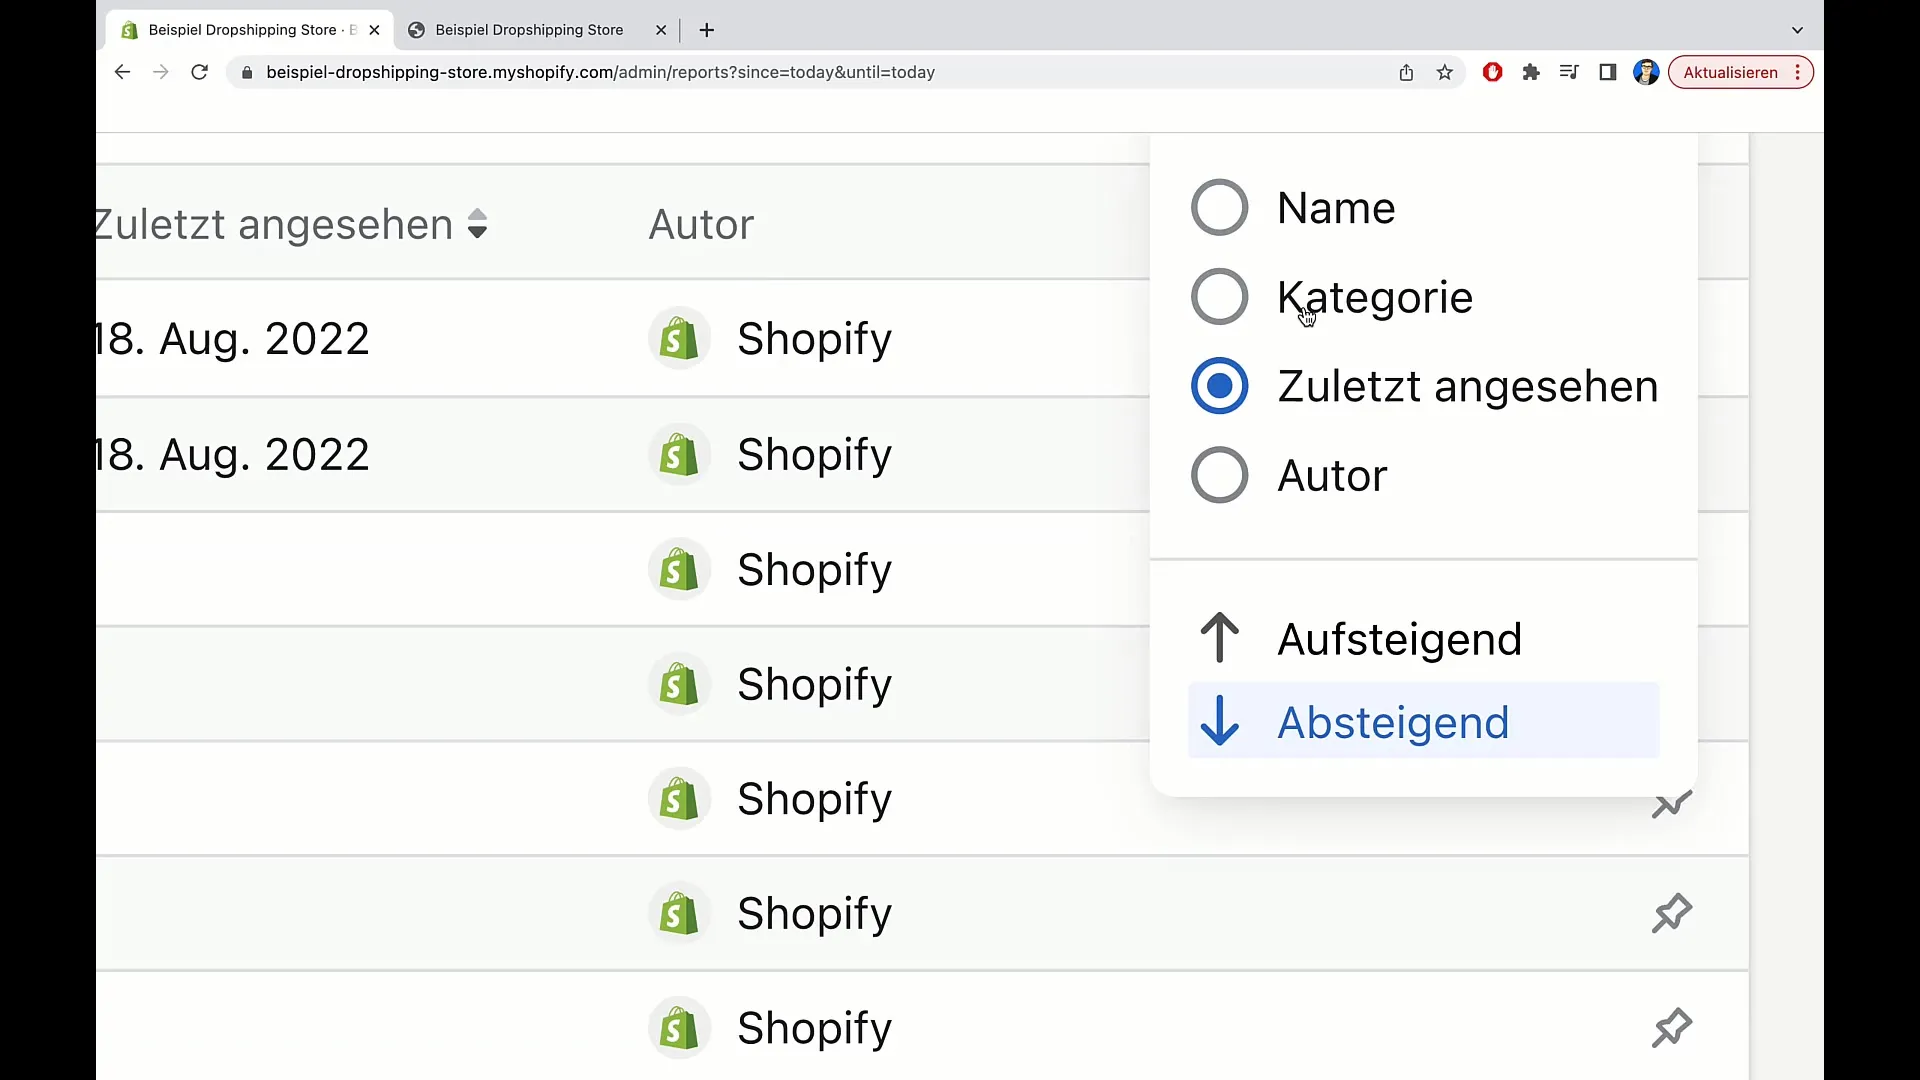
Finally, you can sort the reports according to various criteria - be it by name, category, or recently viewed reports. This flexibility helps you find exactly the information you need.
Summary
In this guide, you have learned how to use the sales display in Shopify and create detailed reports. By analyzing this data, you are better equipped to make informed decisions for your e-commerce business.
Frequently Asked Questions
How do I create a turnover report for a specific date?Go to the "Statistics" section, select the desired date, and click on "Apply".
Can I export reports?Yes, you can export reports as a CSV file or save them as a PDF.
What can I do with the live view?In the live view, you can see who is currently on your site and which products are being viewed.
How do I manage the different reports?You can pin, sort, or reset reports to increase clarity.
What information does the sales view provide me with?The sales view shows you the total revenue, orders, discounts, and other relevant sales data.


