This guide is about how you can use Instagram Analytics to measure the performance of your posts and optimize your content strategy. Instagram Analytics provides valuable insights into how your content is received by your audience. Whether you are a small business, an influencer, or simply an active Instagram user, understanding these analyses can help you increase your reach and better engage with your target audience.
Key Insights
- You can view the analytics for each of your posts to analyze interactions like likes, comments, and reach.
- Instagram Insights allow you to compare performance across different time periods and identify trends.
- Key metrics include accounts reached, impressions, and the origin of interactions (e.g., Explore Page or profile views).
- Subscriber growth can be analyzed to determine which content attracts the most new followers.
- The insights can help you determine the best times to post.
Step-by-Step Guide
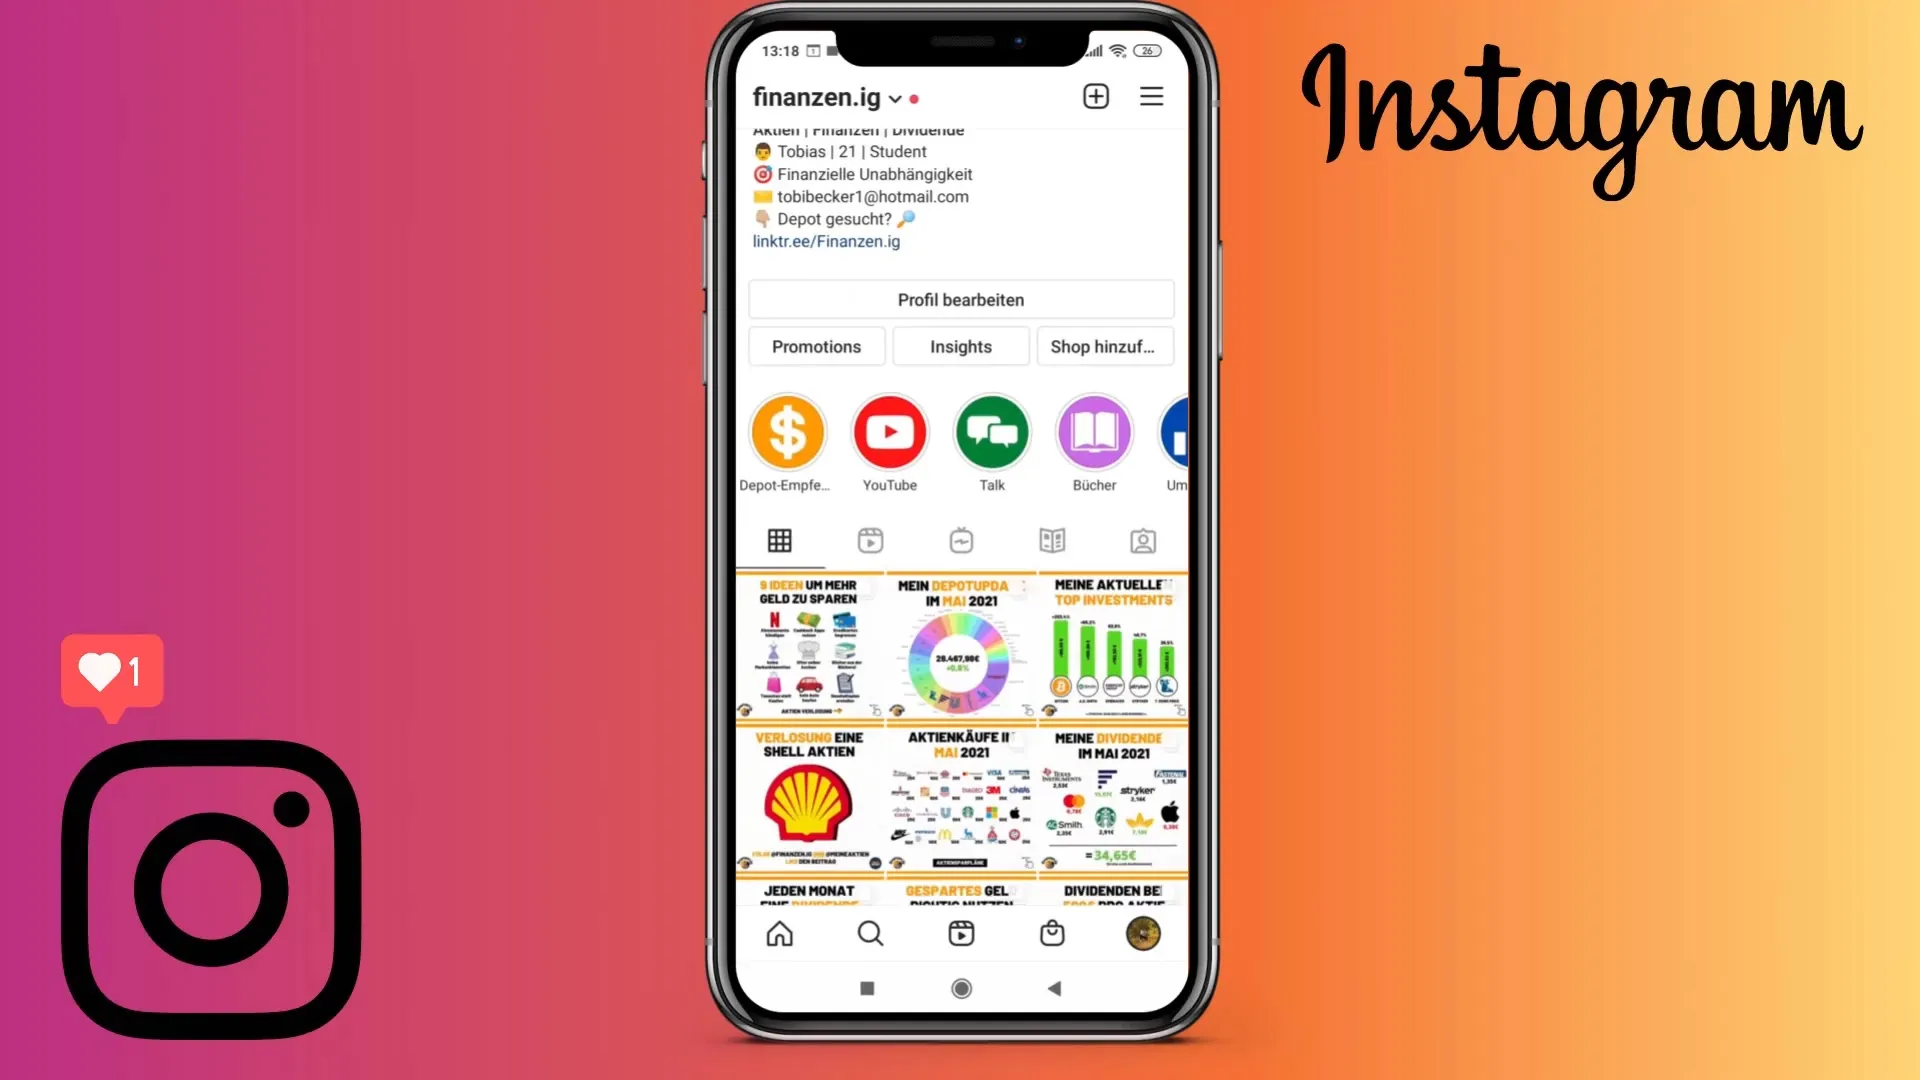
Step 1: Accessing your profile
First, open your Instagram profile. You can simply tap on the symbol of your profile to navigate to your page.
Step 2: Select a post and access insights
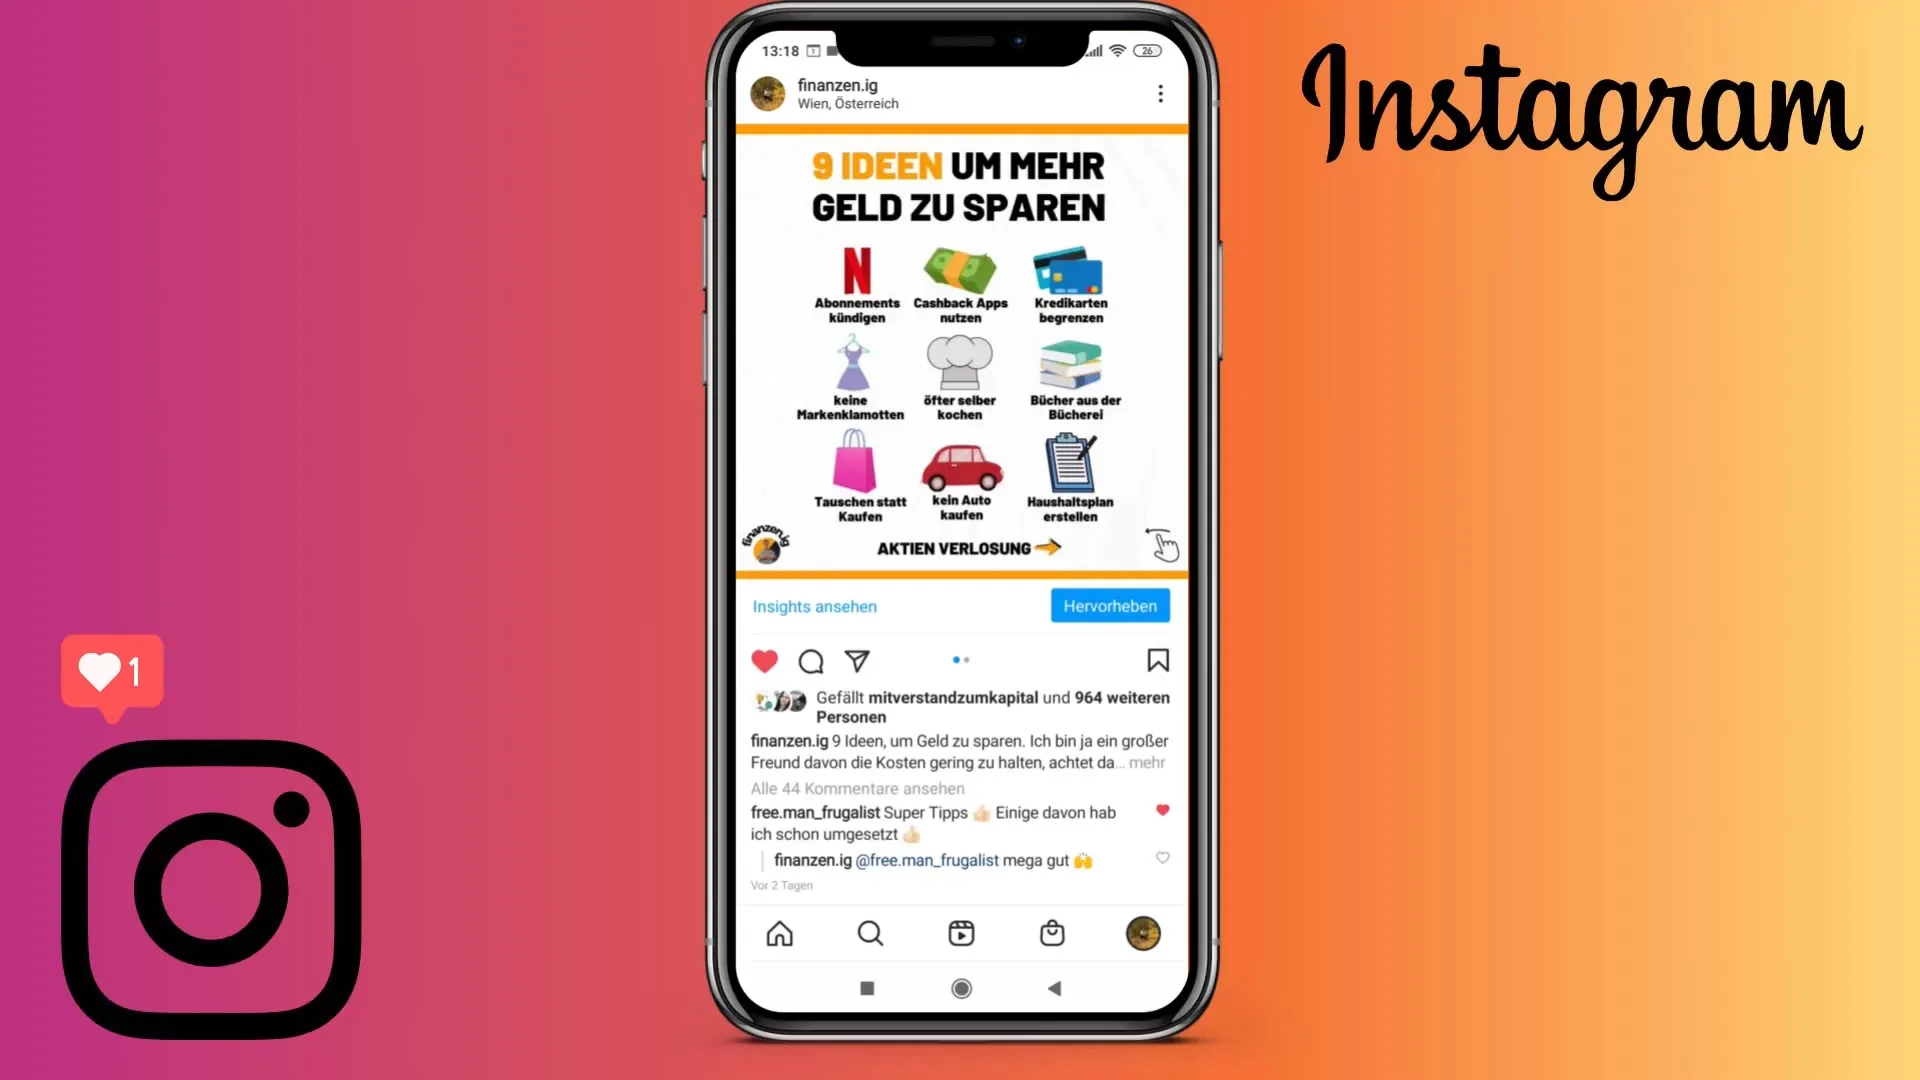
If you want to check a specific post, go to one of your recent posts and click on the "View Insights" button displayed above the Like button.
Step 3: Analyze interactions and reach
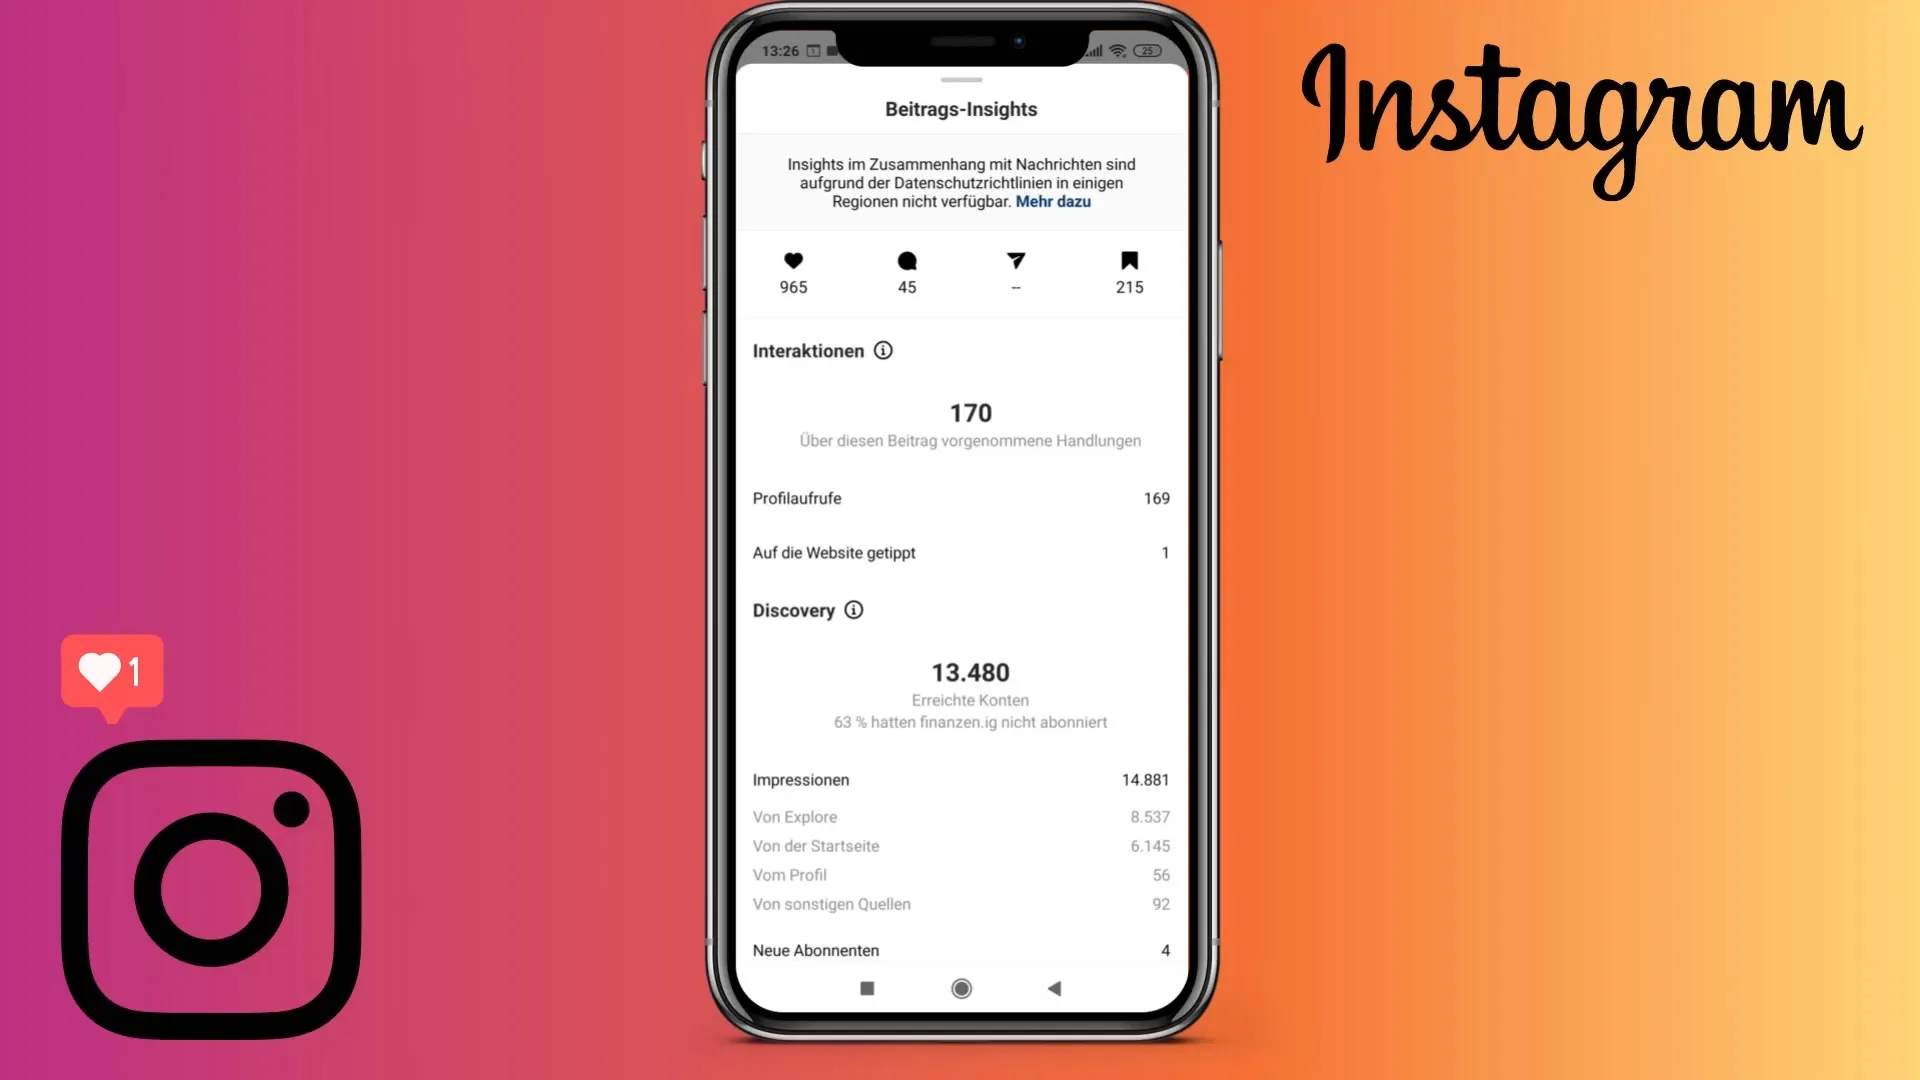
Here you can see the likes, number of comments, and saved content. Note that for privacy reasons, some information like shares are not displayed.

Step 4: Look at additional metrics
In the "Discovery" section, you can see how many people your post reached, and under "Interactions," you can see the actions taken in connection with your post, such as profile visits or visits to your website.
Step 5: Access insights for your entire account
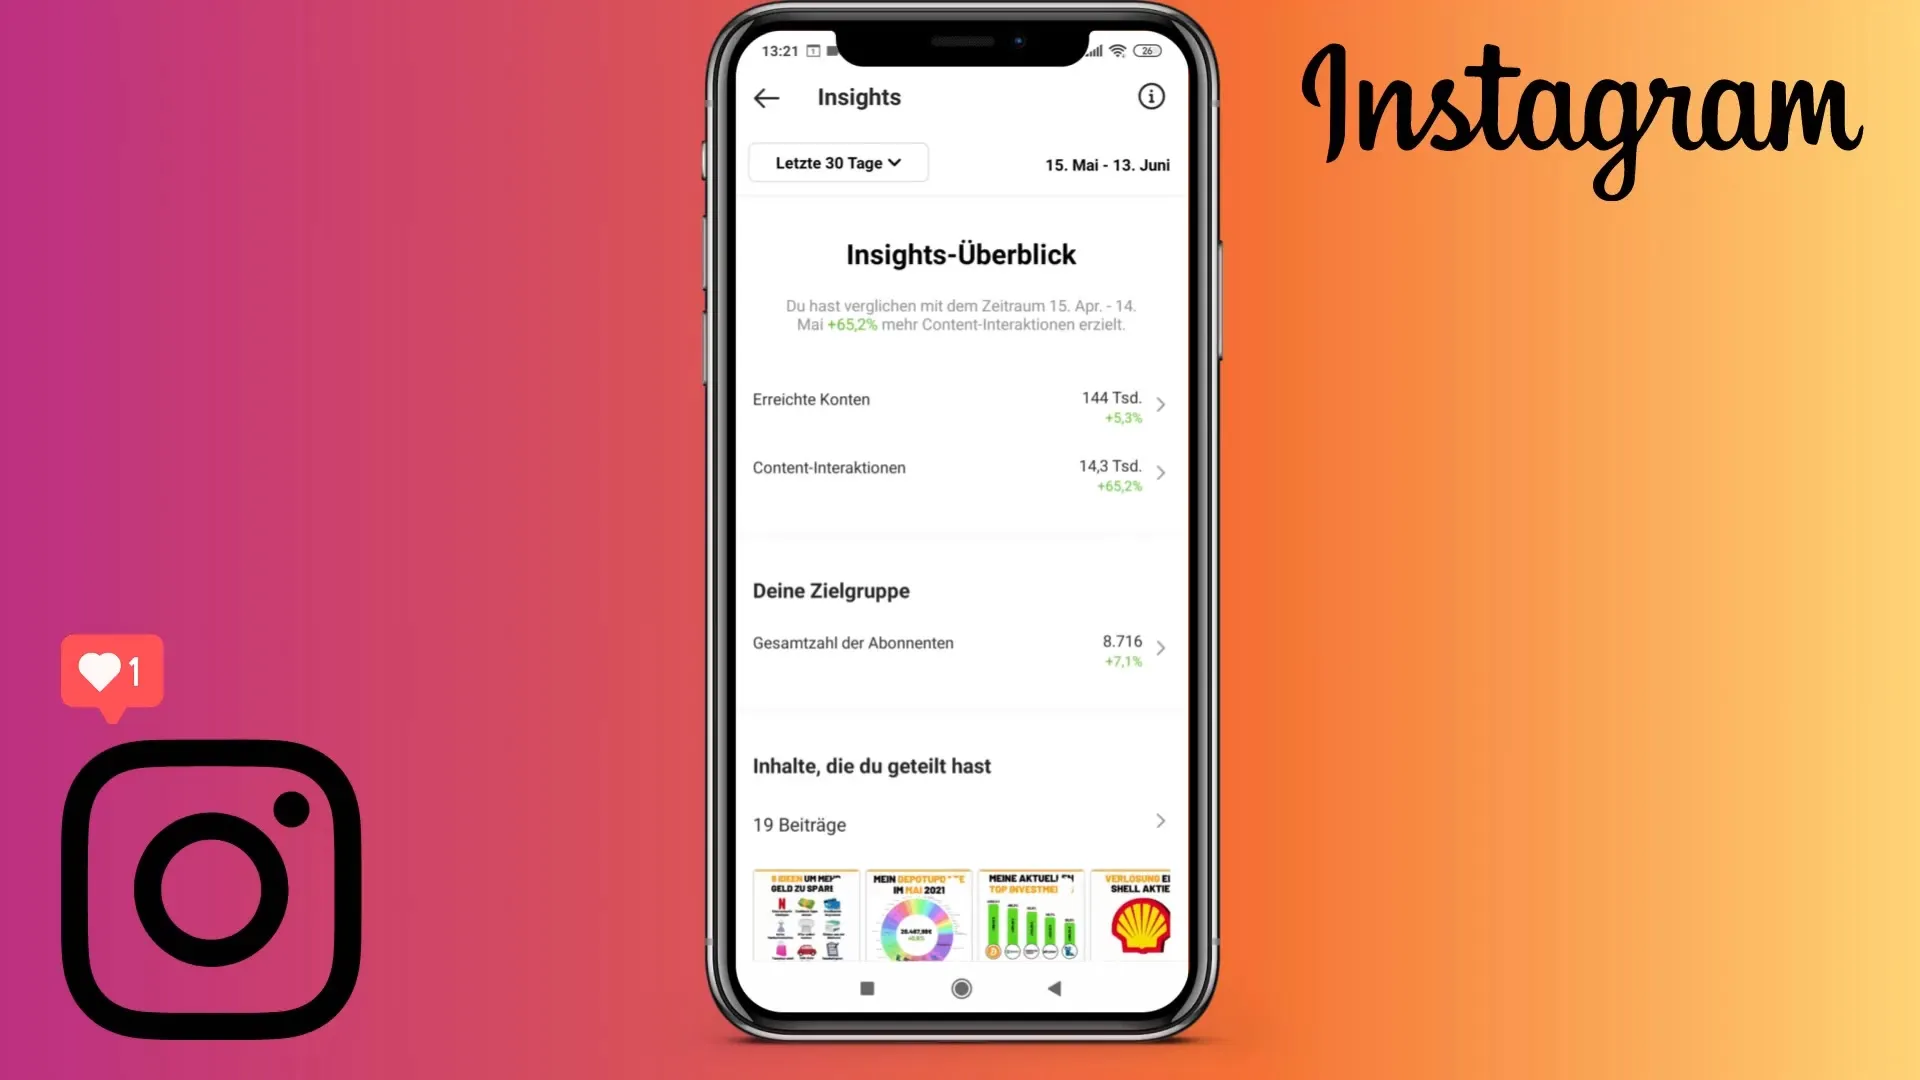
To summarize the performance of all your content, go to the top right corner and click on the three lines. Then select "Insights" to see the statistics for a chosen time period.
Step 6: Adjust the analysis period
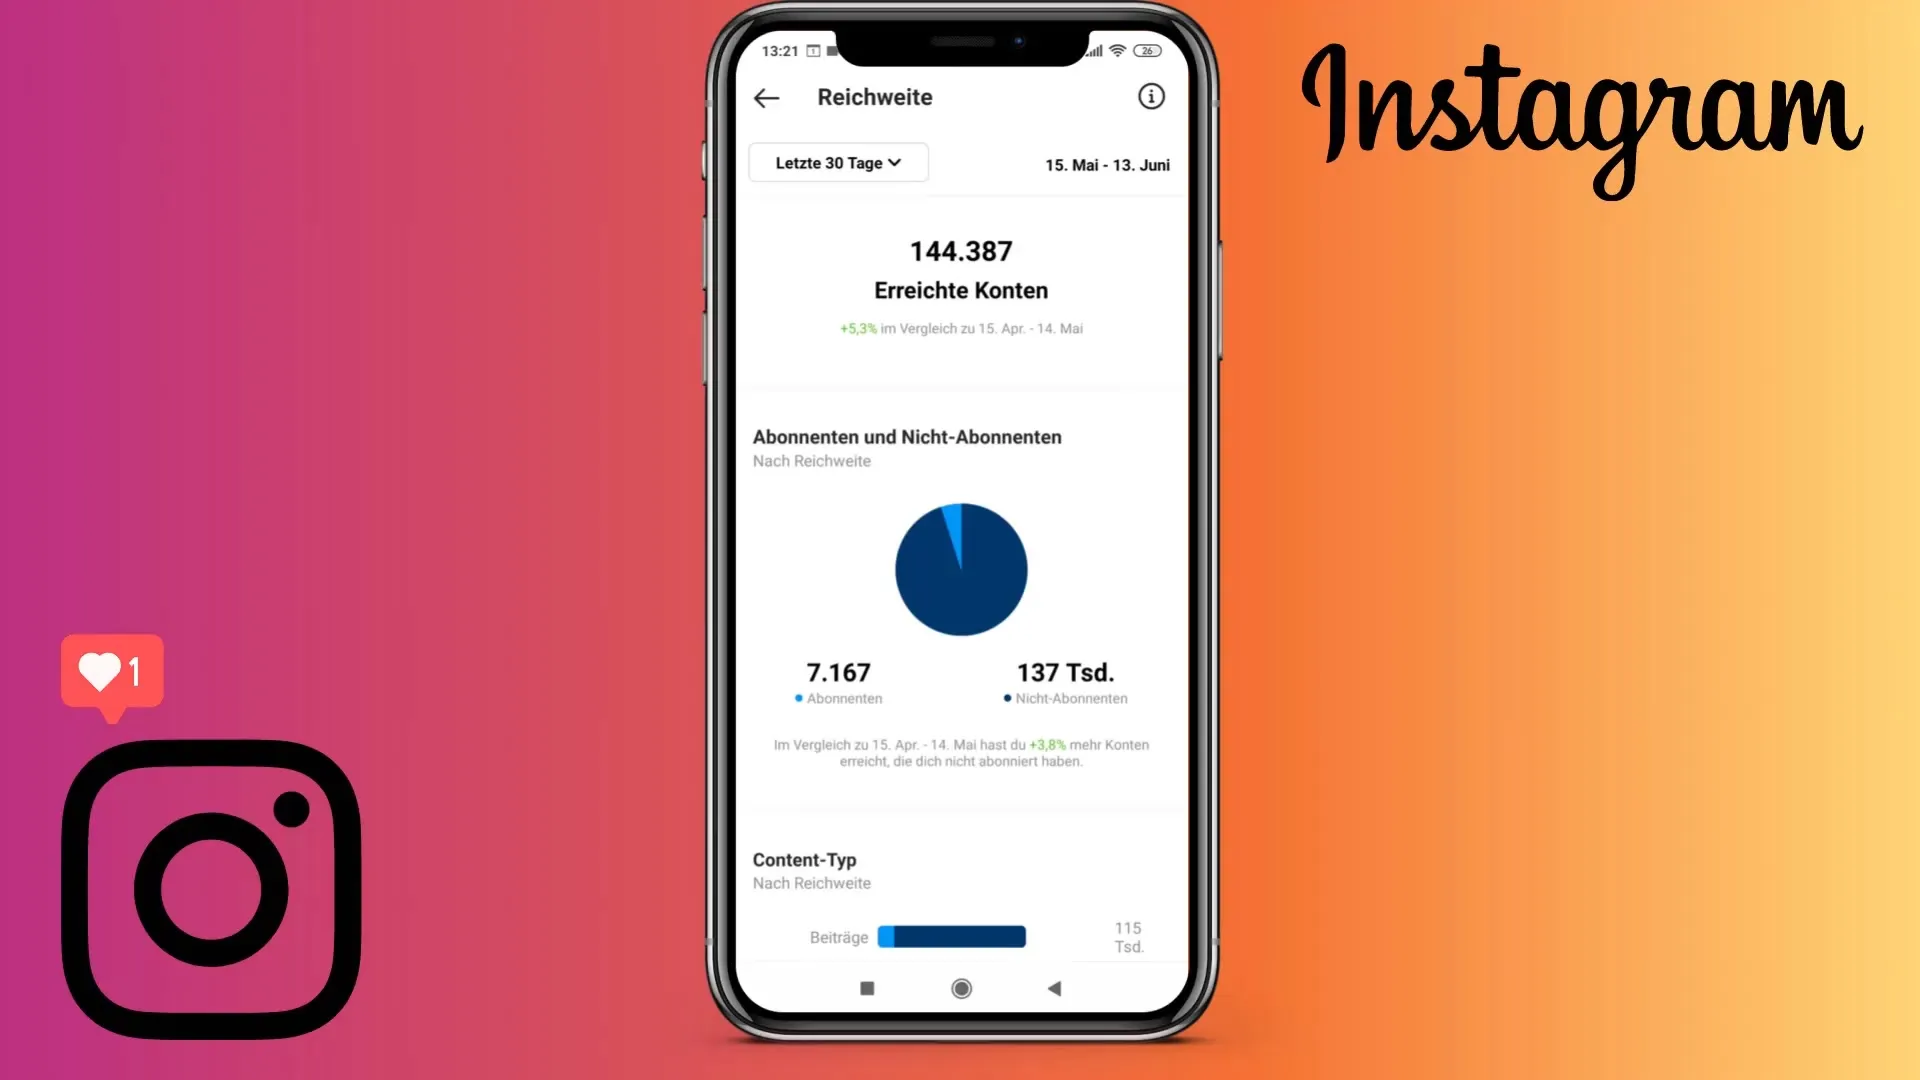
You can adjust the period for data analysis, for example, switch from the last 7 days to the last 30 days to get a better overview of your development.
Step 7: Compare time periods
Take advantage of the opportunity to compare different time periods to see if your reach or interactions have increased compared to before.
Step 8: Analyze types of content
You can separately analyze the performance of your Reels, Stories, and posts to understand which type of posts are most successful.
Step 9: Track top posts and their origin
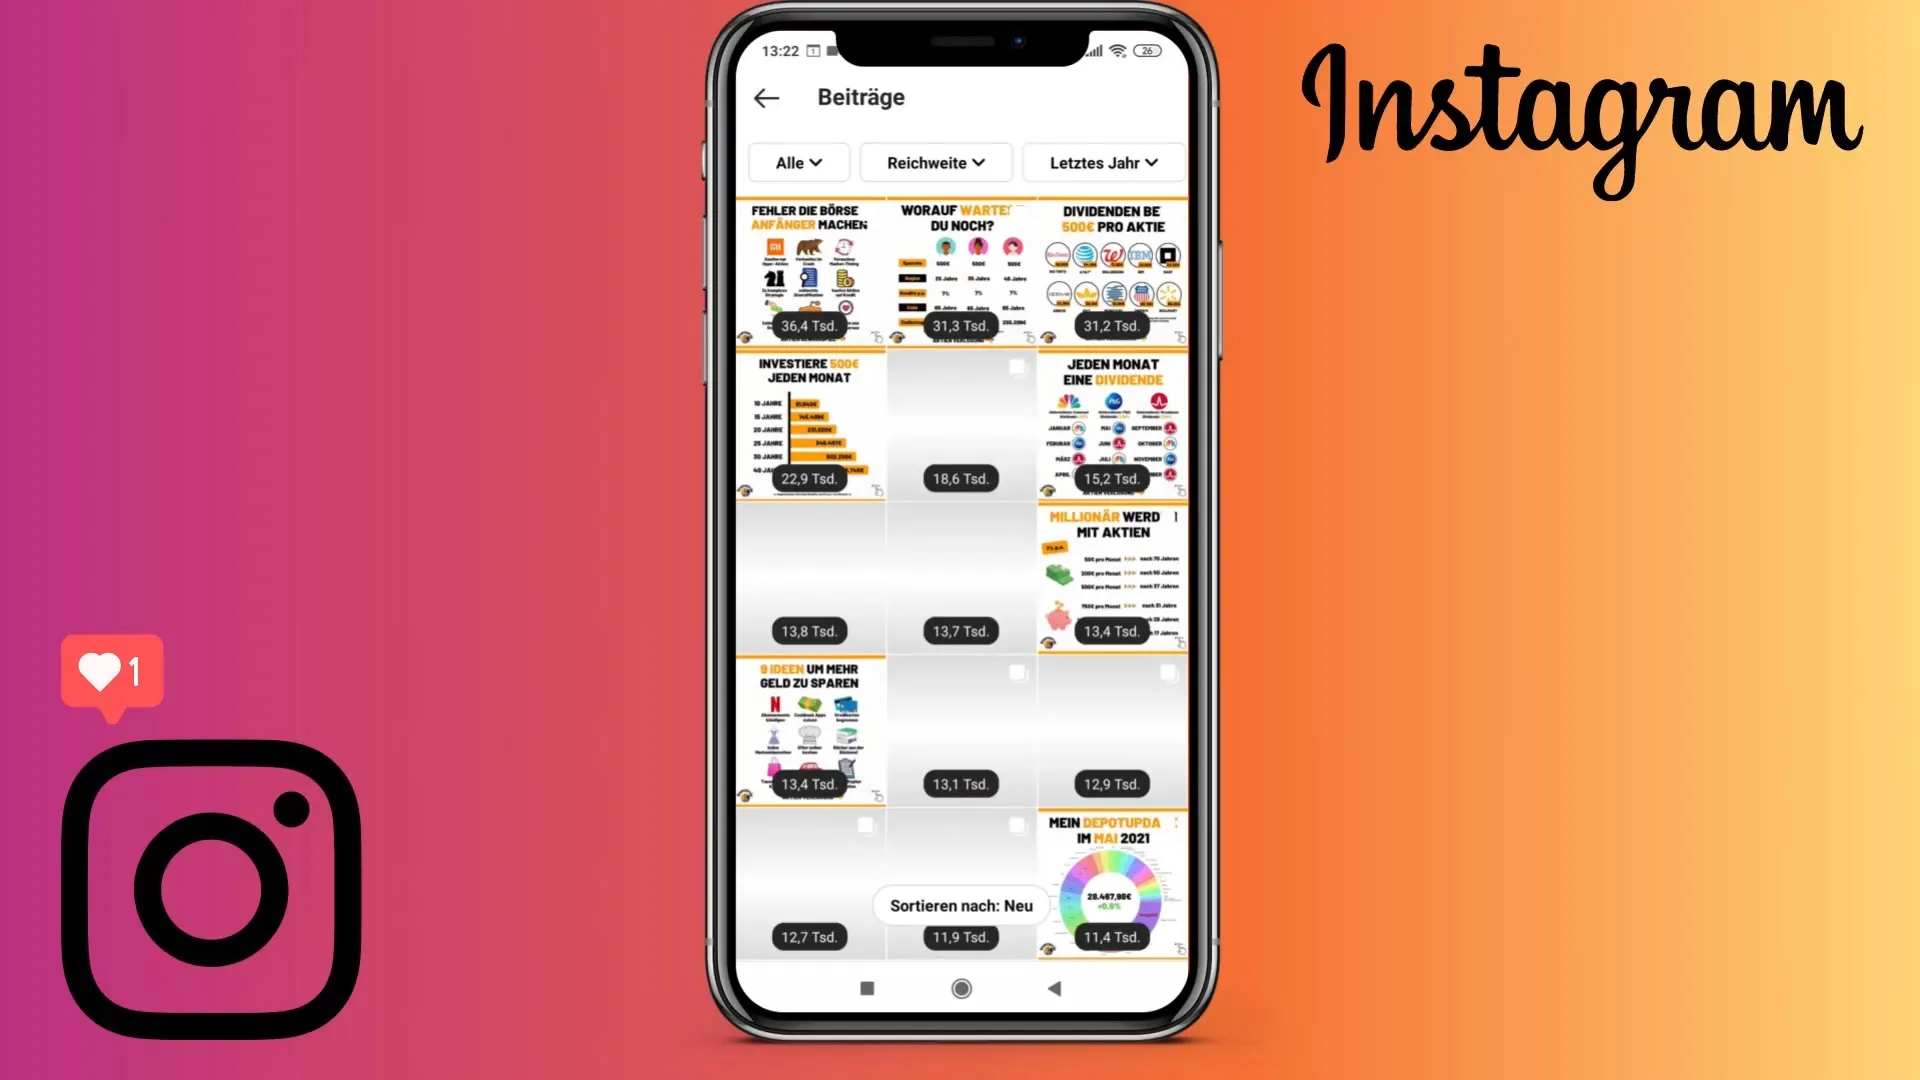
In the "Top Posts" section, you can view the posts with the highest interactions. This helps you identify which content resonates most with your audience.
Step 10: Monitor subscriber growth
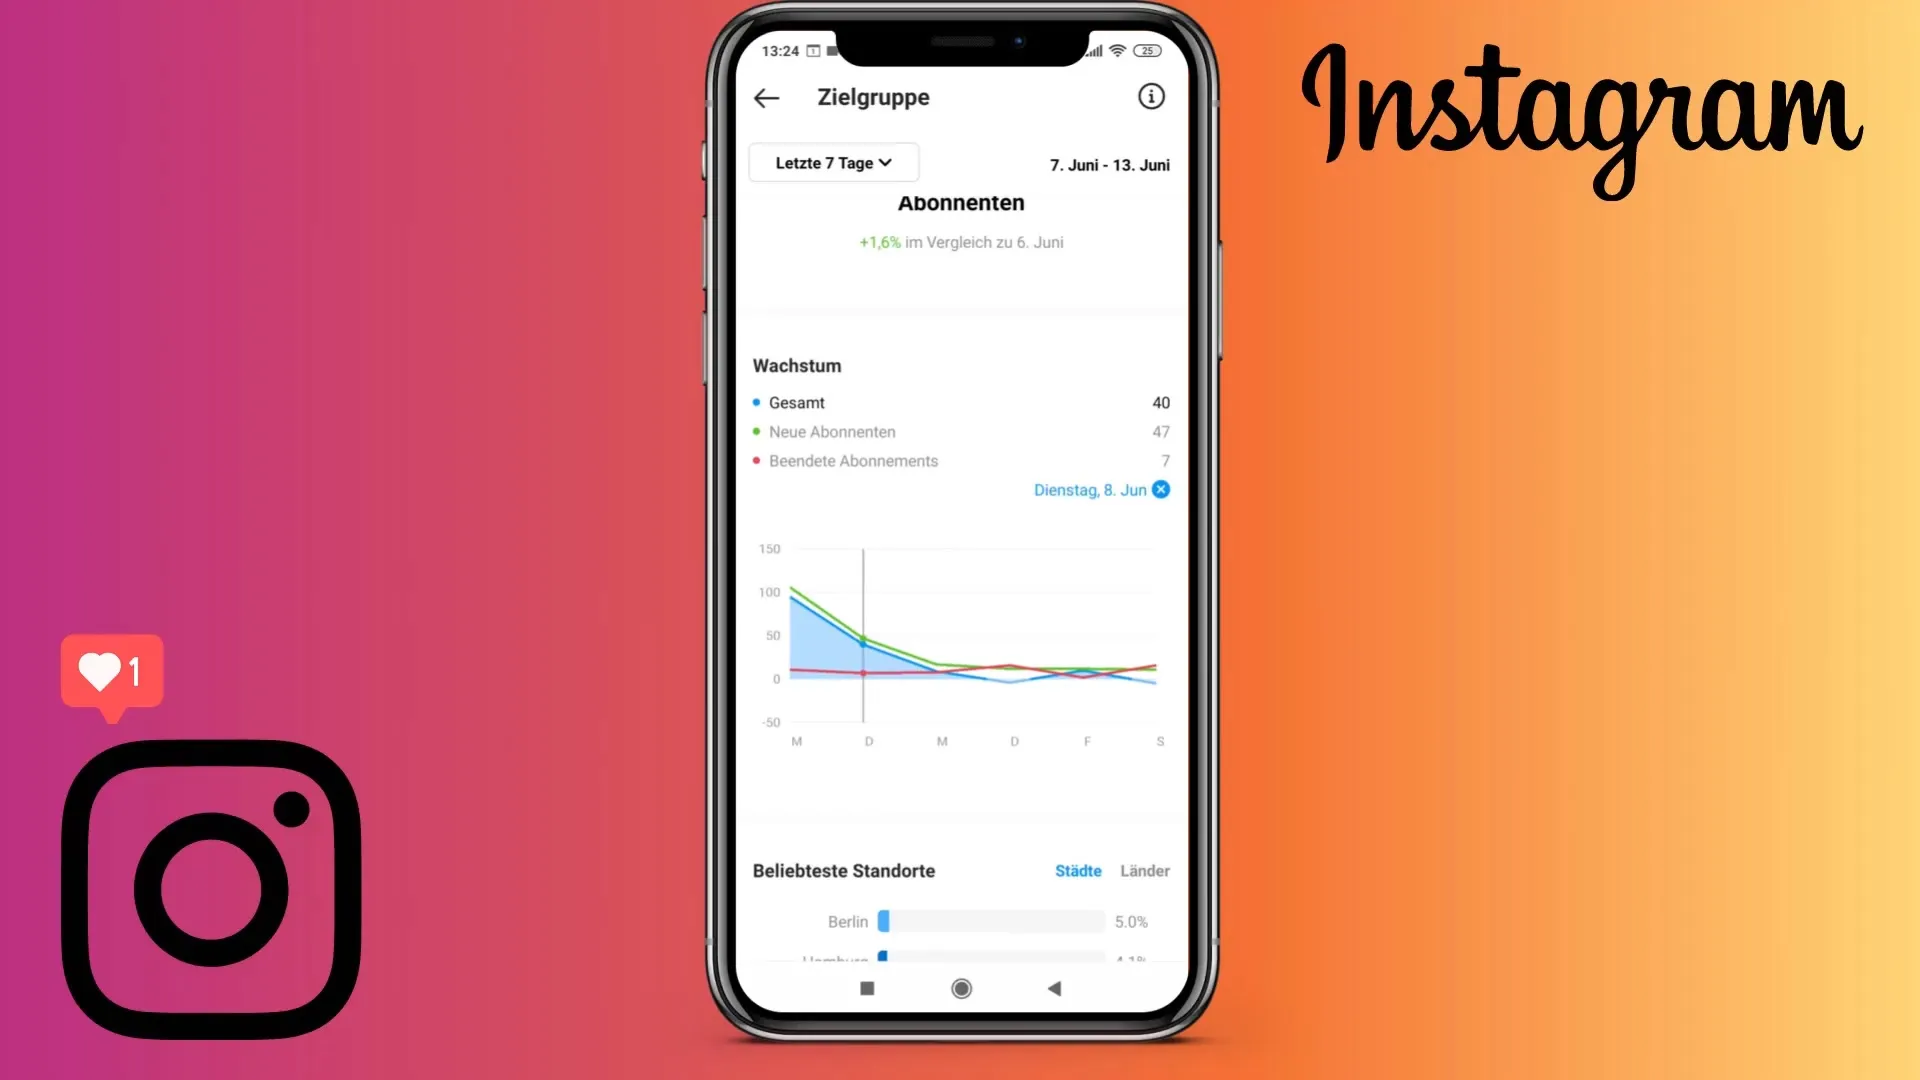
Analyze your subscriber growth to find out which days you have the best increases. You can see on which days new subscribers were gained and which days were losing subscribers.
Step 11: Viewing Demographic Data
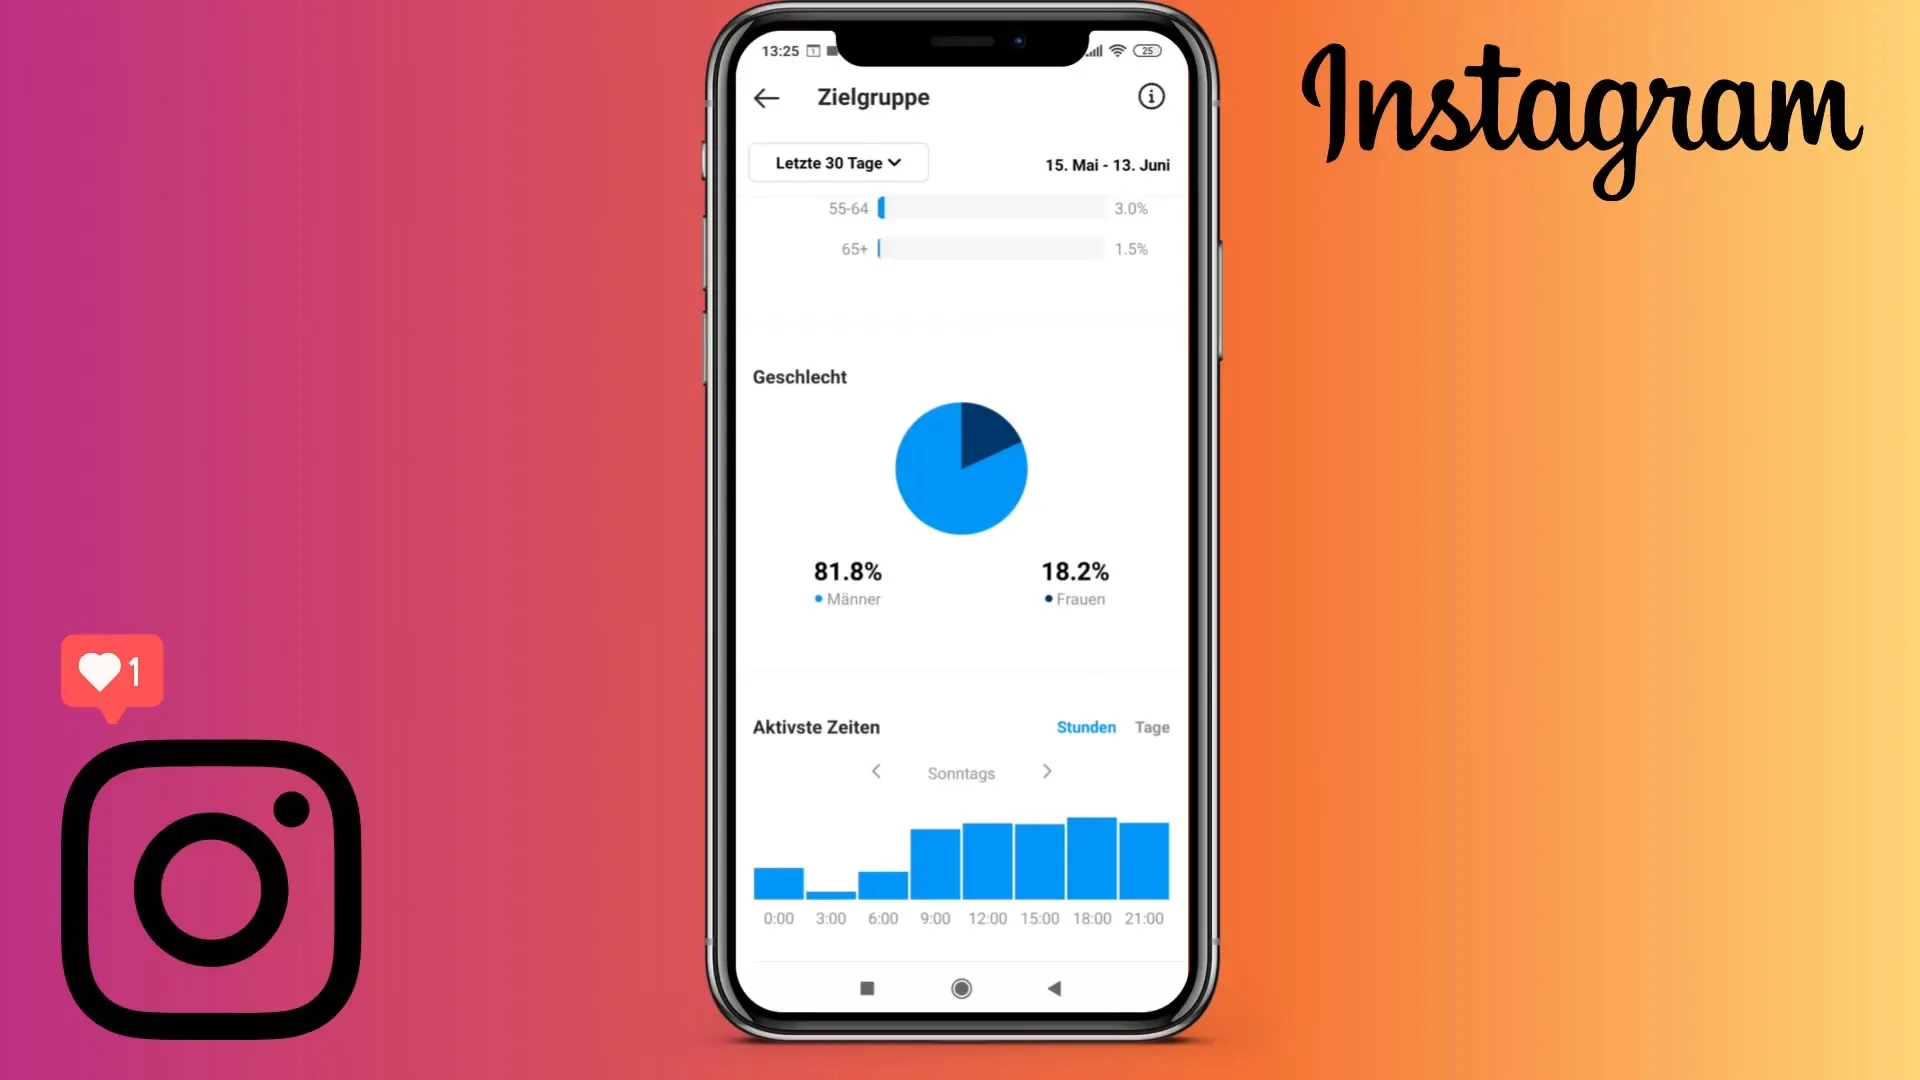
Instagram also provides an analysis of the demographic data of your followers, such as gender or age. This way, you can create content tailored to your target audience.
Step 12: Analyzing Follower Activity Times
To find out when is the best time to post, check your followers' activity. This can help you publish your posts at times when your followers are most active.
Step 13: Implementing Insights
Use the collected data to optimize your content strategy. If you see that you can increase reach and interactions through certain posts, focus on that type of content and try to create similar posts.
Summary
In this guide, you have learned how to use Instagram Analytics to analyze your posts and their success. By analyzing interactions, reach, and follower growth, you can optimize your content strategy and determine the best times to post. Use the insights to better understand your target audience and adjust your content accordingly.
