In this tutorial, you will get a comprehensive overview of the Chrome Developer Tools. These tools are essential for web developers as they offer a variety of valuable features that help you analyze and debug your web pages. We start with the basics and guide you step by step through the different panels and their functionalities.
Main takeaways
- Chrome Developer Tools offer a variety of panels that help you inspect and debug the HTML, CSS, and JavaScript of your website.
- Each panel has specific functions that significantly facilitate website analysis.
- You can select and edit elements directly from the view to see immediate changes.
Step-by-Step Guide
Step 1: Opening Chrome Developer Tools
To start, you need to open your Chrome browser. To launch the Developer Tools, there are several methods. Simply press the F12 key on your keyboard. Another method is to use the keyboard combination Command + Shift + C (Mac) or Ctrl + Shift + C (Windows). You can also open the tools by right-clicking on the webpage and selecting "Inspect."
Step 2: Customizing the View
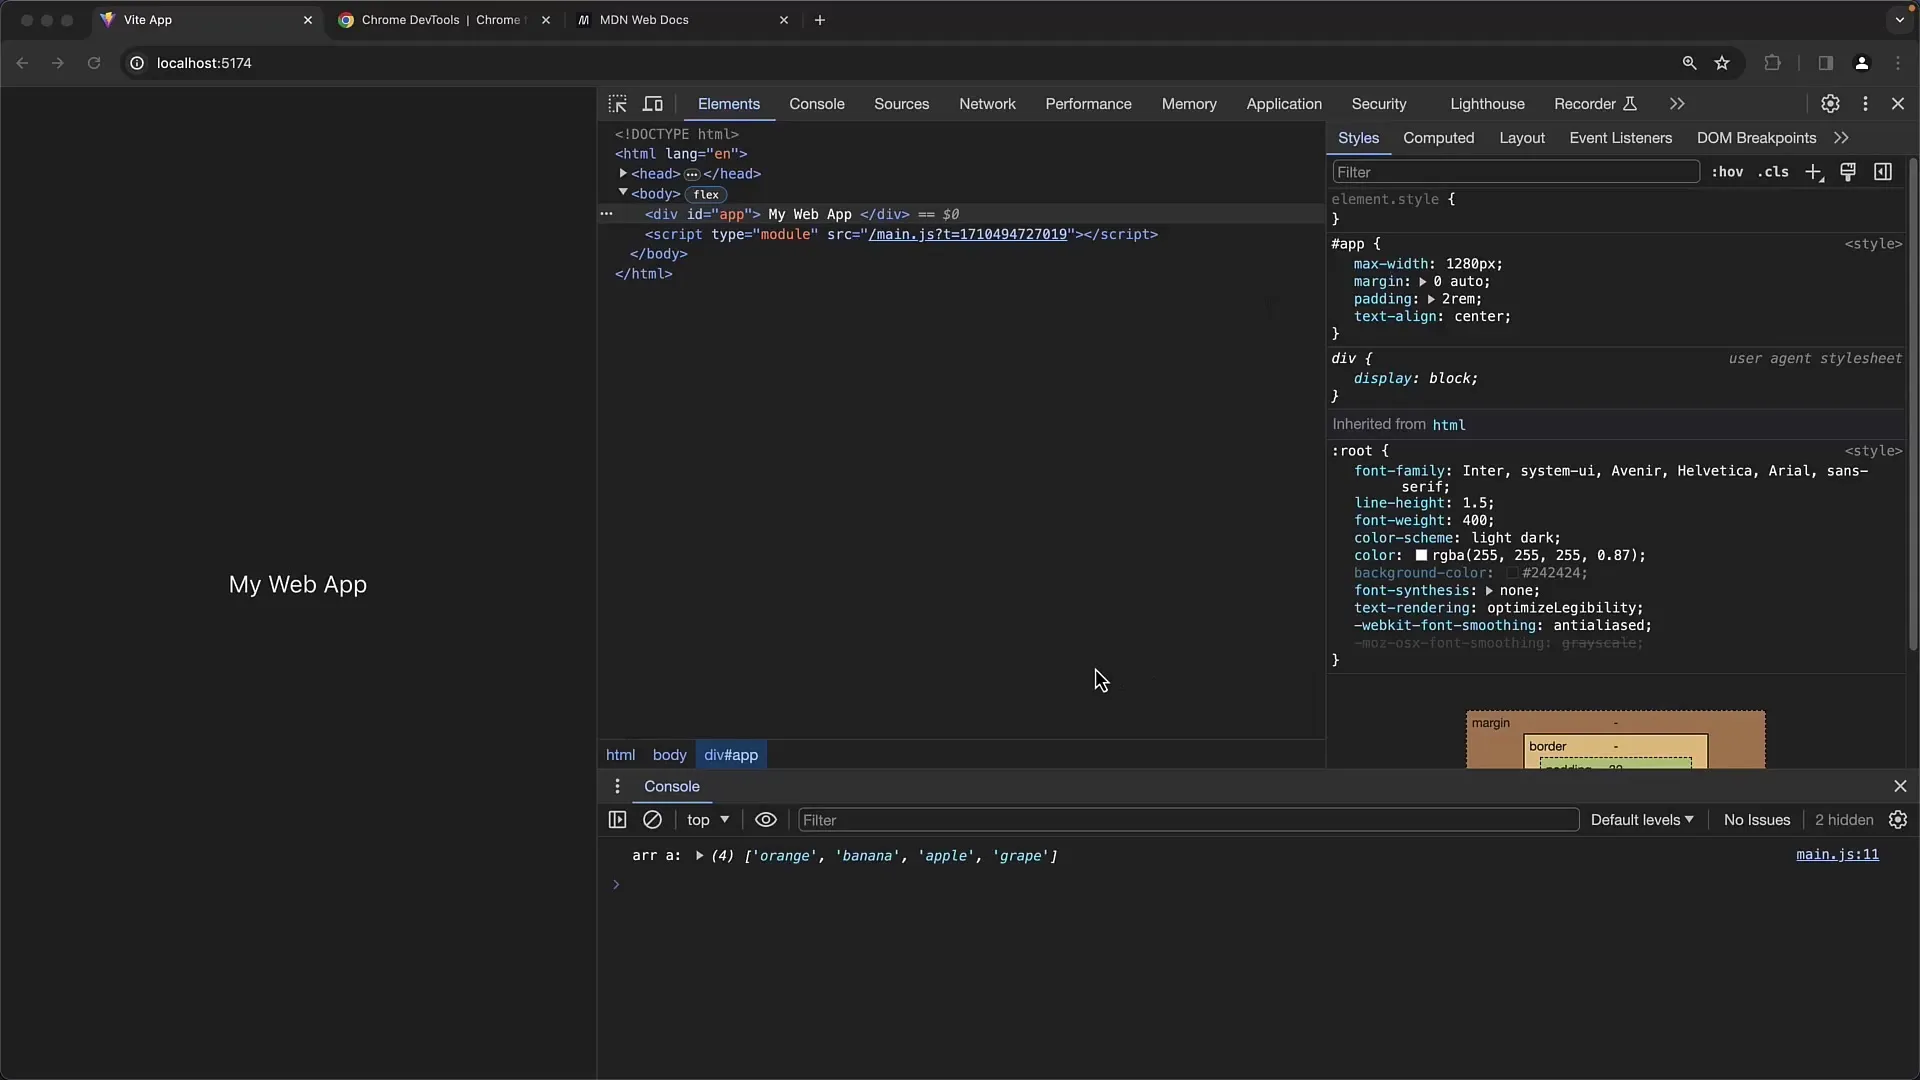
Once you have opened the Developer Tools, you can customize the window view. Using the three dots in the top right corner of the Developer Tools, you can adjust the display either in a split-screen mode or in a separate window. If you open the tools in a separate window, you can easily move them to a second monitor to create more space.
Step 3: The "Elements" Panel
The "Elements" Panel is the section where you can see the HTML structure of your website. Here, all DOM elements are displayed in a hierarchical structure. By hovering over individual elements, their dimensions and positions are highlighted on the webpage. You can expand or collapse the hierarchy of elements by clicking on the arrows.
Step 4: Checking Styles
When you select an HTML element in the "Elements" view, you can see the corresponding CSS styles on the right. These styles are divided into different sections: declared styles and computed styles. You can even add your own CSS rules and see the changes in real time. Under the "Layout" tab, you can get information about dimensions, padding, and margins.
Step 5: Utilizing the Console Panel
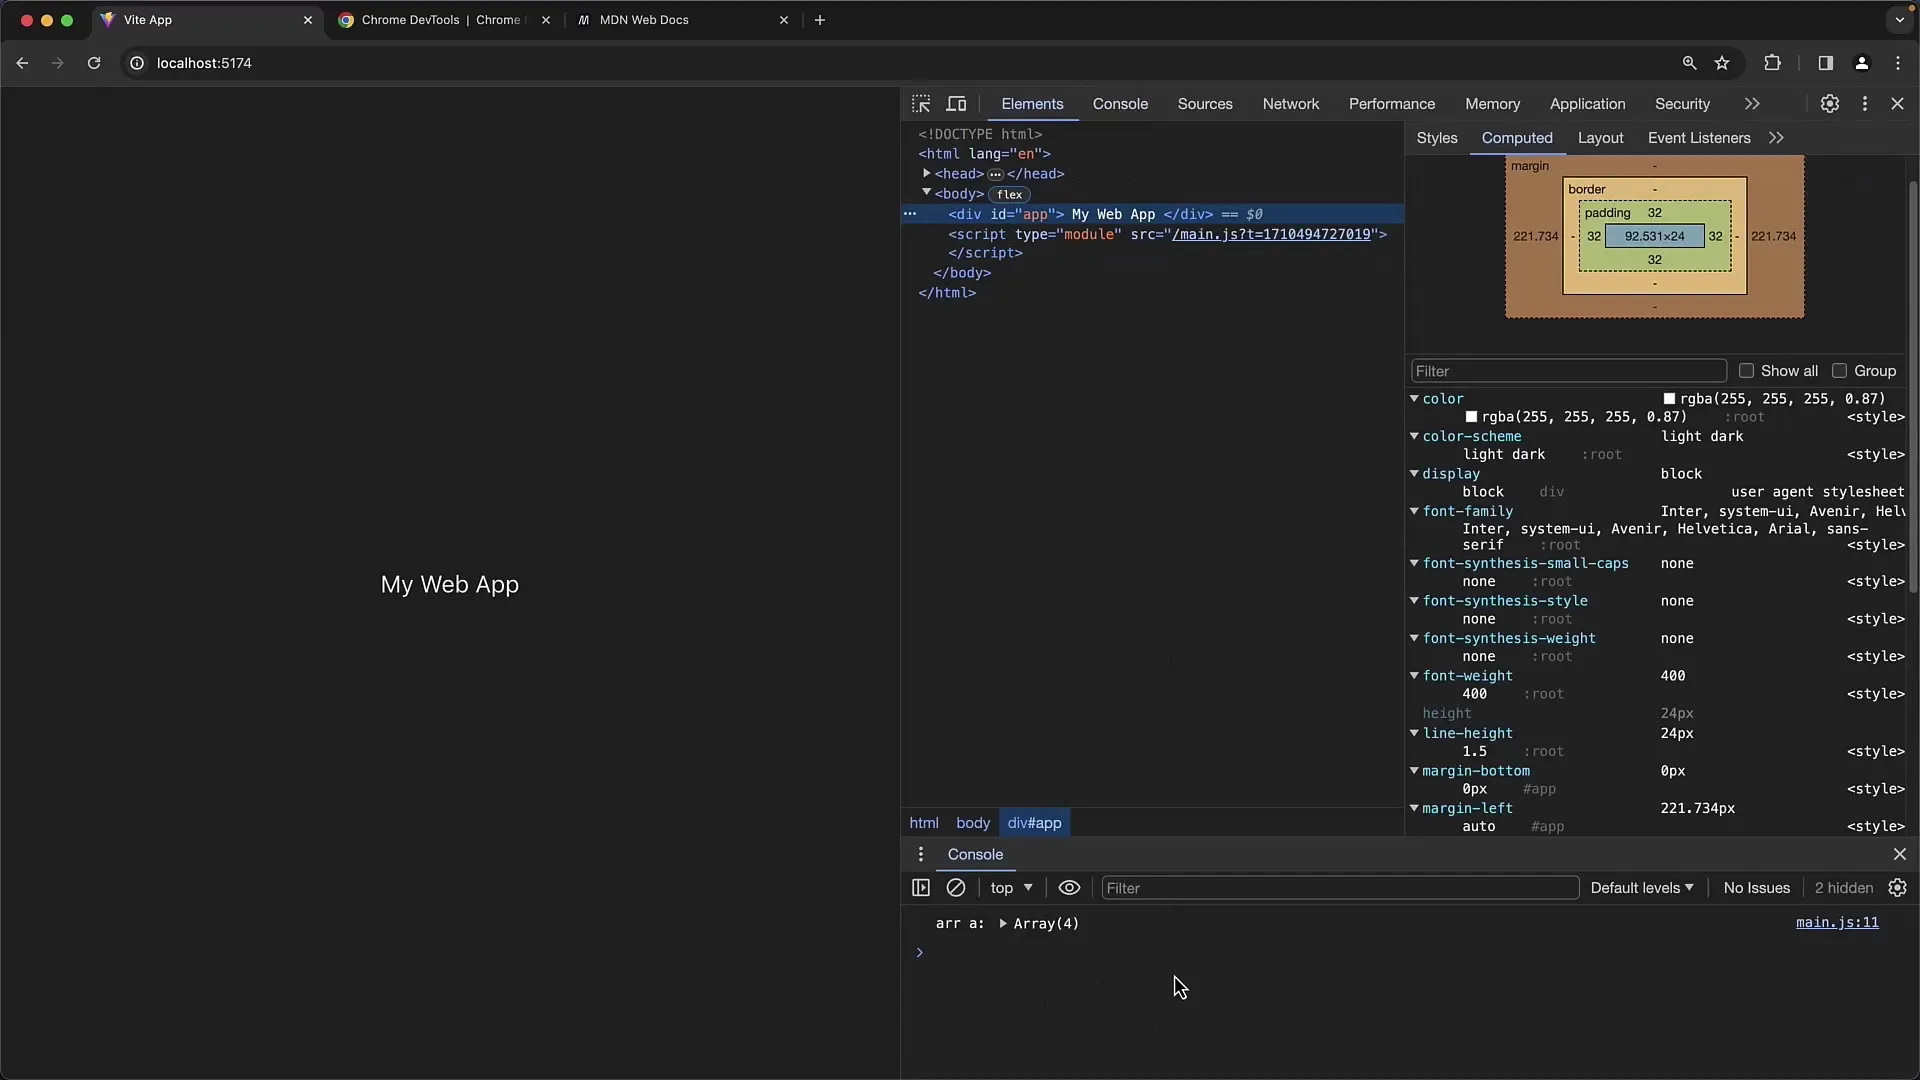
The "Console" Panel is extremely versatile and is required in many development scenarios. Here, you can manually execute JavaScript commands, monitor log outputs, and view error logs. When you open the console, you automatically see all log outputs generated by your webpage. Press the Escape key to toggle the console on or off as needed.
Step 6: Debugging Source Code with "Sources"
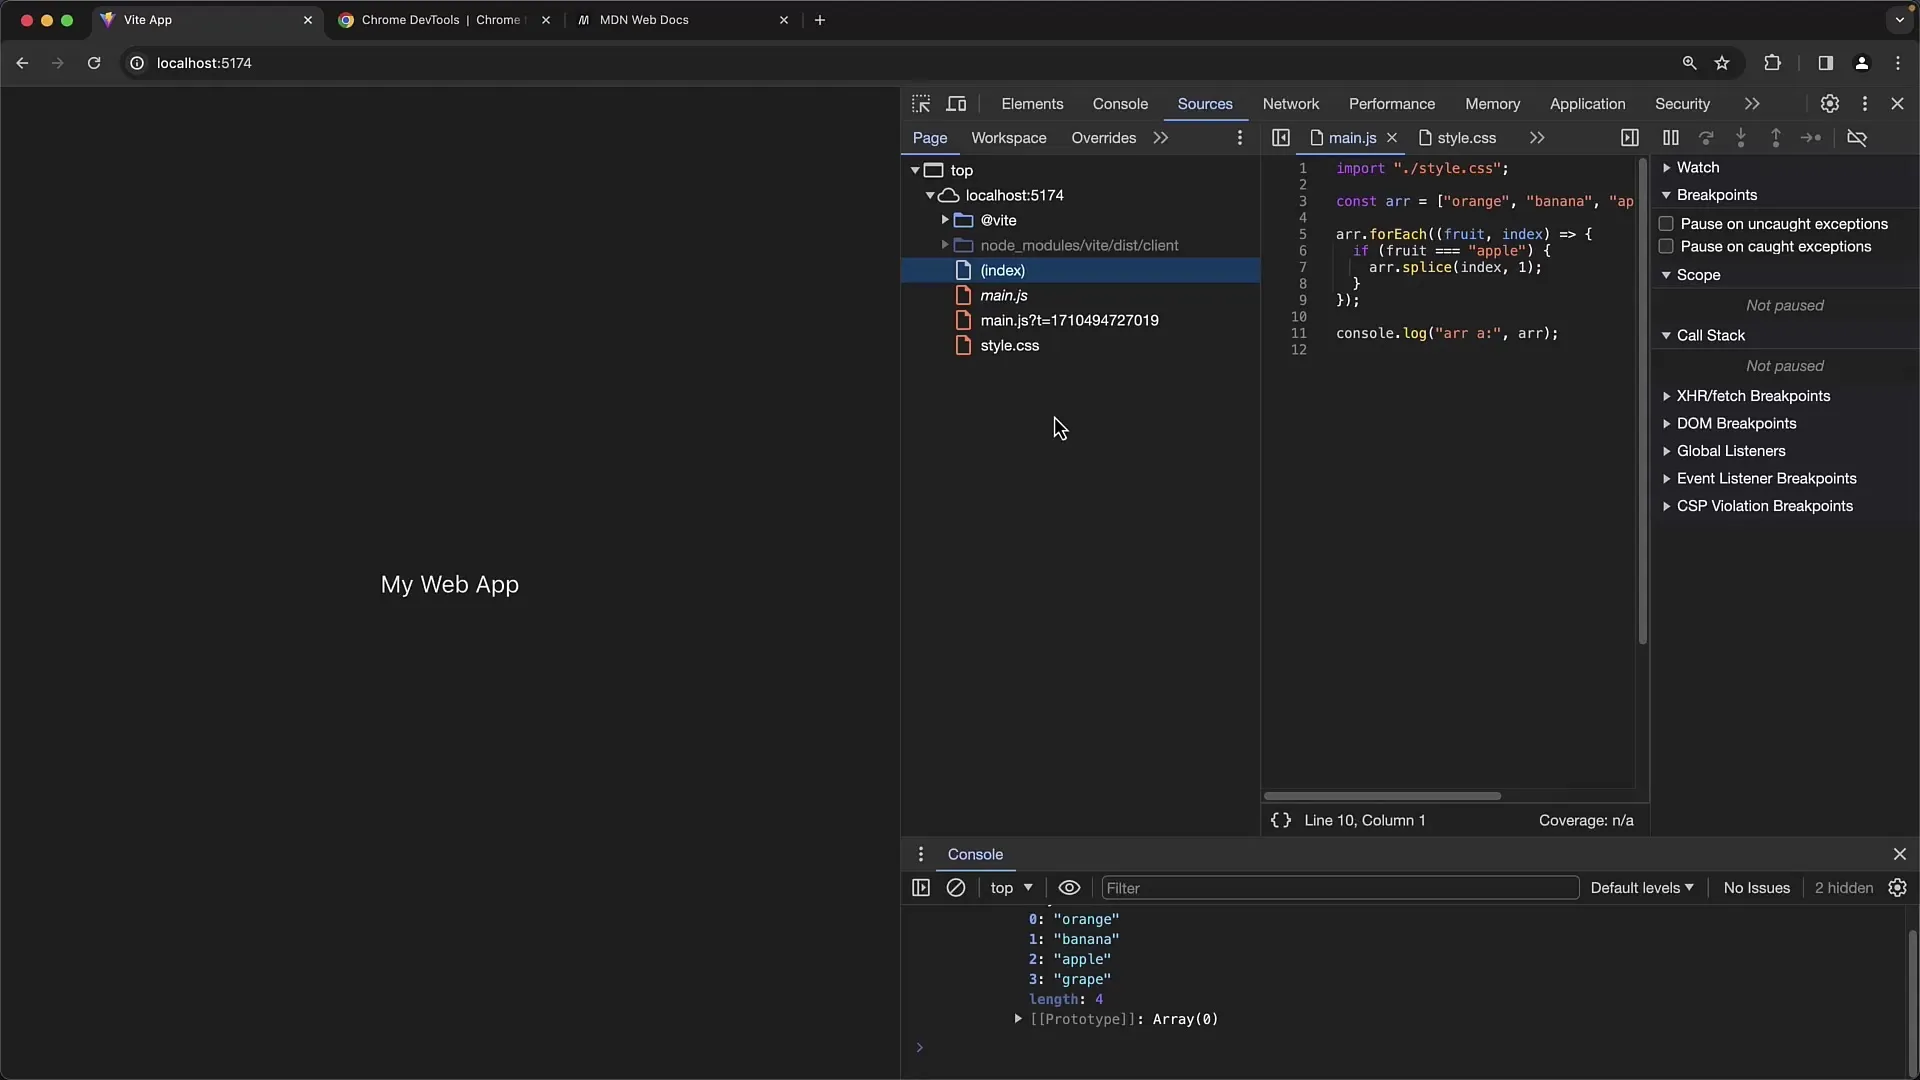
In the "Sources" Panel, you can view the source code files of your project and perform debugging as needed. You can set breakpoints to step through your application. This is especially useful for meticulously reviewing the flow of your code and finding errors. The file structure here is also organized similarly to an integrated development editor.
Step 7: Monitoring Network Activity
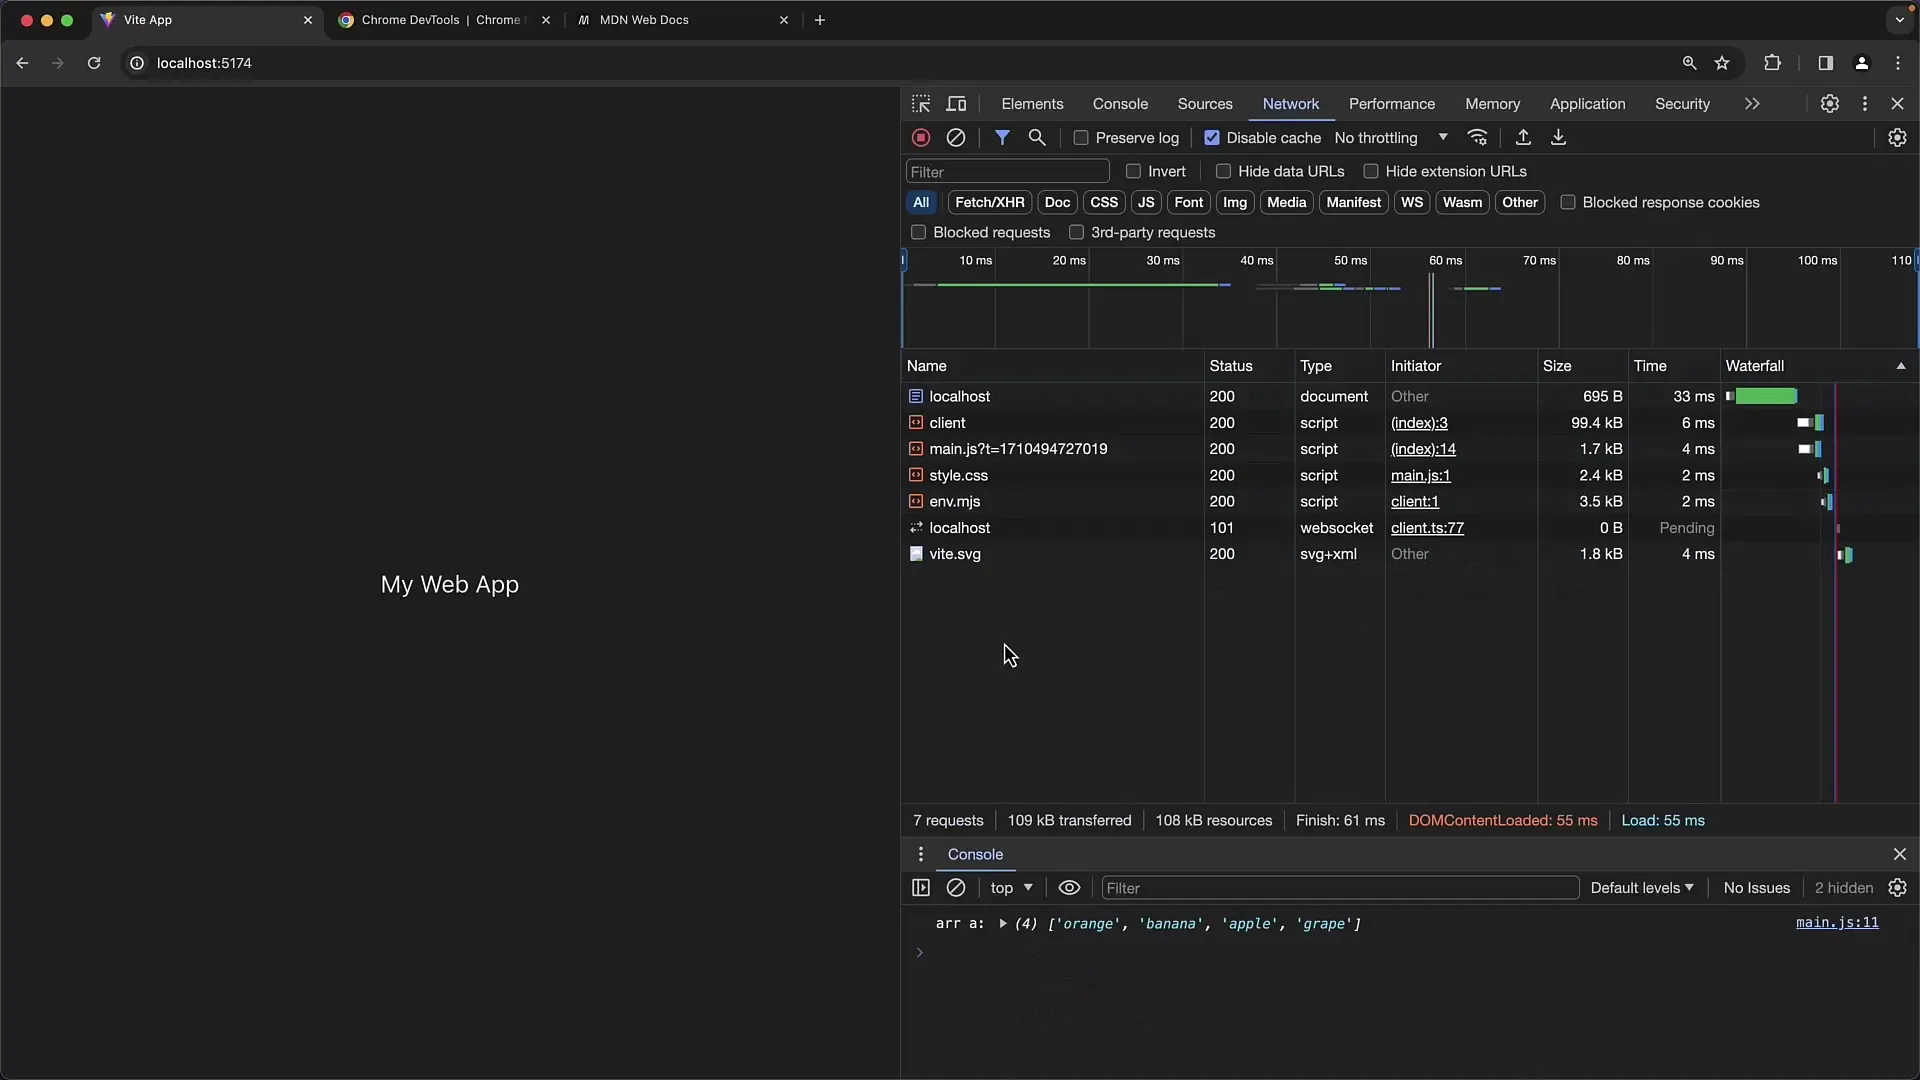
The "Network" Panel shows you all the resources requested over the network when loading your webpage. After a page reload, you can see the individual requests, their load times, and the respective response codes. Here, you can also disable the cache to ensure you see the latest and uncached data.
Step 8: Performance and Memory
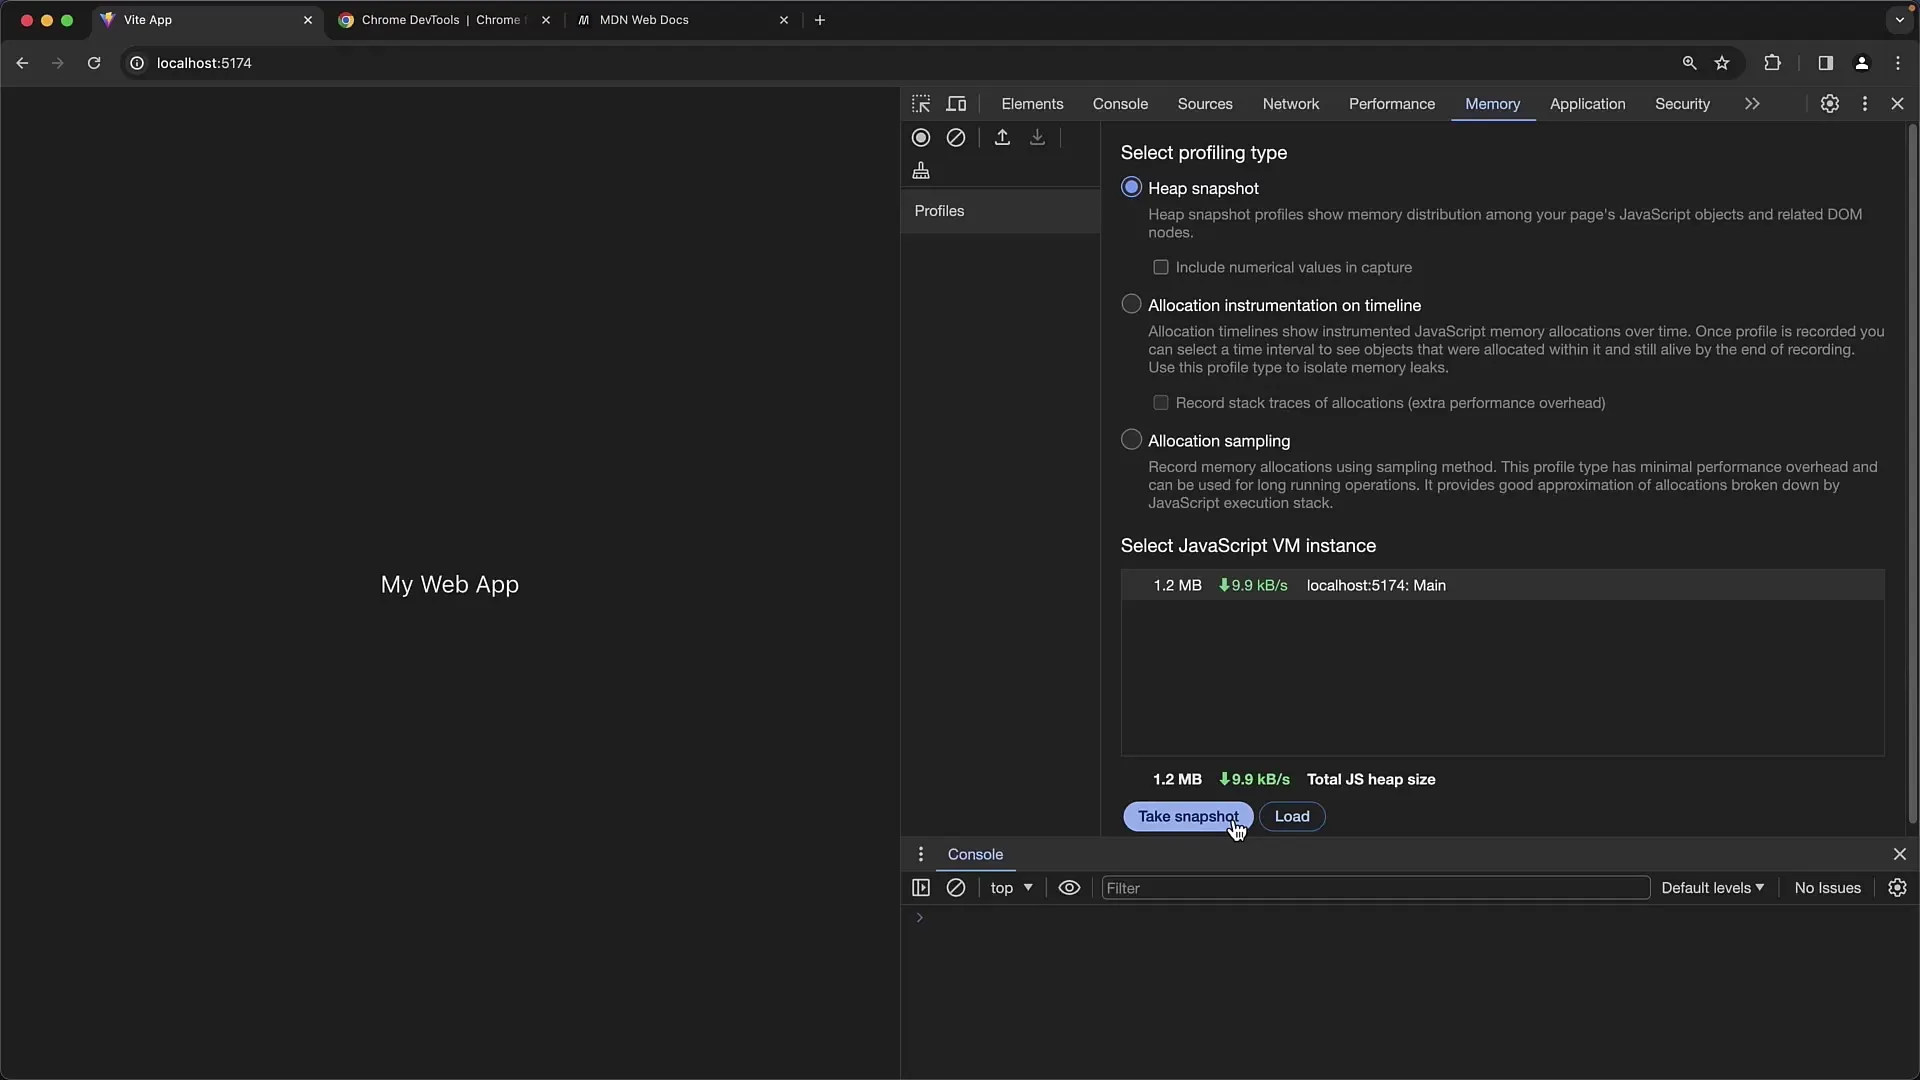
In the "Performance" tab, you can analyze your application's performance and take profile snapshots to analyze script speed and rendering times. The "Memory" Panel gives you insight into your webpage's memory consumption and helps you identify memory leaks by taking snapshots and comparing their usage.
Step 9: Check Application Storage
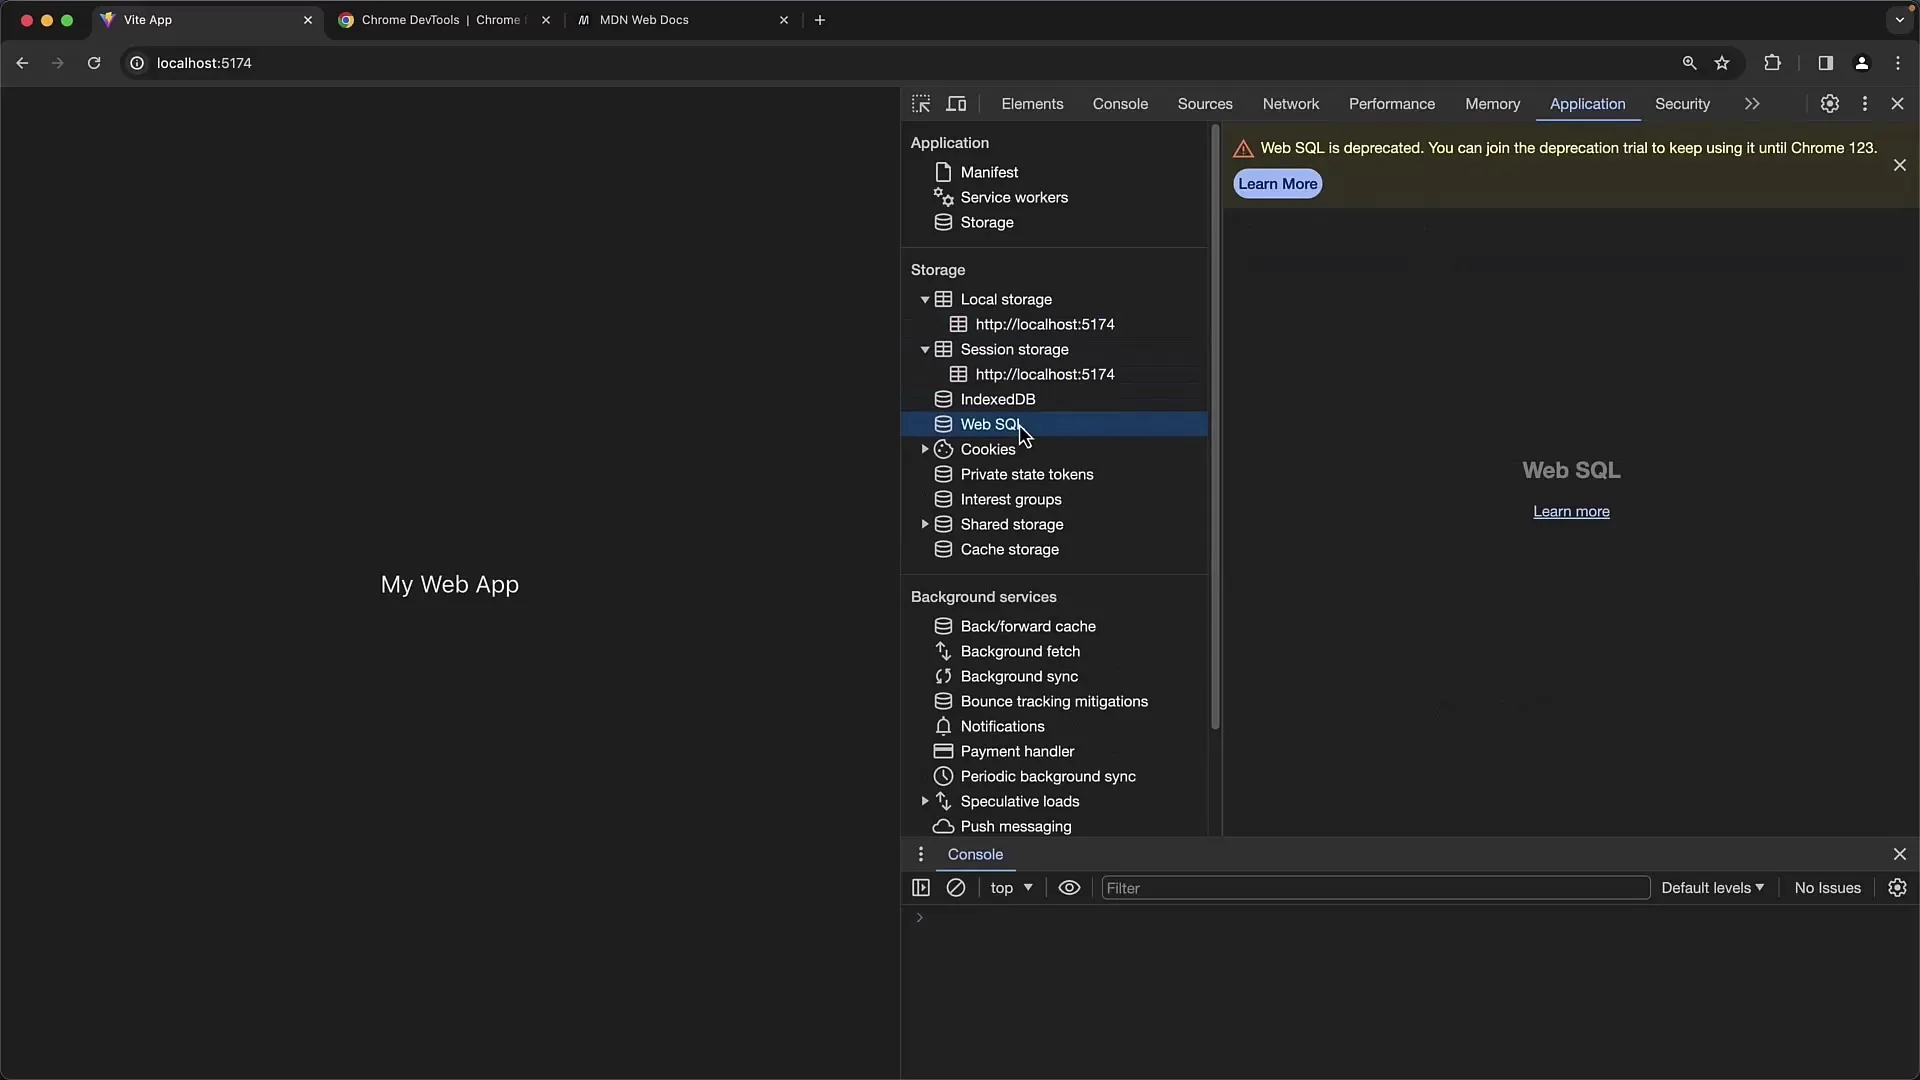
The "Application" panel is important for monitoring the various storage options of the web application, including "local storage", "session storage", and Cookies. Here you can view the entire browser storage of your application, especially what is stored locally on the client.
Step 10: Security and Optimization Tips
Finally, the "Security" panel provides an overview of the security aspects of your website, while the "Performance Insights" panel gives you tips to optimize your website to improve loading speed and user-friendliness.
Summary
In this guide, you have received a comprehensive overview of the key features of the Chrome Developer Tools. You now know how to open the tools, use the different panels, and perform specific techniques like debugging and performance analysis. The knowledge you have gained here is fundamental for effective web development.
Frequently Asked Questions
How do I open Chrome Developer Tools?Chrome Developer Tools can be opened by pressing F12, Command + Shift + C (Mac), or Ctrl + Shift + C (Windows).
What does the "Console" panel show?The "Console" panel displays log outputs, error logs, and allows you to manually execute JavaScript commands.
How can I customize the view of Developer Tools?You can customize the view of Developer Tools in a split-screen mode or in a separate window and adjust it to a second monitor.
What does the "Network" panel offer?The "Network" panel displays all network activities, loading times, and response codes when communicating with the server.
How can I check my website's performance?With the "Performance" tab, you can record and analyze performance profiles, while the "Memory" panel helps you identify memory issues.


