In this guide, you will learn how to debug and set breakpoints in JavaScript code using the Chrome Developer Tools. Debugging is one of the fundamental skills in the software development process. With the Developer Tools, you can analyze the execution of your code, monitor variable values, and find errors before using your code in production.
Using the Developer Tools, especially setting and using breakpoints, allows you to precisely observe the state of your application and apply powerful debugging techniques. We will guide you step by step through the process so that you can independently use these important skills.
Key Takeaways
- Chrome Developer Tools offer extensive features for debugging JavaScript.
- Breakpoints help you pause code execution to inspect the application's state.
- By using the tools correctly, you can quickly identify and fix errors.
Step-by-Step Guide
Step 1: Access Developer Tools
To begin, you need to open the Chrome Developer Tools. You can access them by right-clicking on the page and selecting "Inspect" or by using the keyboard shortcut Ctrl + Shift + I (Windows) or Cmd + Opt + I (Mac). This will open the Developer Tools on the right side of your browser.
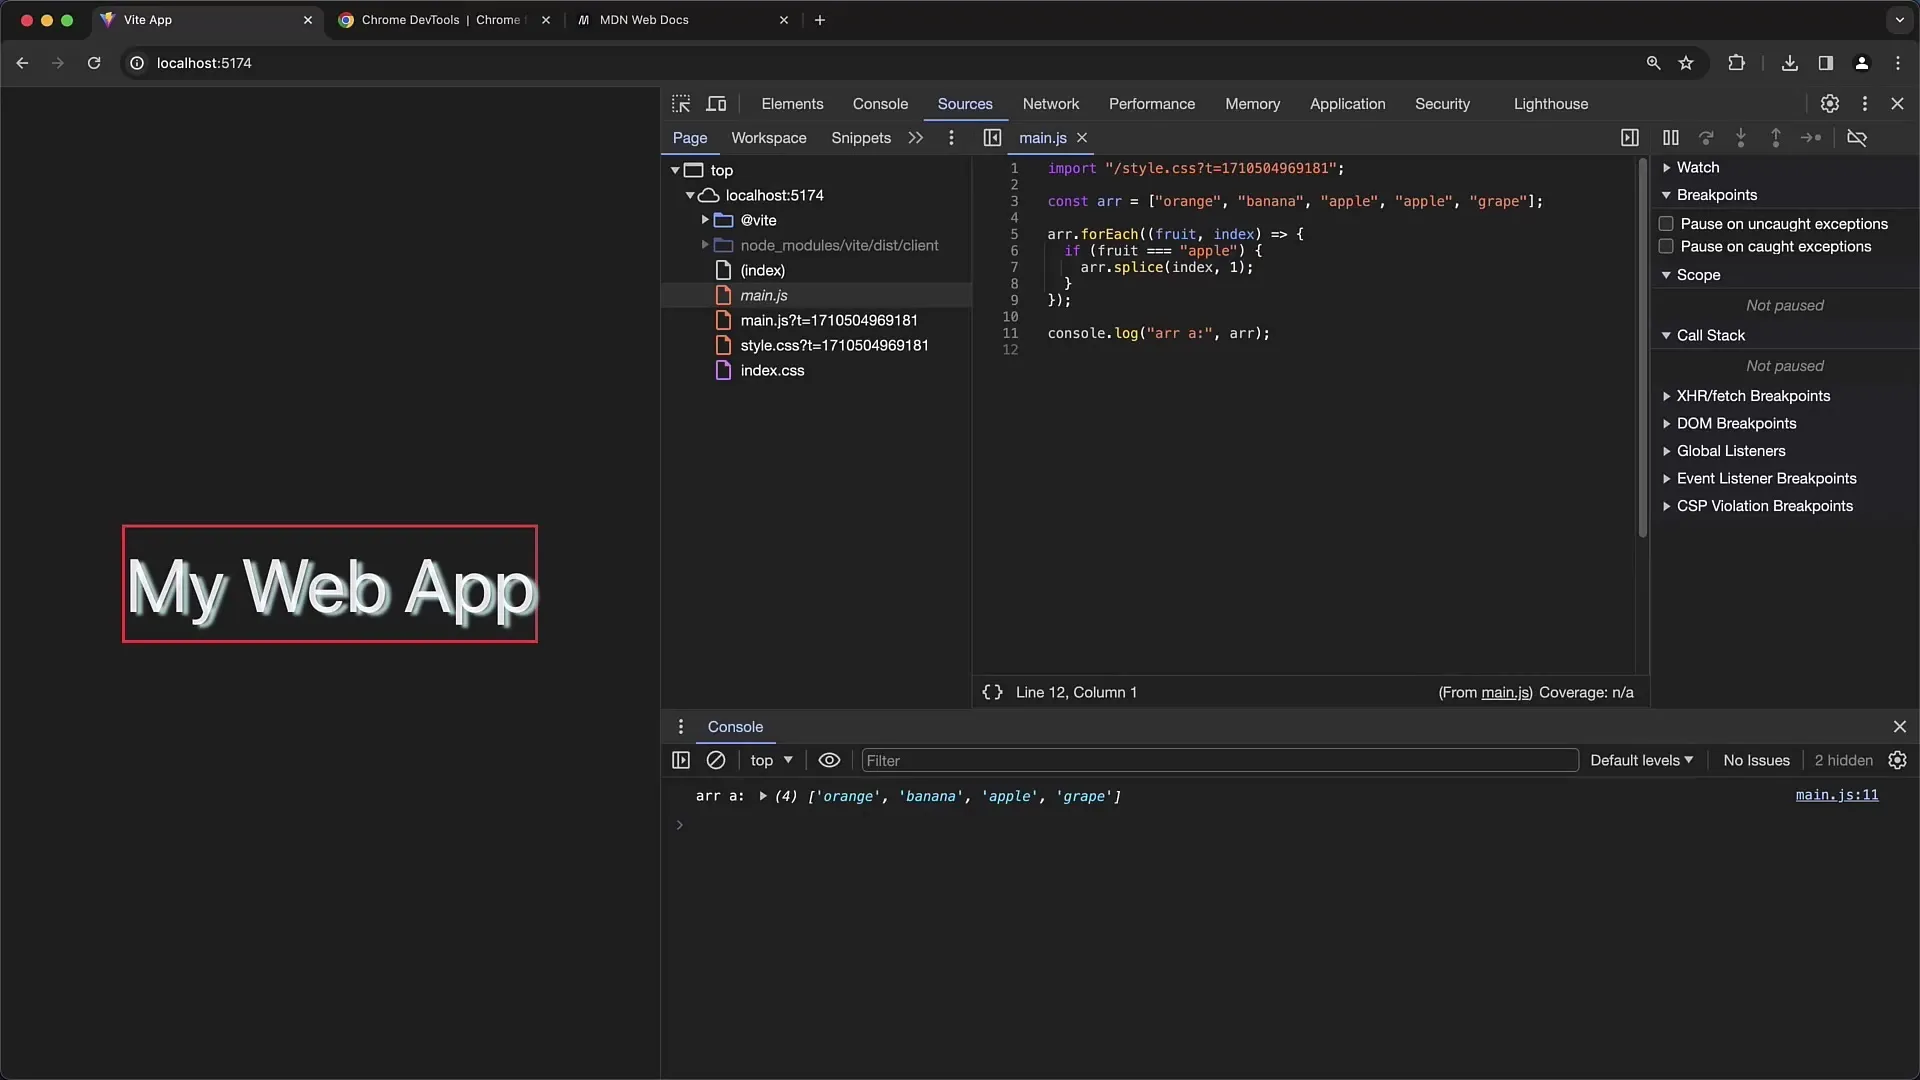
Step 2: Navigate to the "Sources" Tab
In the Developer Tools, you will find several tabs at the top. Click on the "Sources" tab to access the scripts and the structure of your application. Here, you can view all loaded scripts and resources that your website uses.
Step 3: Select the File for Debugging
In the Sources tab, you can see the scripts loaded by your page. Look for the JavaScript file you want to debug. Make sure you select the correct file, especially if there are multiple versions of a file, such as sourcemaps.
Step 4: Set a Breakpoint
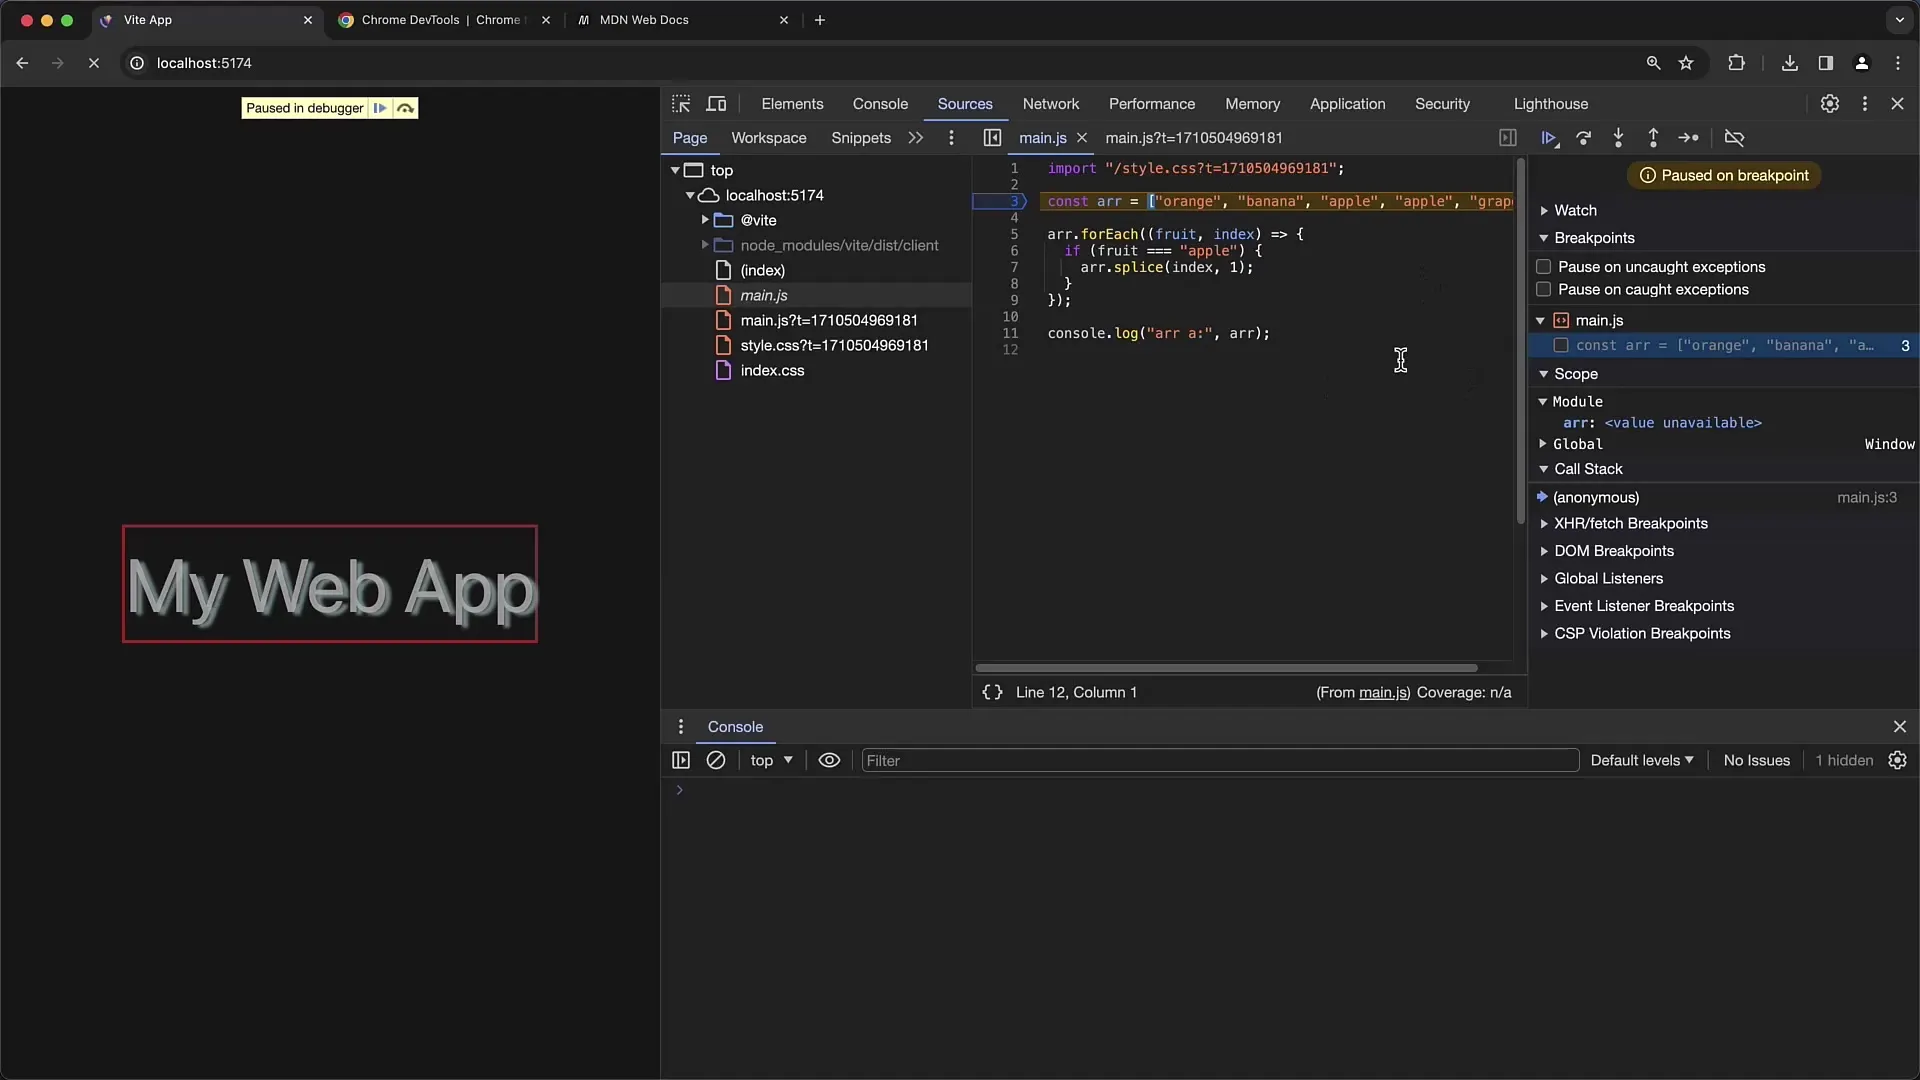
To set a breakpoint, simply click on the line number to the left of the code where you want to pause execution. A blue dot will appear, indicating that the breakpoint has been successfully set. This will help you pause execution at that point and inspect the state of the variables.
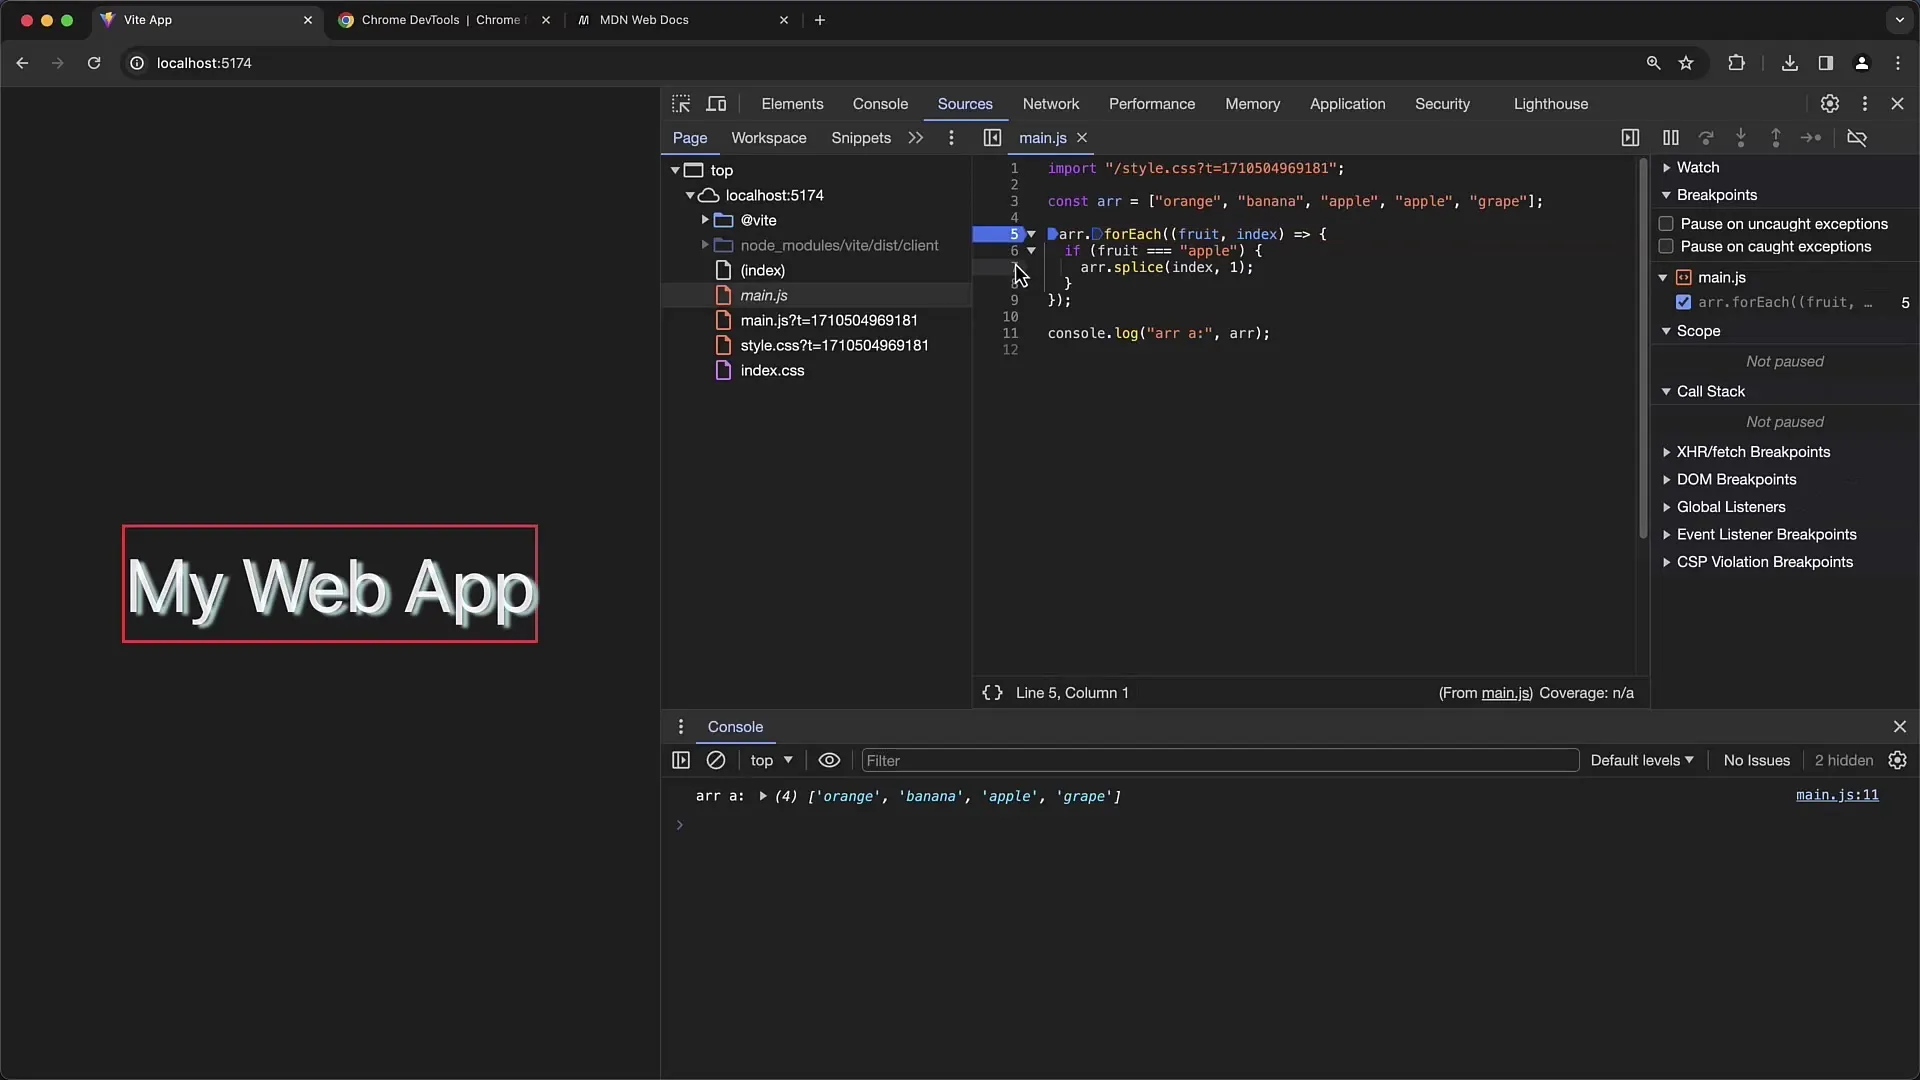
Step 5: Refresh the Page
To reach the breakpoint, refresh the page. You can do this by pressing F5 or clicking the refresh button in the address bar. The execution should pause at the point where you set the breakpoint.
Step 6: Inspect the Execution
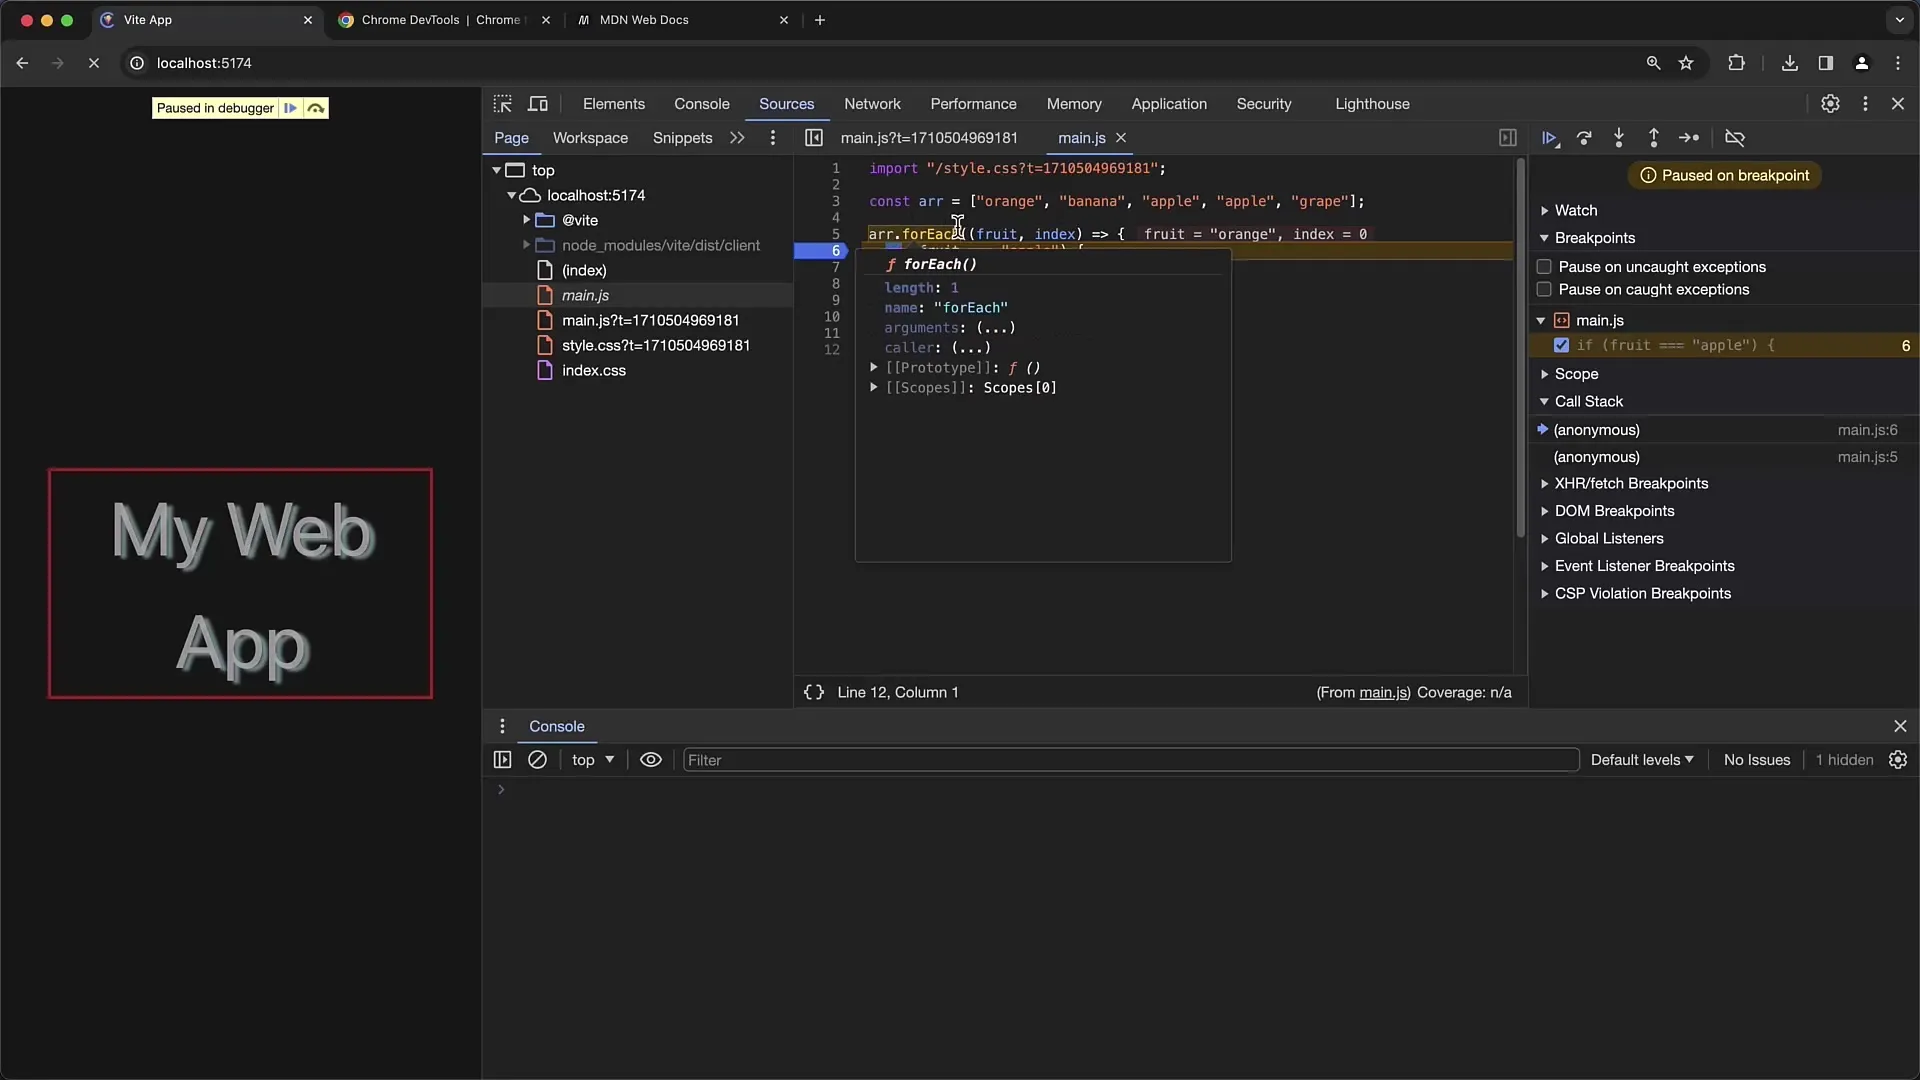
After the execution pauses at your breakpoint, you can inspect the current state of your application. On the right side, you can see variable values, the call stack, and the current scope. This information is crucial for understanding what is happening in your application.
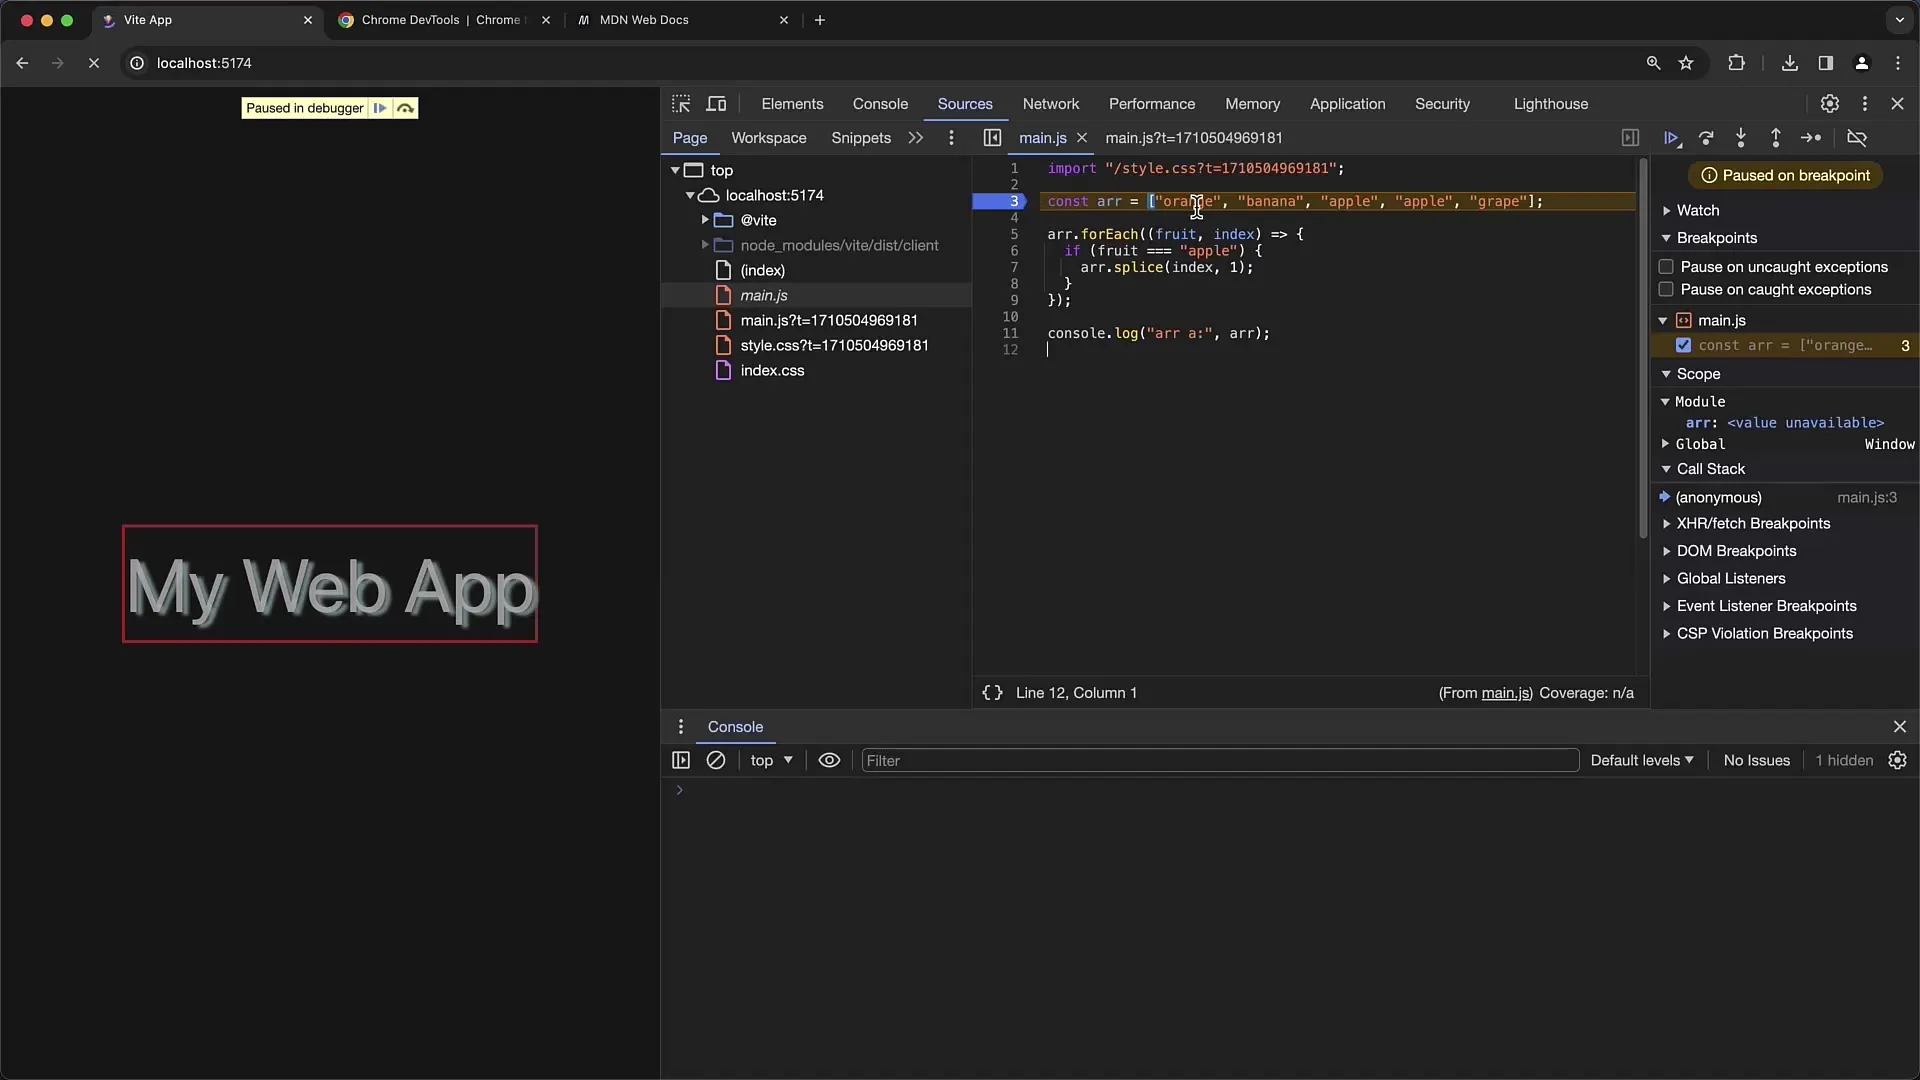
Step 7: Resume or Inspect Variables
You can either resume the program until the next breakpoint or go through it line by line. To continue to the next breakpoint, simply click on the "Play" button. If you want to go through line by line, you can use "Step over" or "Step into" to maintain detailed control.
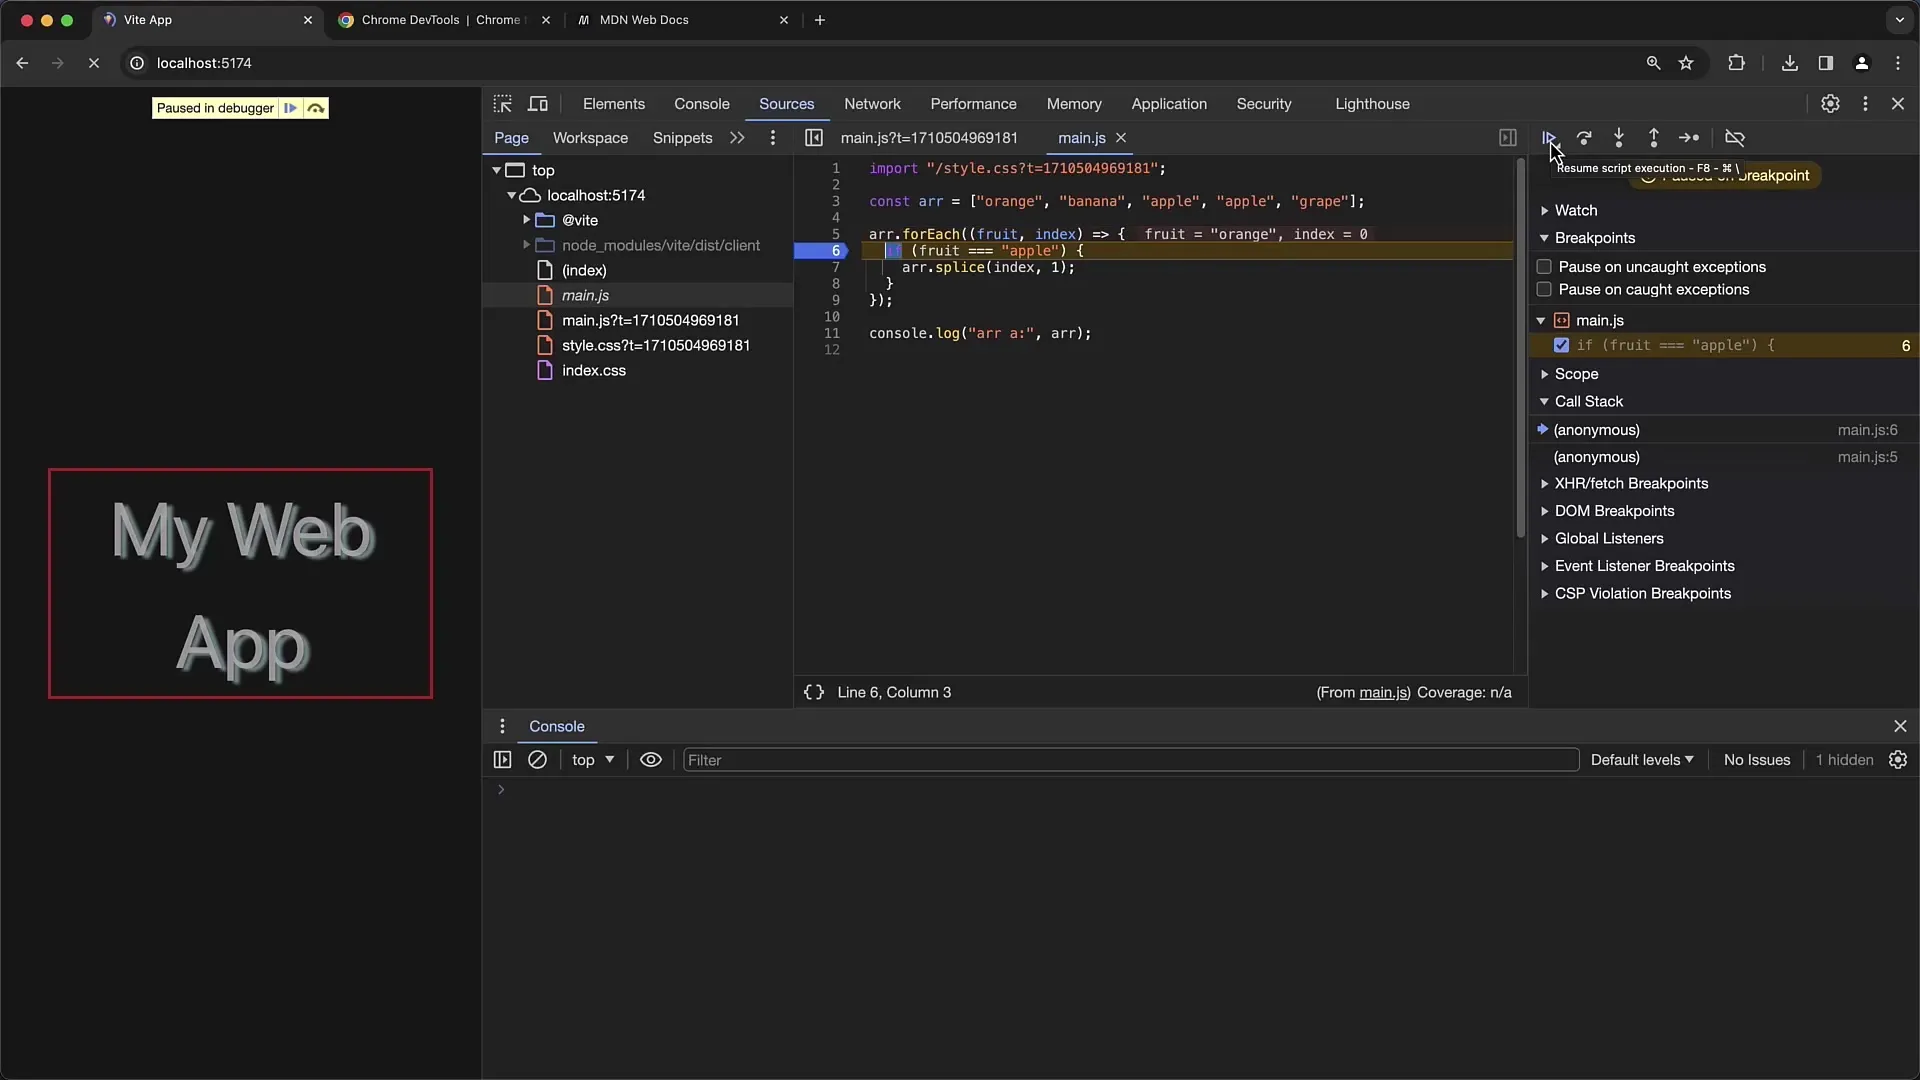
Step 8: Make Variable Changes
If you want to change the value of a variable, you can do so directly in the scope area. Click on the variable, change the value, and then click "Play" again. This will help you test how different values affect the behavior of your application.
Step 9: Remove Breakpoints as Needed
If you no longer need the breakpoints or want to remove them all at once, you can simply delete them by right-clicking on the line number and selecting "Remove Breakpoint." Alternatively, you have the option to remove all breakpoints at once if you have set many of them.
Step 10: Use Call Stack and Debugging Options
Use the Call Stack view to see where the current function was called from. This helps you trace the execution path of the application. Chrome Developer Tools also provide many useful features like "Pause on Exceptions" to identify errors and get deeper insights into problems.
Summary
In this guide, you have learned how to effectively use Chrome Developer Tools for debugging JavaScript. The process includes setting breakpoints, examining variables and the call stack, as well as making changes to variables during runtime. With these skills, you are well-equipped to identify and fix errors.
Frequently Asked Questions
How do I set a breakpoint in my JavaScript file?Simply click on the line number in the desired line of your code.
What should I do if my breakpoint is not triggered?Check if the file where the breakpoint is set is actually being loaded, and make sure no variables are being overwritten during loading.
How can I remove all breakpoints at once?Right-click on the line number of a breakpoint and choose "Remove All Breakpoints".
What is a Call Stack?The Call Stack shows the traceability of your function calls, allowing you to see where your function was invoked.
How can I change the value of a variable during debugging?Click on the variable in the scope area, change the value, and then click "Play" to continue execution with the new value.


