Debugging web applications can be a challenging task, especially when dealing with complex frameworks like React. In this guide, I will show you how to effectively master debugging React applications using Google Chrome Developer Tools. I will focus on specific techniques to help you find and fix the most common errors. You should have knowledge in React to be able to understand the concepts.
Key Takeaways
- Understand the role of source maps in debugging your React app.
- Set breakpoints at strategic points to trace the flow of the application.
- Analyze the call stack to understand which functions are being called at what time.
Step-by-Step Guide
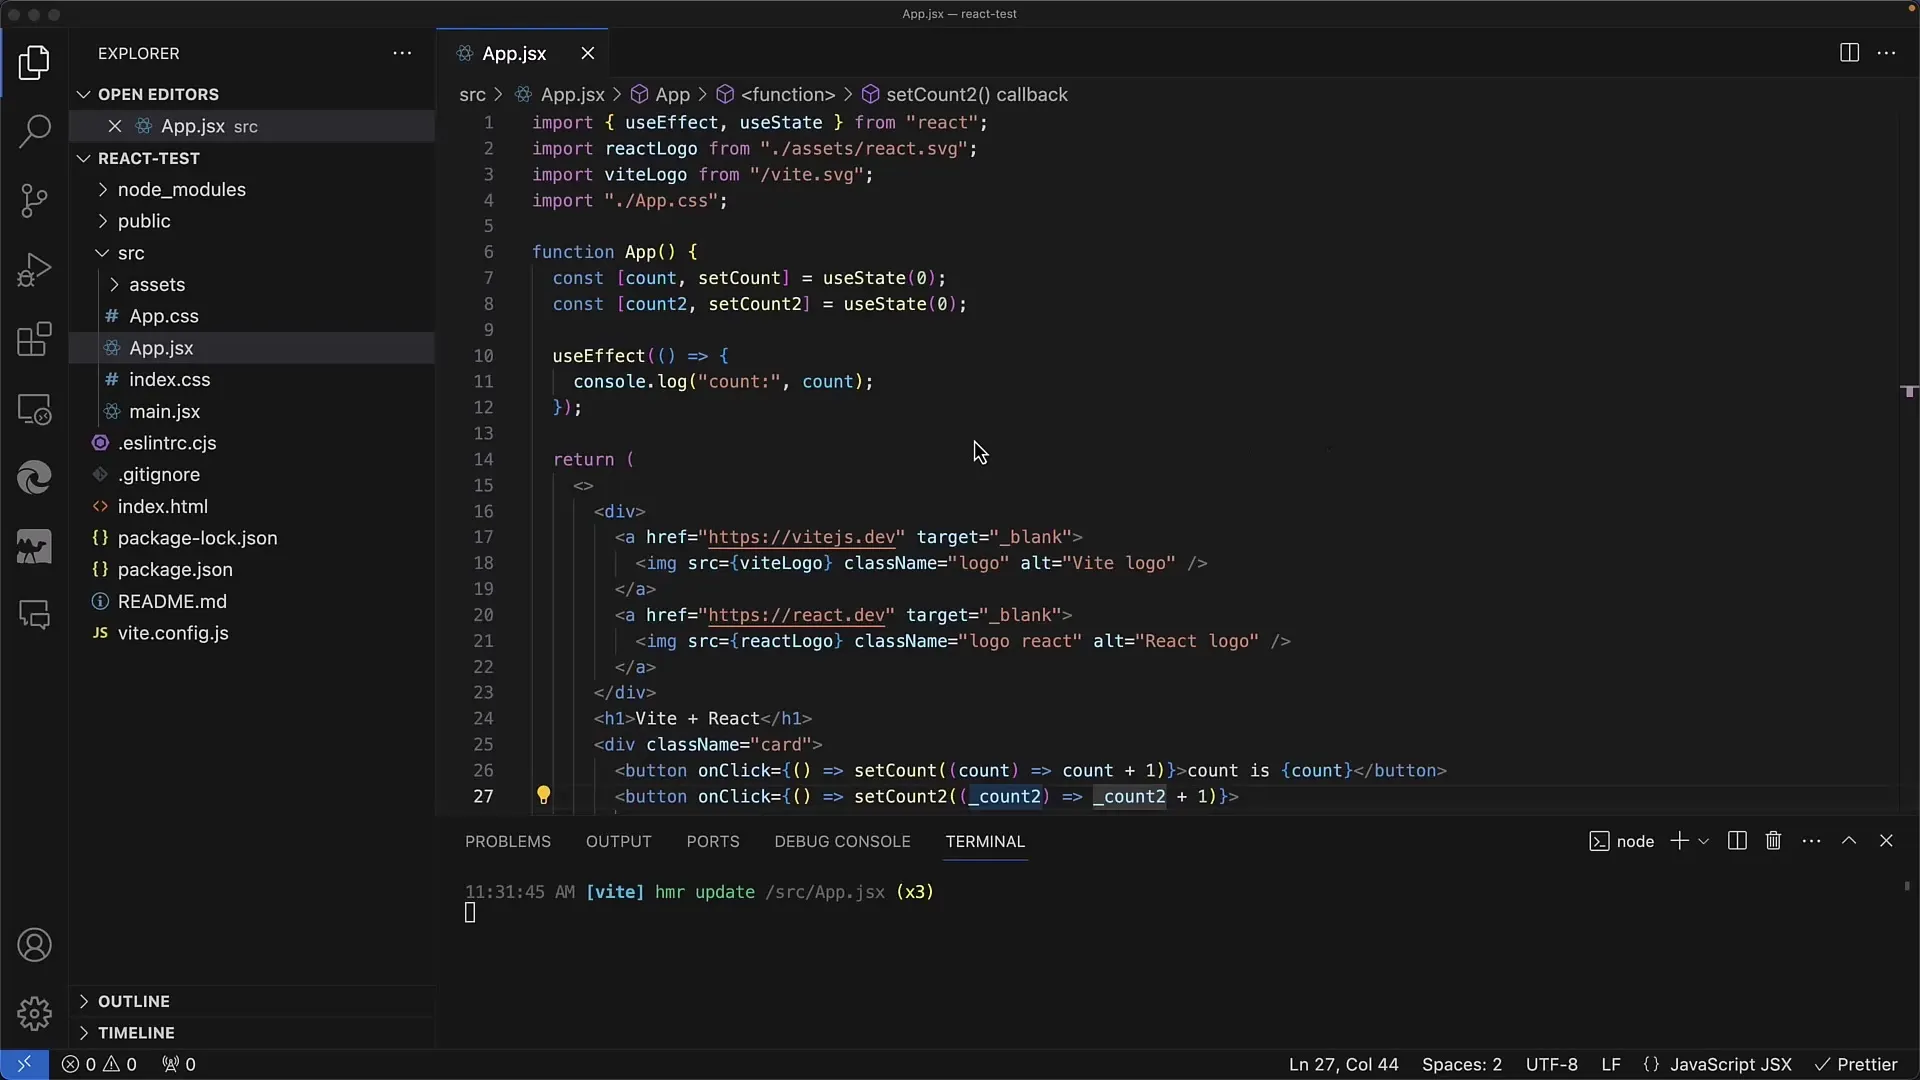
To start debugging, I have prepared a simple example of a React app that provides two buttons to increase counter values. We want to ensure that the state of the app is updated correctly.
First, open the Developer Tools in Chrome. You can do this by right-clicking on the page and selecting "Inspect" or simply by pressing the "F12" key.
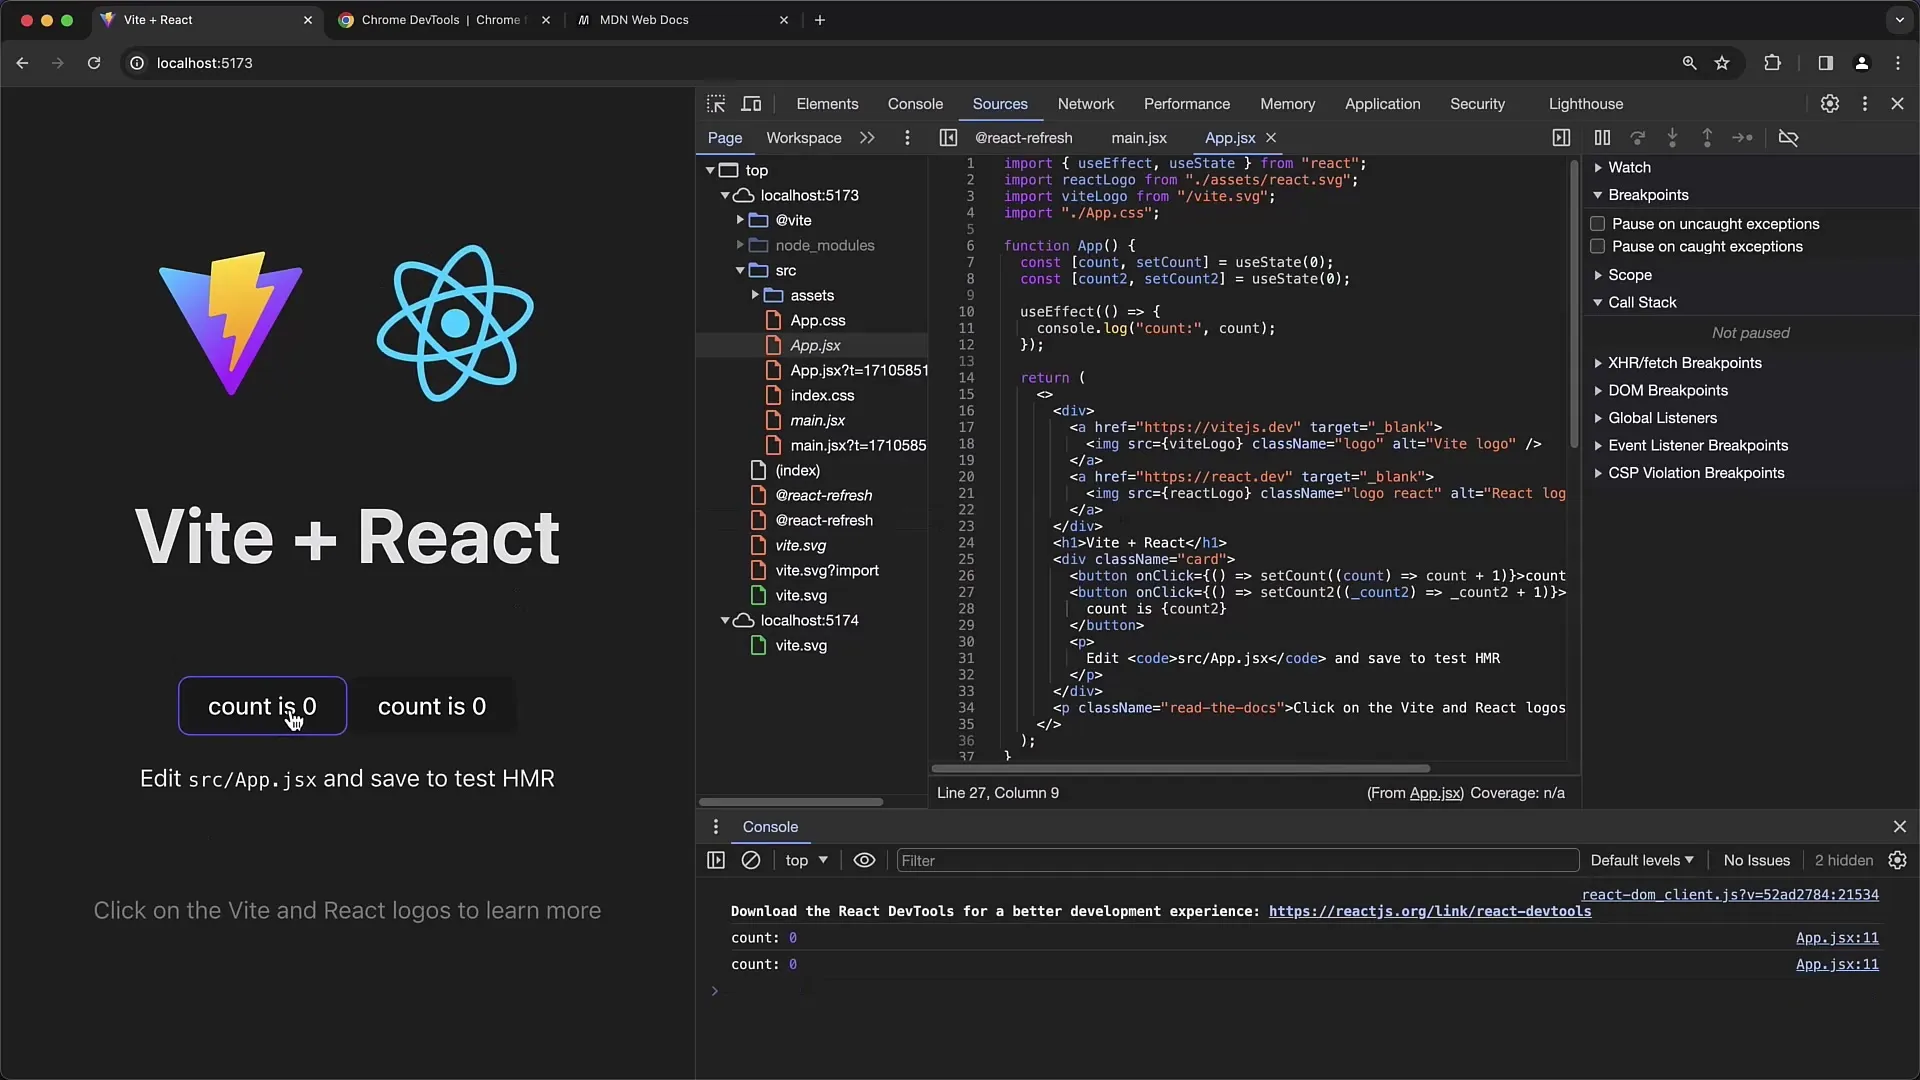
In the first step, reload your React app to ensure you are working with the current state. Once the app is loaded, you will see two buttons for counting. The first button increases the first counter, and the second button increases the second counter.
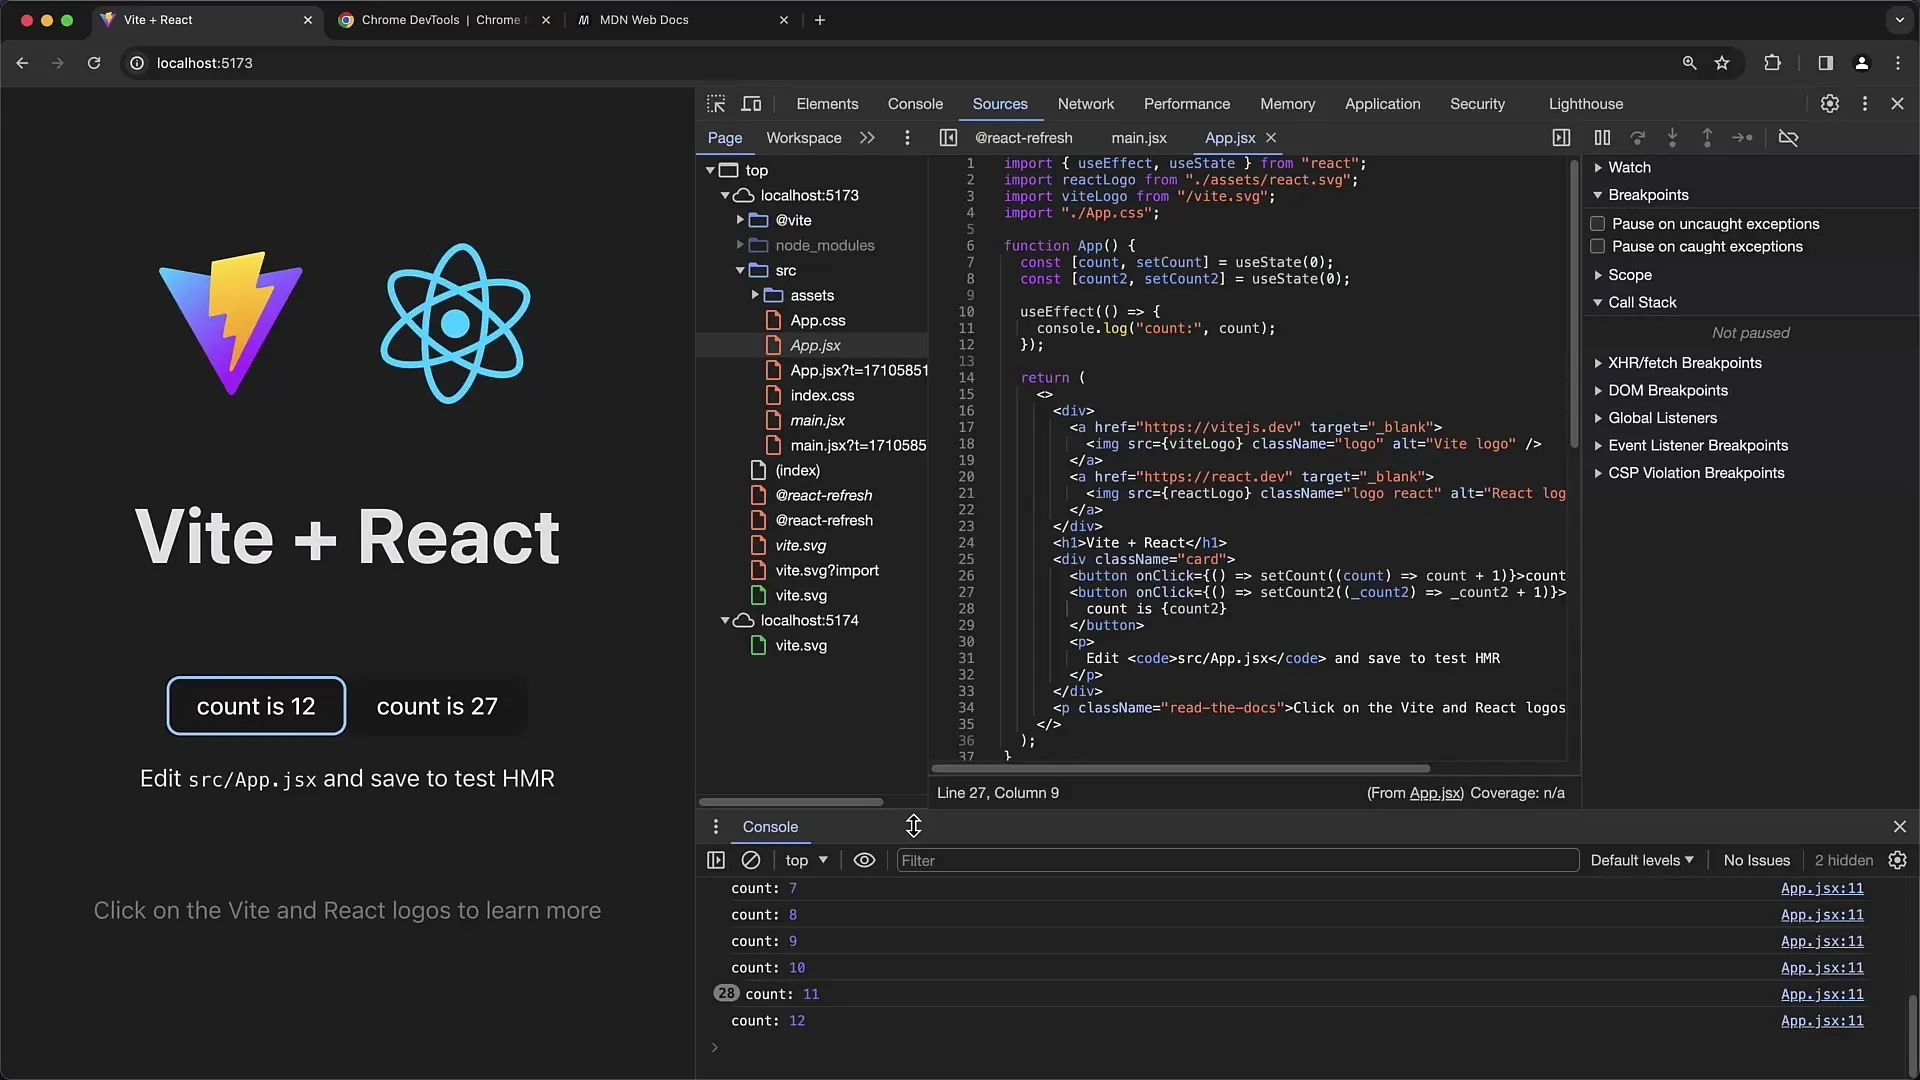
Here you can see that clicking the buttons increases the counter values visibly. You can monitor these increased values in the console, which you can also find in the Developer Tools. To show or hide the console, press "Escape" twice.
In the next step, you will modify the code of your app, specifically the useEffect Hook. The useEffect Hook is used to handle side effects in React. In my example, I have set it to output the current counter value in the console. This ensures you understand how often this effect is triggered.
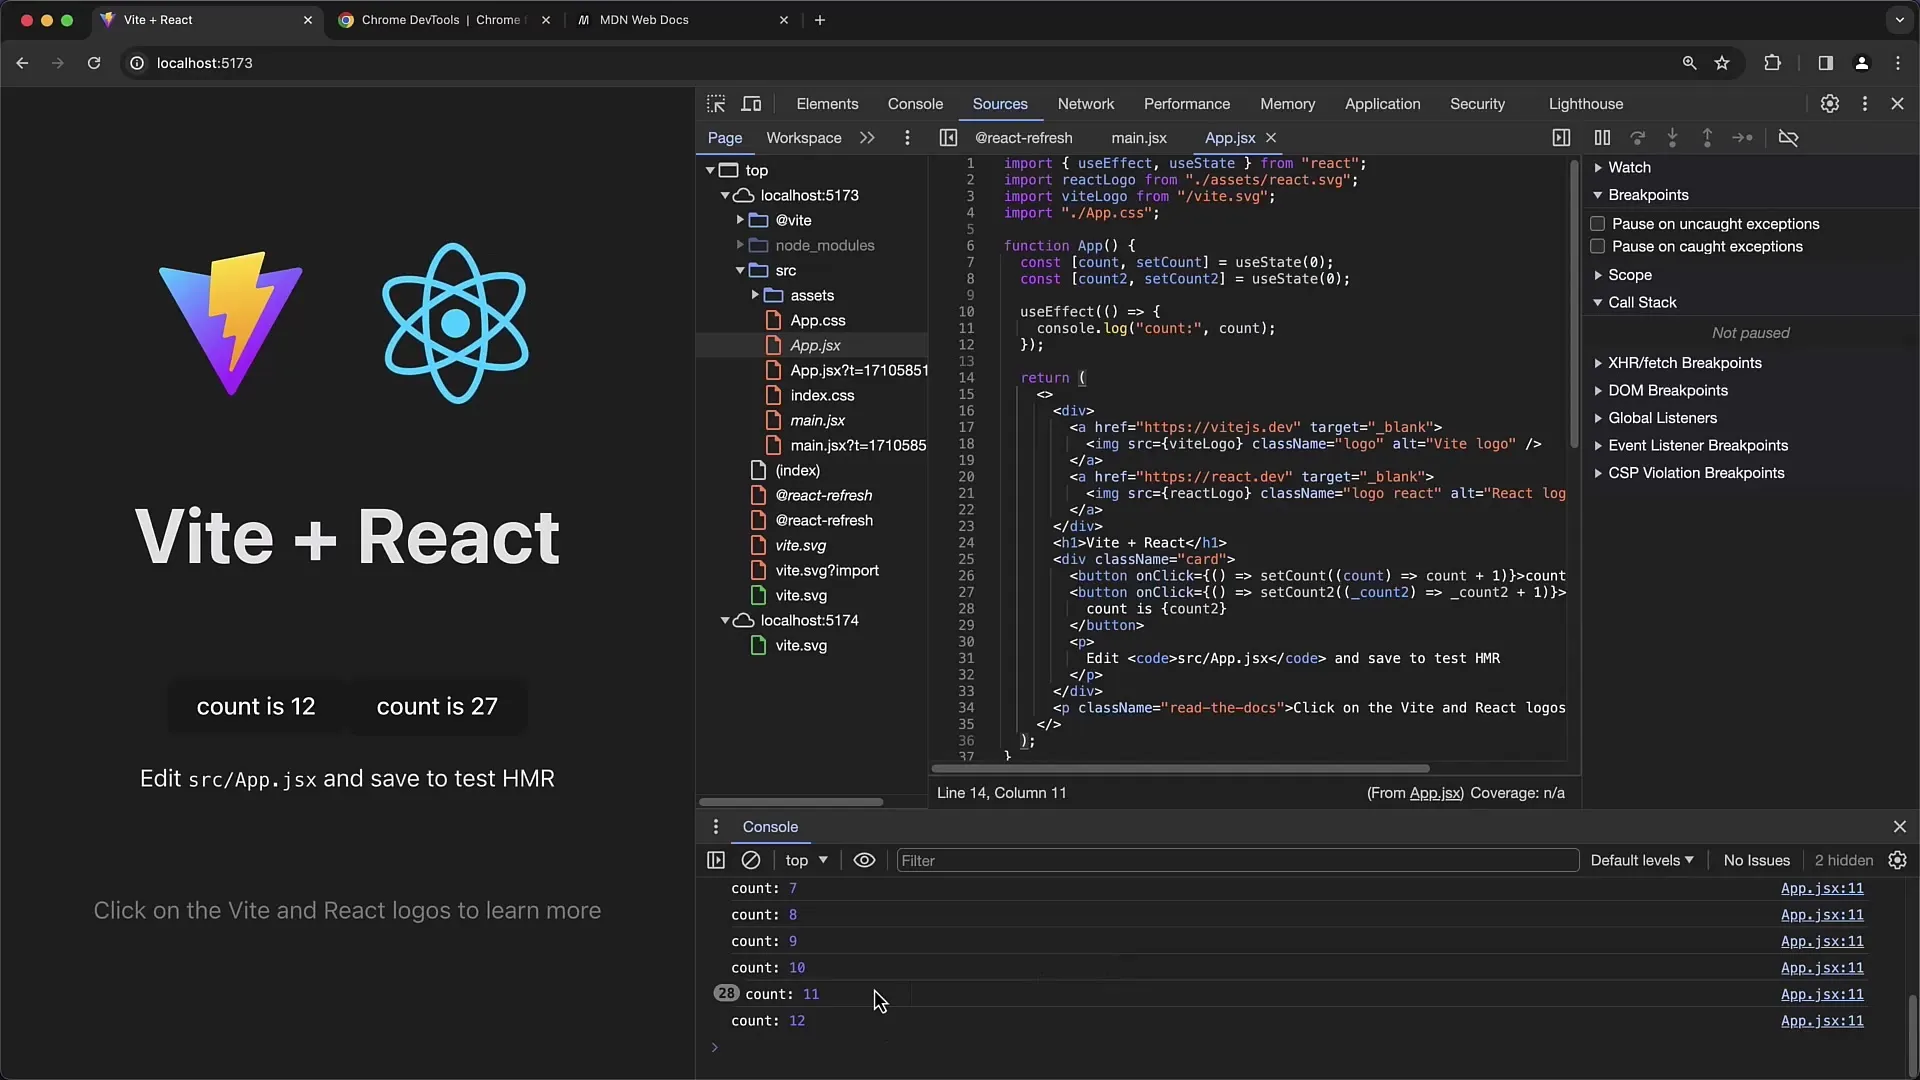
You can track the code through the console and check if the values are output correctly. However, if you do not specify the dependency array in useEffect correctly, this could lead to unexpected behavior.
To test this, remove the dependency array for a moment and observe what happens. Back in the app, you can now set a breakpoint. Click on the number in the left column to set the breakpoint.
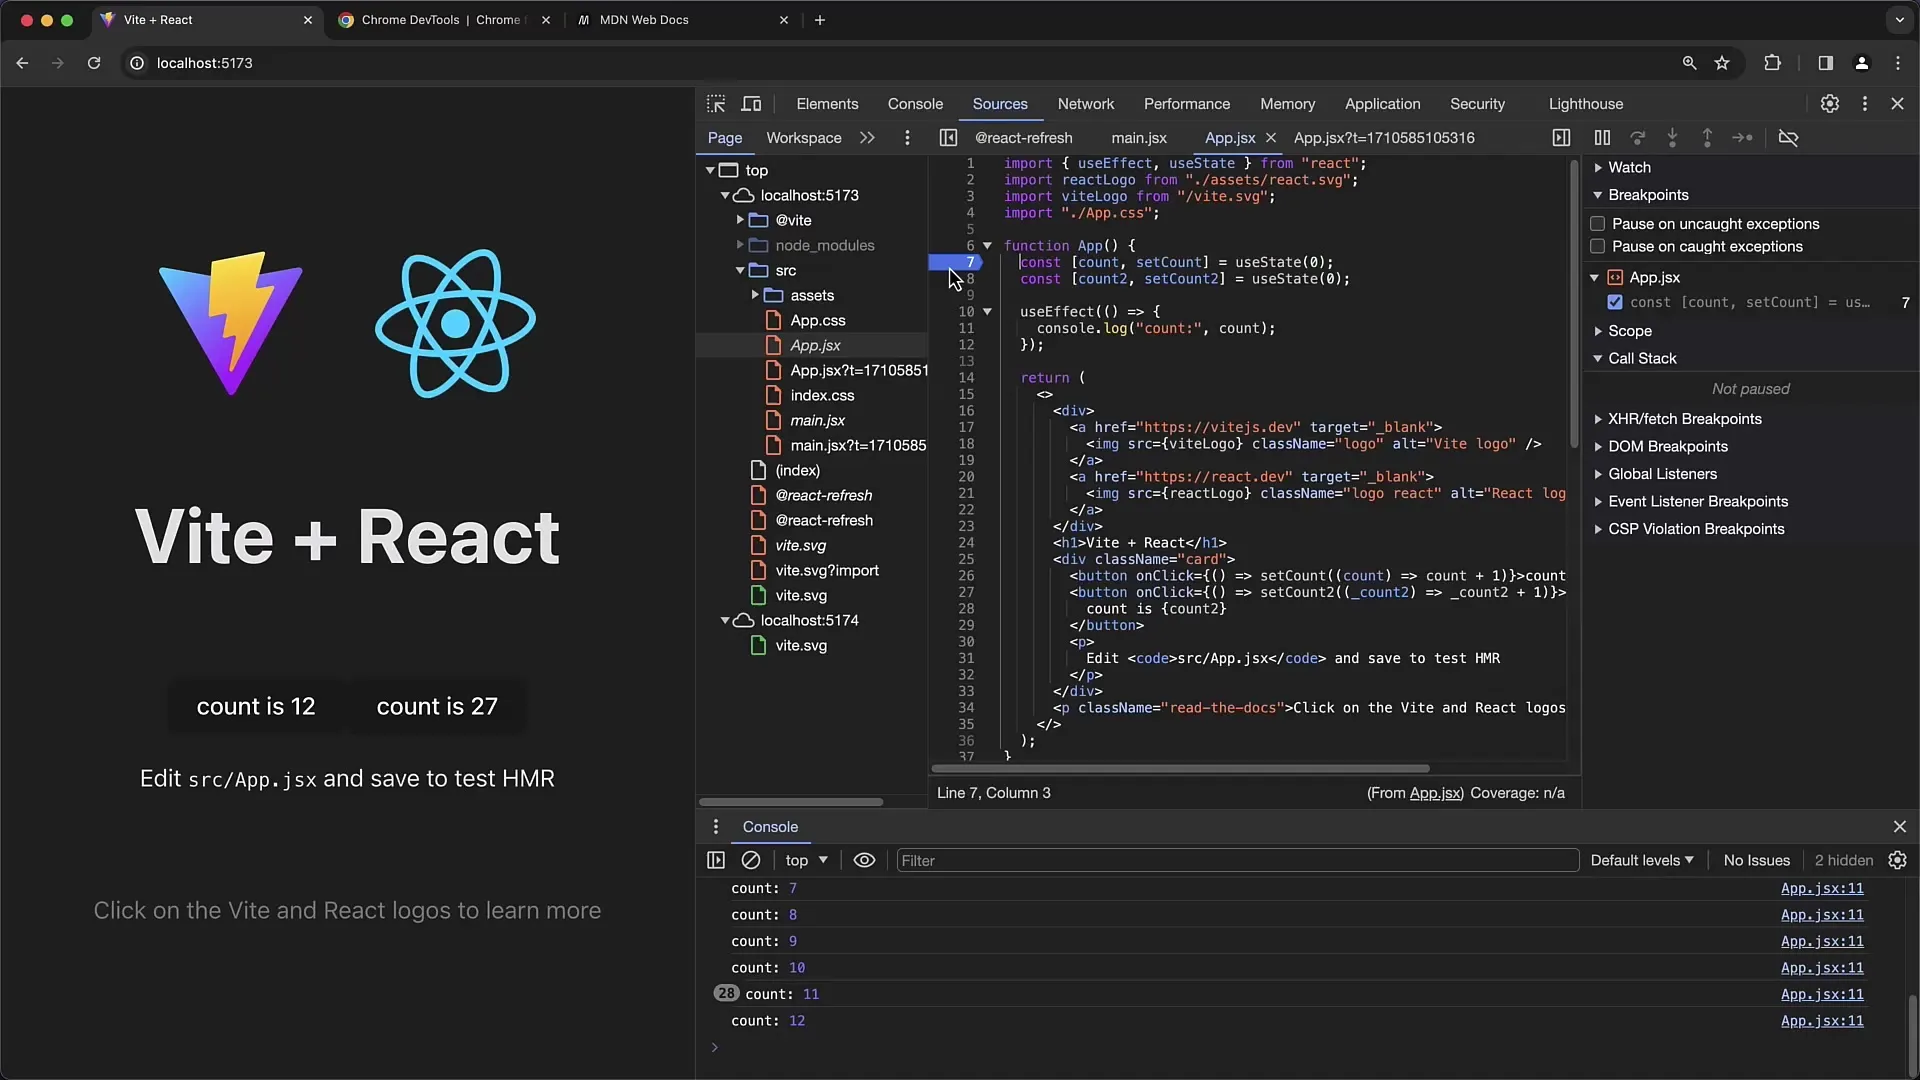
Now click the first button and observe that the execution pauses at the set breakpoint. This allows you to analyze the state of the application while the click handler is being executed.
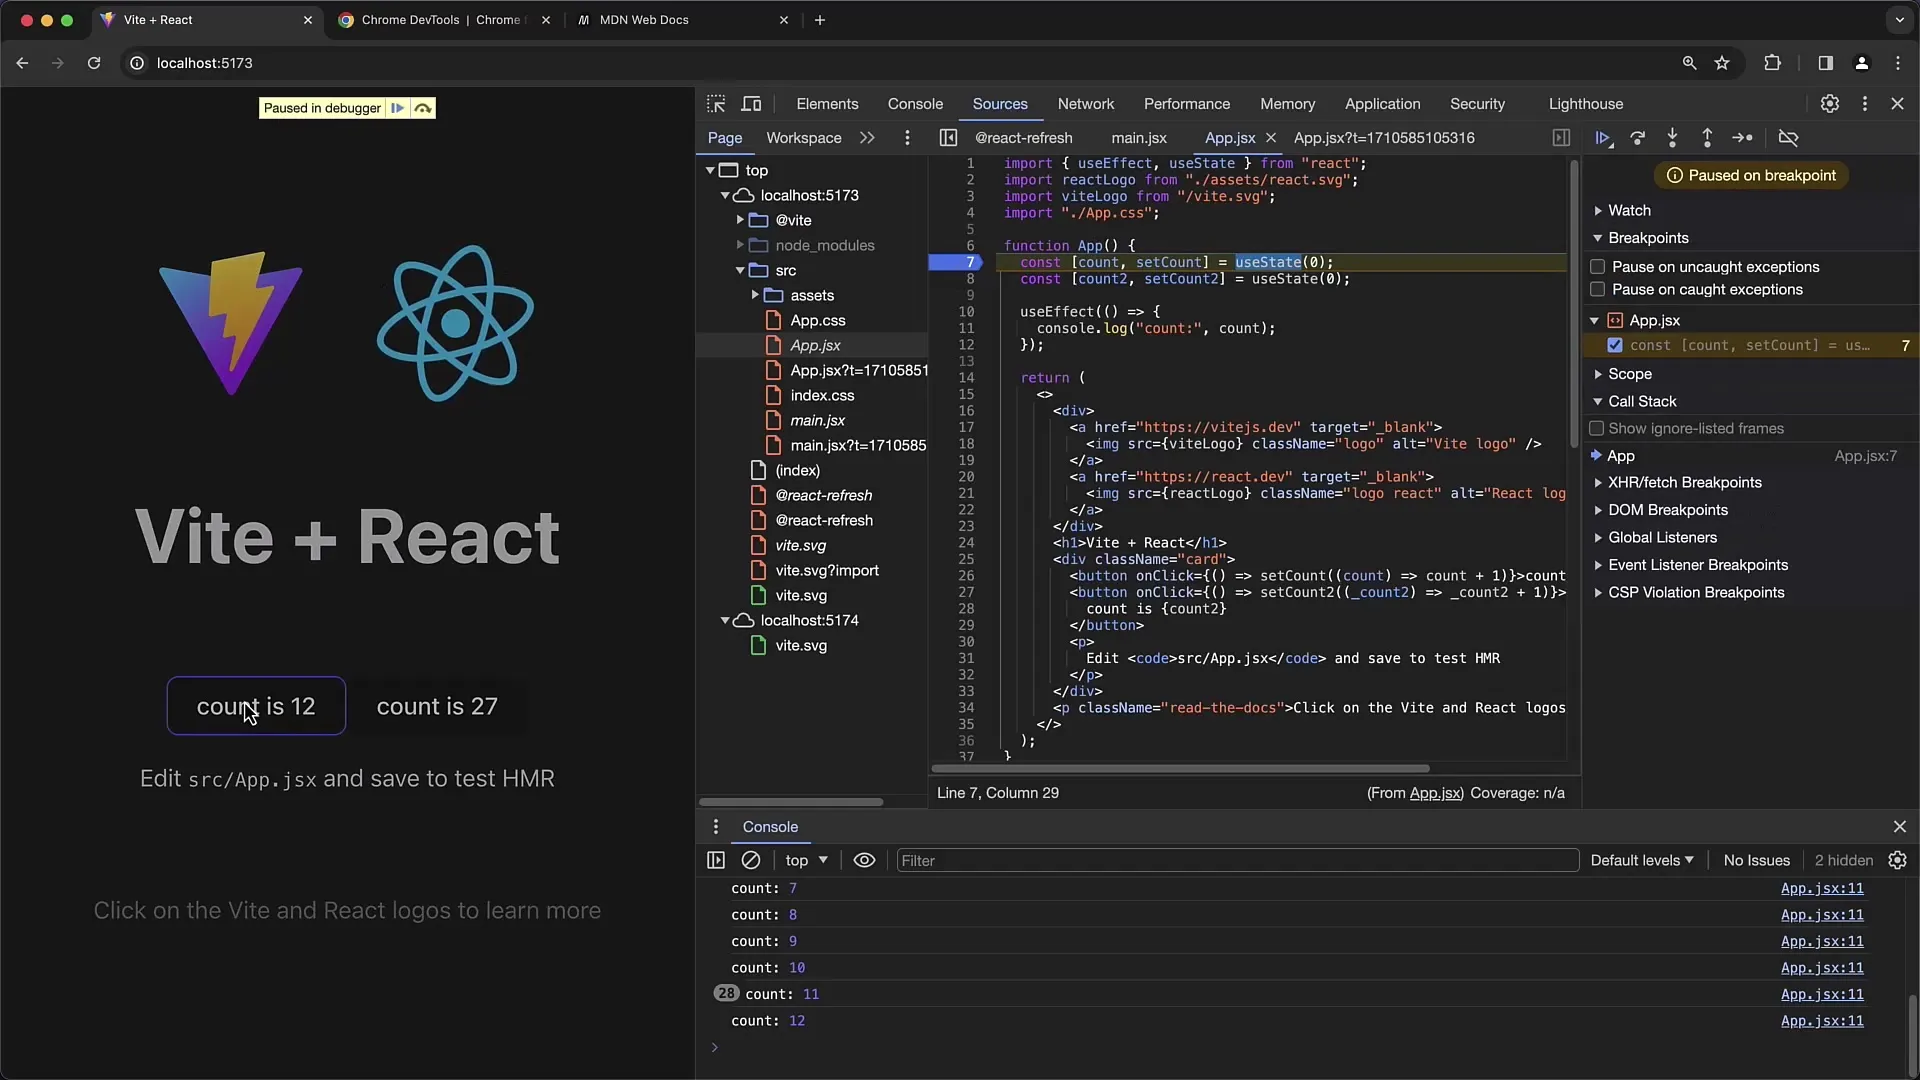
Notice that with each click, the state is updated correctly only for the button that was clicked. However, if you click on the other button, you will see that the application's behavior is not as expected.
Now you start investigating the error. You notice that the useEffect outputs the previous counter value in any case, even when clicking on the other counter.
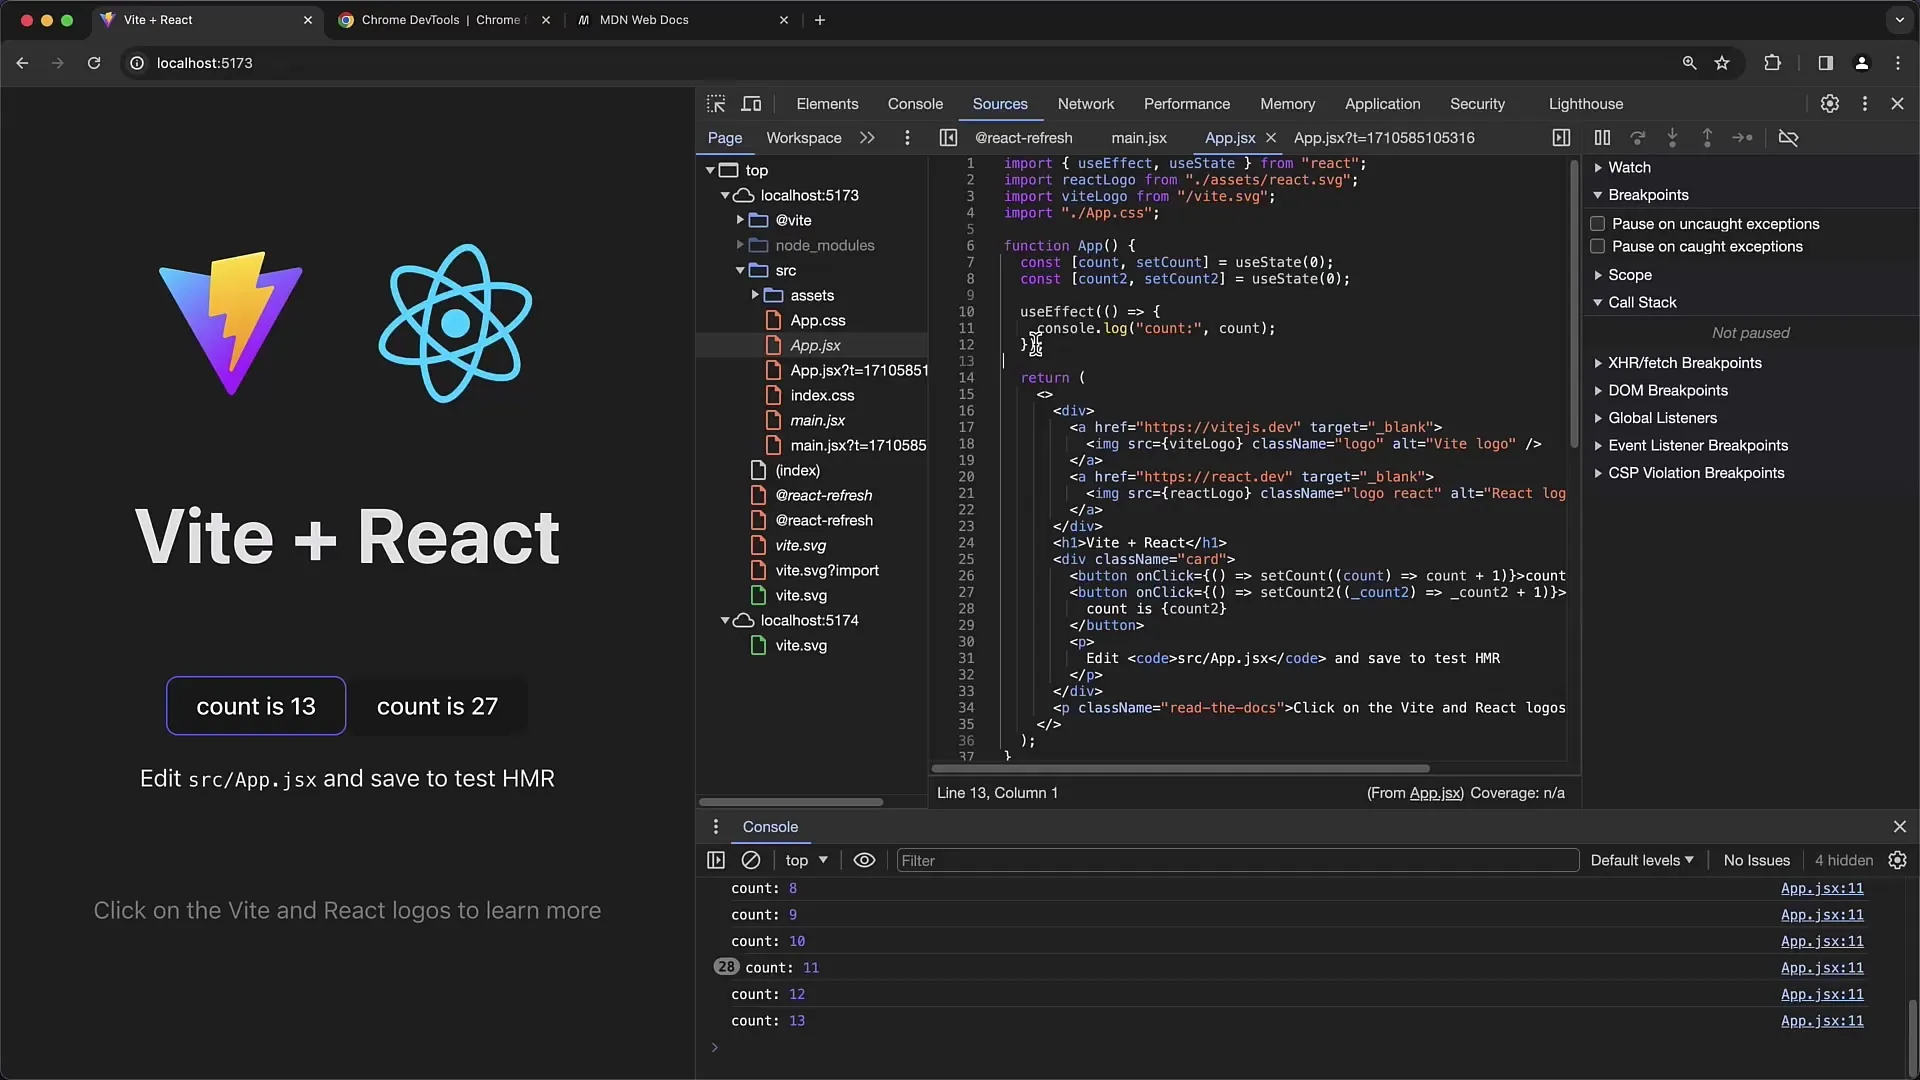
Here you should re-add the dependency array and ensure that it has the current counter value as a dependency. This way, the effect will only be triggered when the relevant counter changes.
When you reload the application and press the buttons, you will notice that the console output is only displayed when the counter changes. Add another breakpoint in your console.log statement to check if the expected values are being output there.
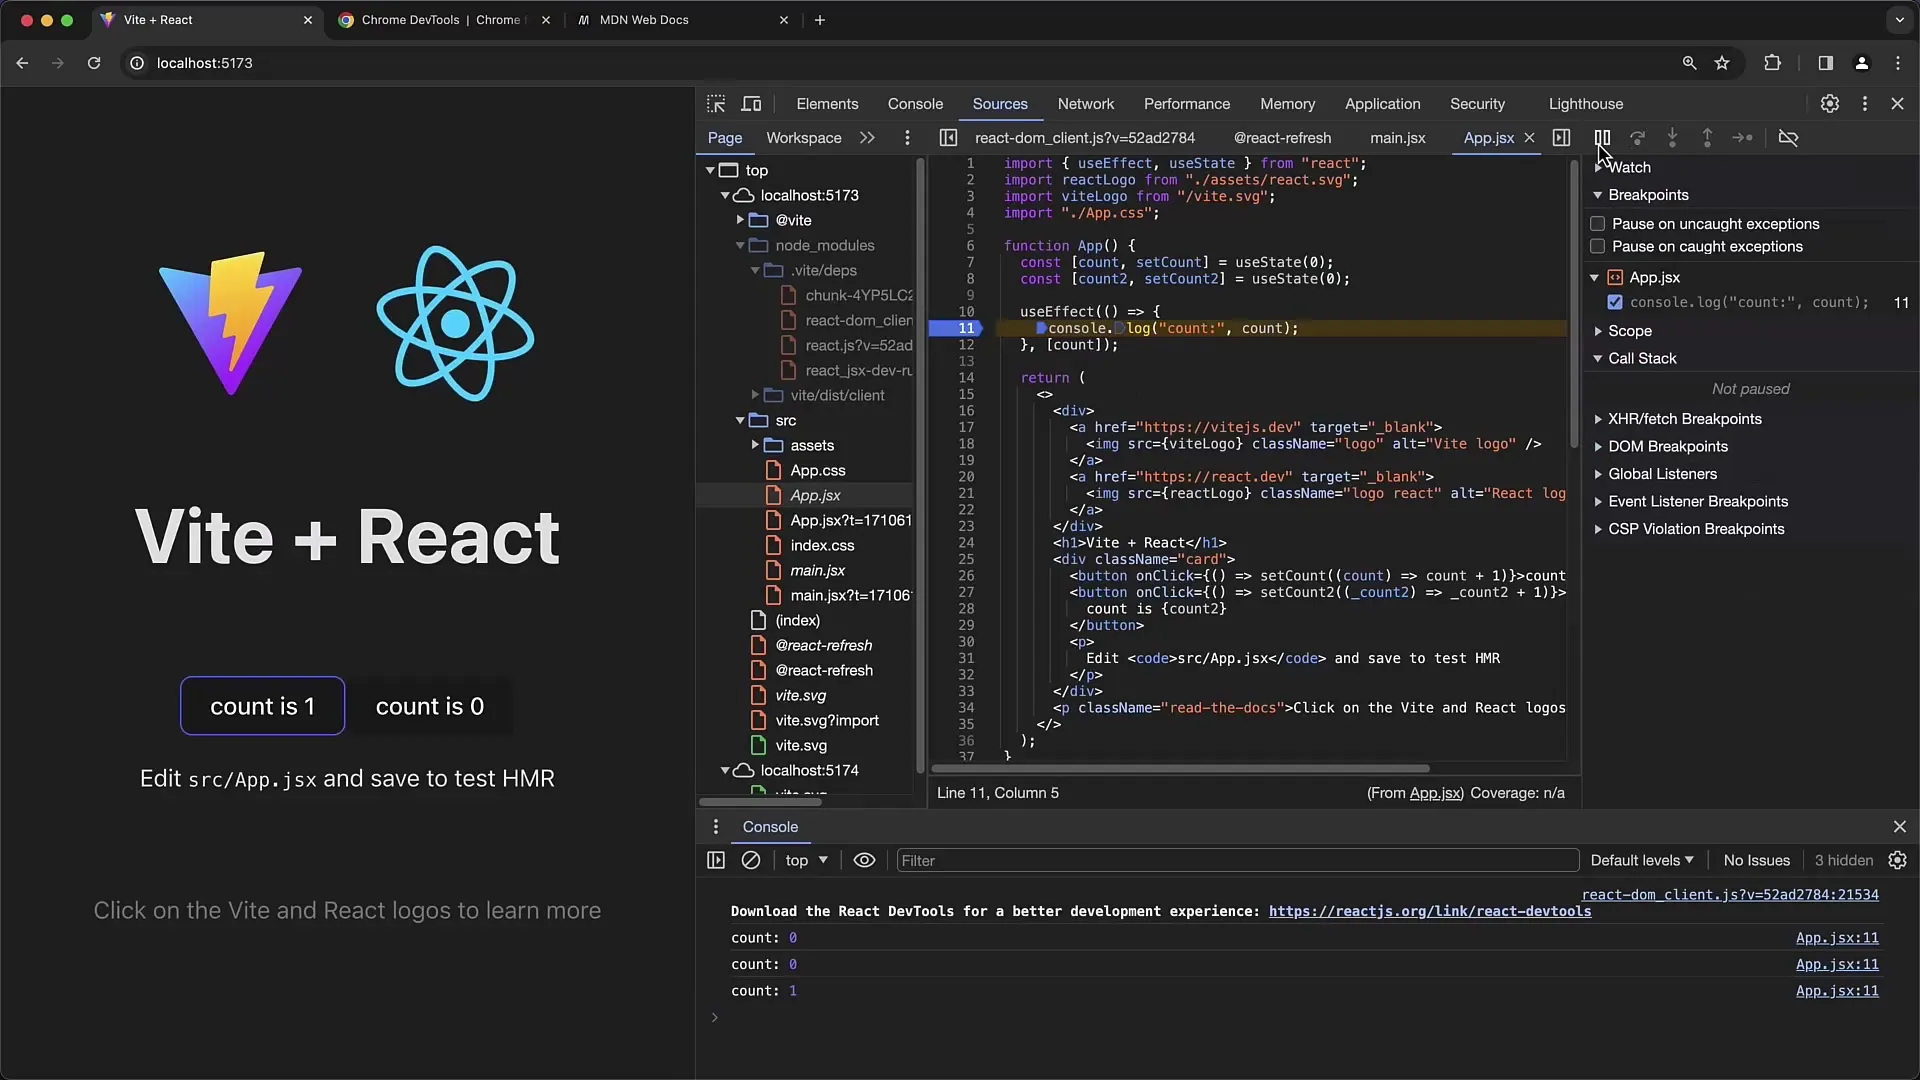
Be aware that in the code representation of React there is also a 'Show ignore listed Frames' option. This can be helpful to prevent the associated library codes from appearing in the call stack, which could disrupt your analysis.
Once you have fixed the error, it can be helpful to recheck it. Here, you should again make sure that the code is retested for press functionality to confirm that the change has the desired effect.
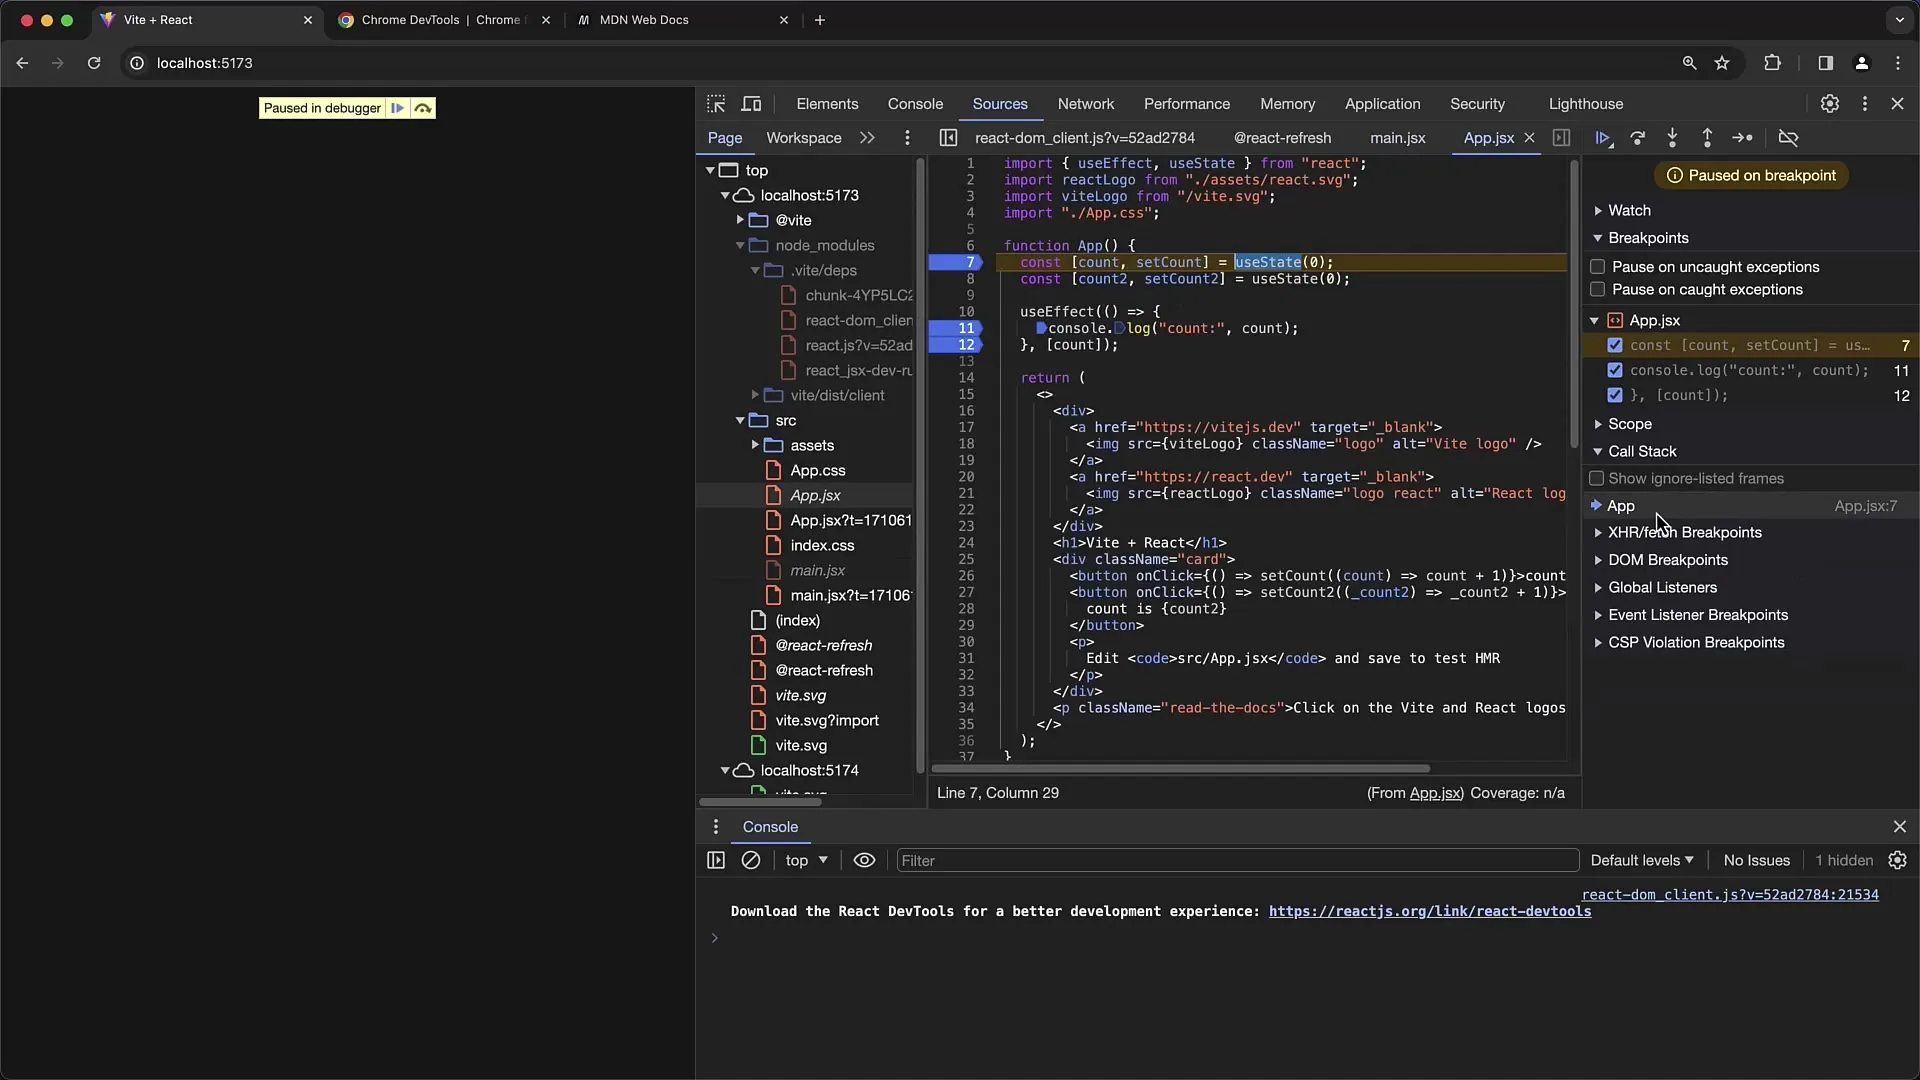
In addition, you can strategically set breakpoints at various points in conversations to further examine function calls. Regularly check the call stack to track all invoked functions that were called at a particular moment.
Also keep in mind that asynchronous operations can lead to a loss of local state, which is why checking the call stack at a central point is important to maintain an overview of the state of your React app.
Summary
In this tutorial, you have learned how important the Chrome Developer Tools are for effectively debugging React applications. Setting breakpoints and analyzing the call stack are essential steps to understand the flow of your code and solve problems. By correctly managing dependencies in useEffect, you can ensure that your application displays the expected state.
Frequently Asked Questions
What is a Breakpoint?A breakpoint is a point in the code where the program execution stops to examine the current execution.
How do I use the dependency array in useEffect?The dependency array allows you to specify which variables should trigger the effect when they change.
What are Source Maps?Source Maps connect compressed and transpiled code to the original code, making debugging easier.
How can I monitor asynchronous operations in the call stack?Be aware that asynchronous calls through setTimeout or Promises affect the application's state and can lead to local variables not being available at a certain point in time.


