In this tutorial, you will learn how to set conditional breakpoints in the Chrome Developer Tools. Conditional breakpoints allow you to make the debugging process more efficient by ensuring that your code stops only under specific conditions. This is particularly useful when working on pages with many interactions and you want to check the code execution only at specific points in time.
Main Takeaways
- Conditional breakpoints allow you to specify conditions under which the debugger should pause the code.
- You can use any expressions to enhance control over the debugging process.
- Learn how to add, edit, and remove breakpoints, as well as explore alternative breakpoint types.
Step-by-Step Guide
To effectively use conditional breakpoints, follow these steps:
To set a breakpoint, simply click on the line number where you want the code to pause. Doing so will display a blue dot representing the breakpoint.
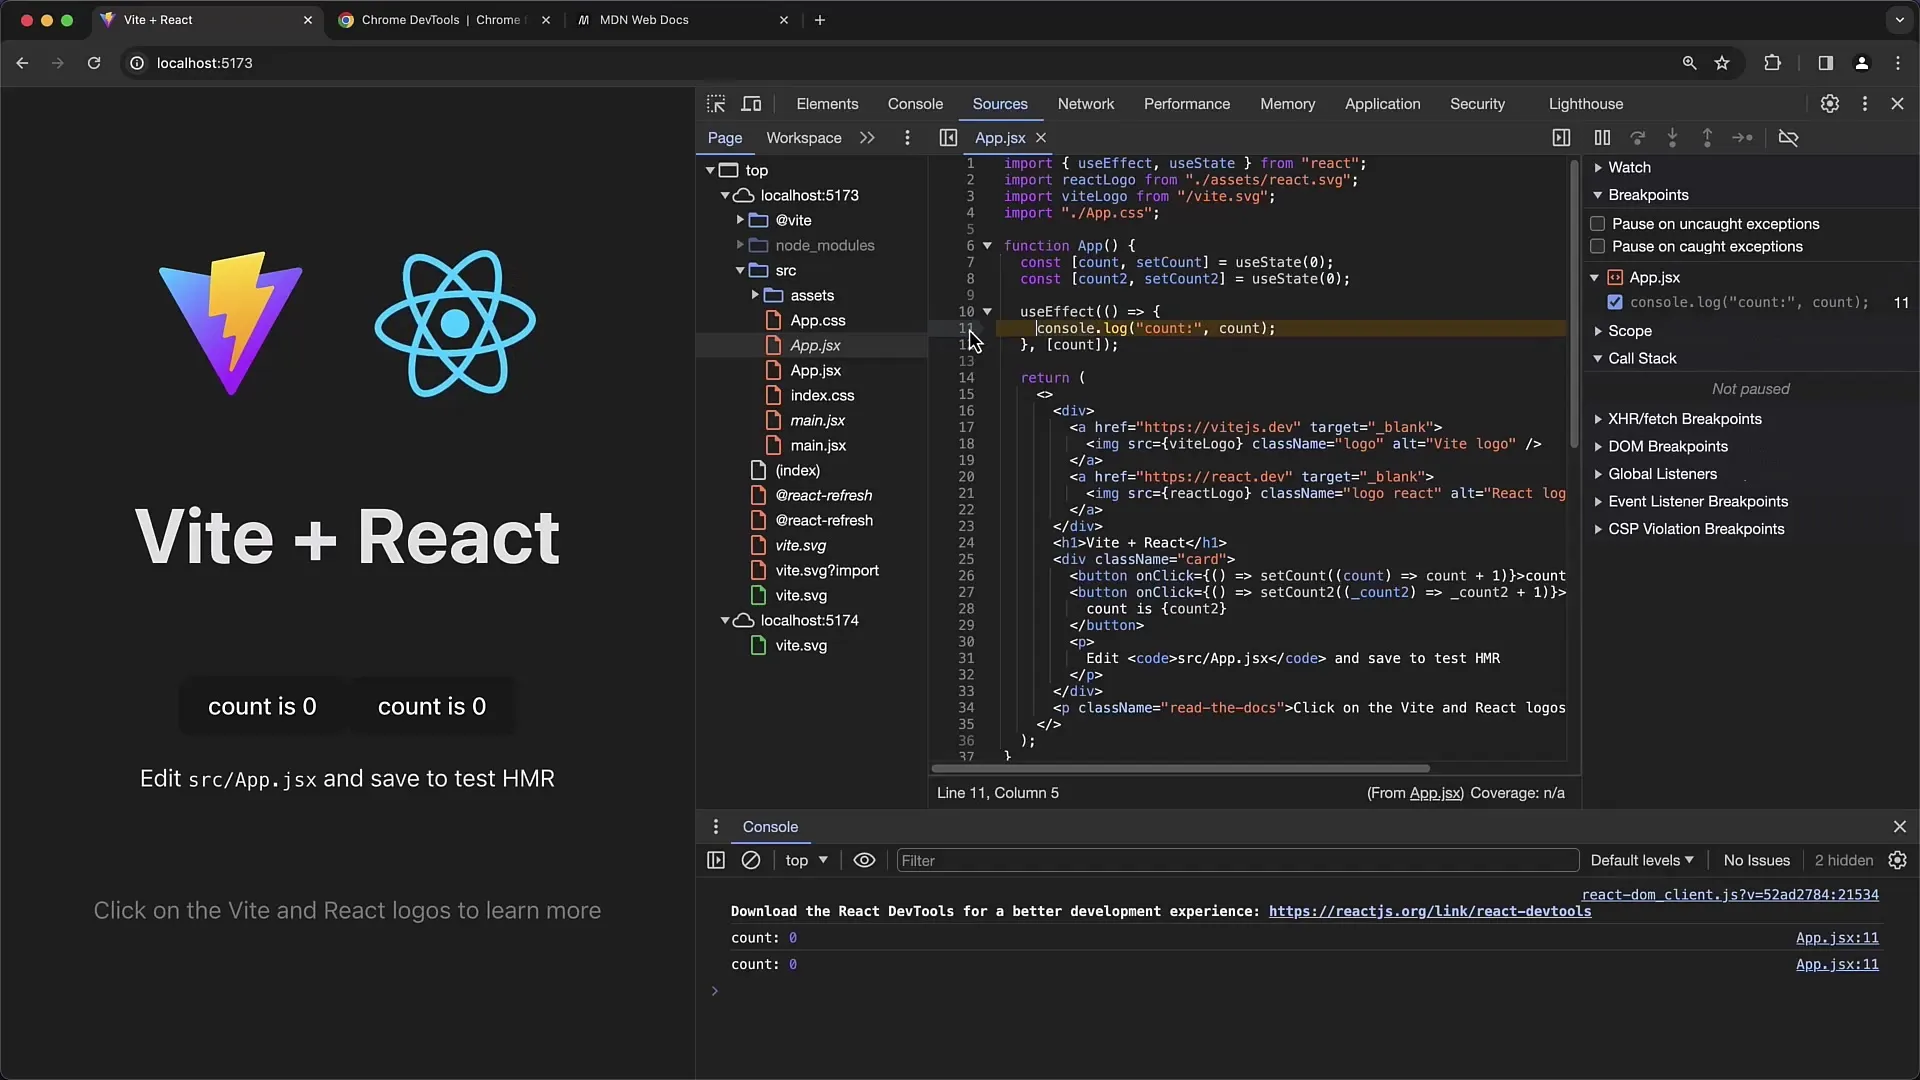
Right-clicking on the newly set breakpoint opens a menu where you can choose various options. Here, you can also disable the breakpoint. When you disable the breakpoint, it remains in the code but becomes inactive.
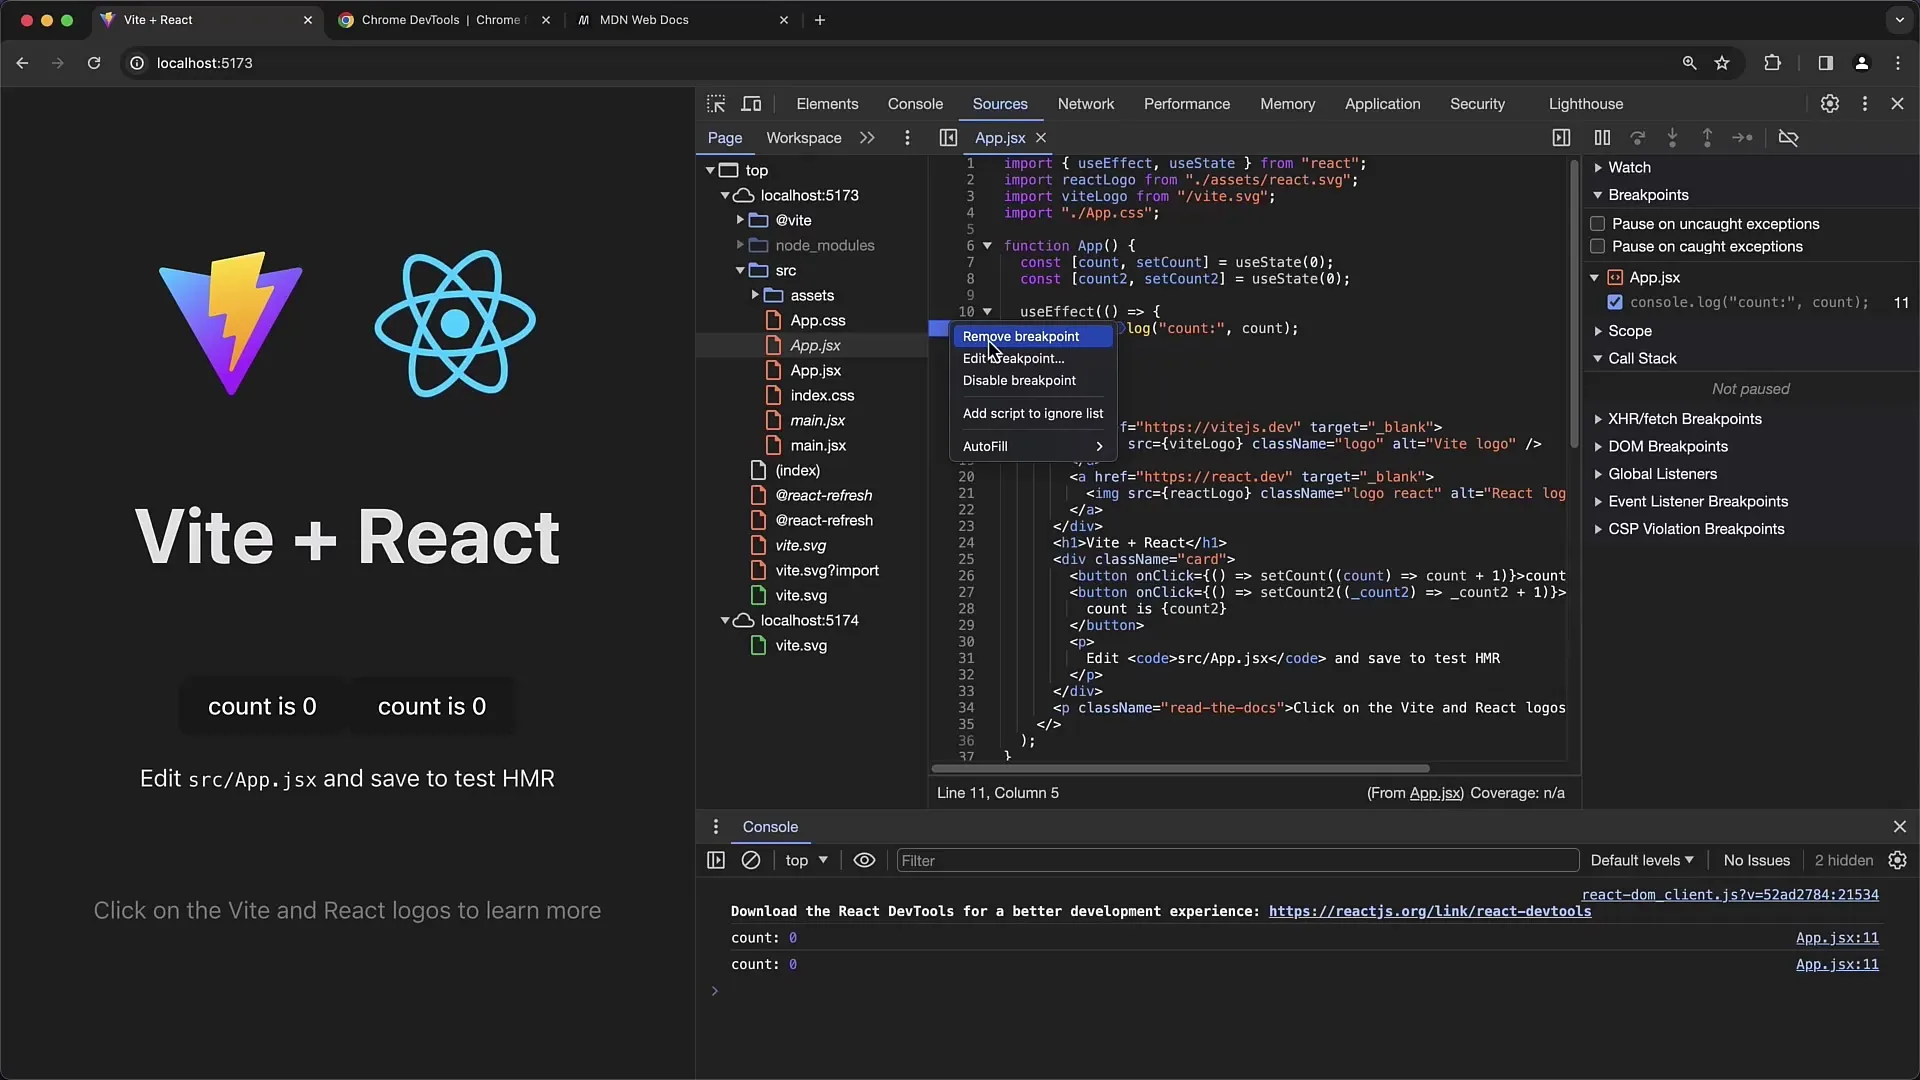
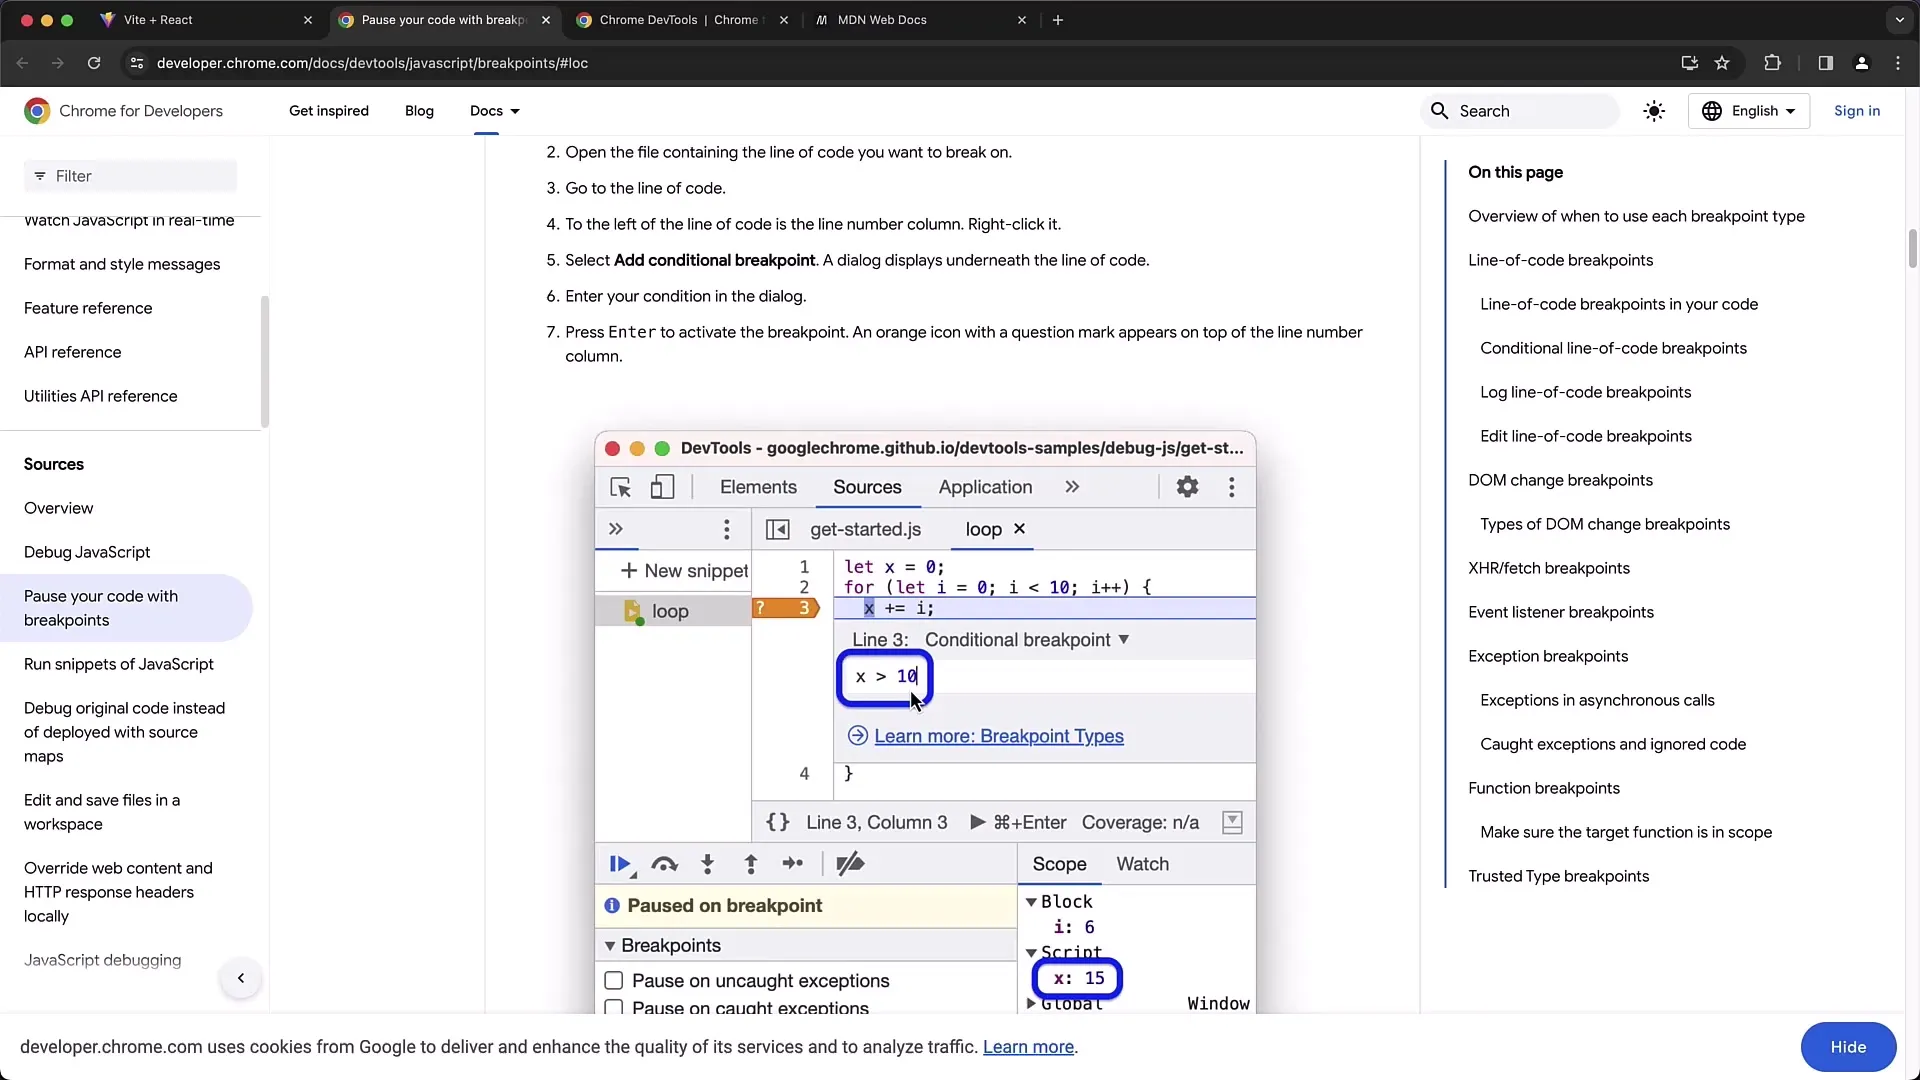
A useful feature is the "Edit Breakpoint" option. By selecting this, you can add a condition. This allows you to enter an expression that determines when the breakpoint should be triggered.
For example, it is a good idea to check a variable like count. Let's say you enter count == 8. This means that the breakpoint will be triggered only when count reaches the value of 8.
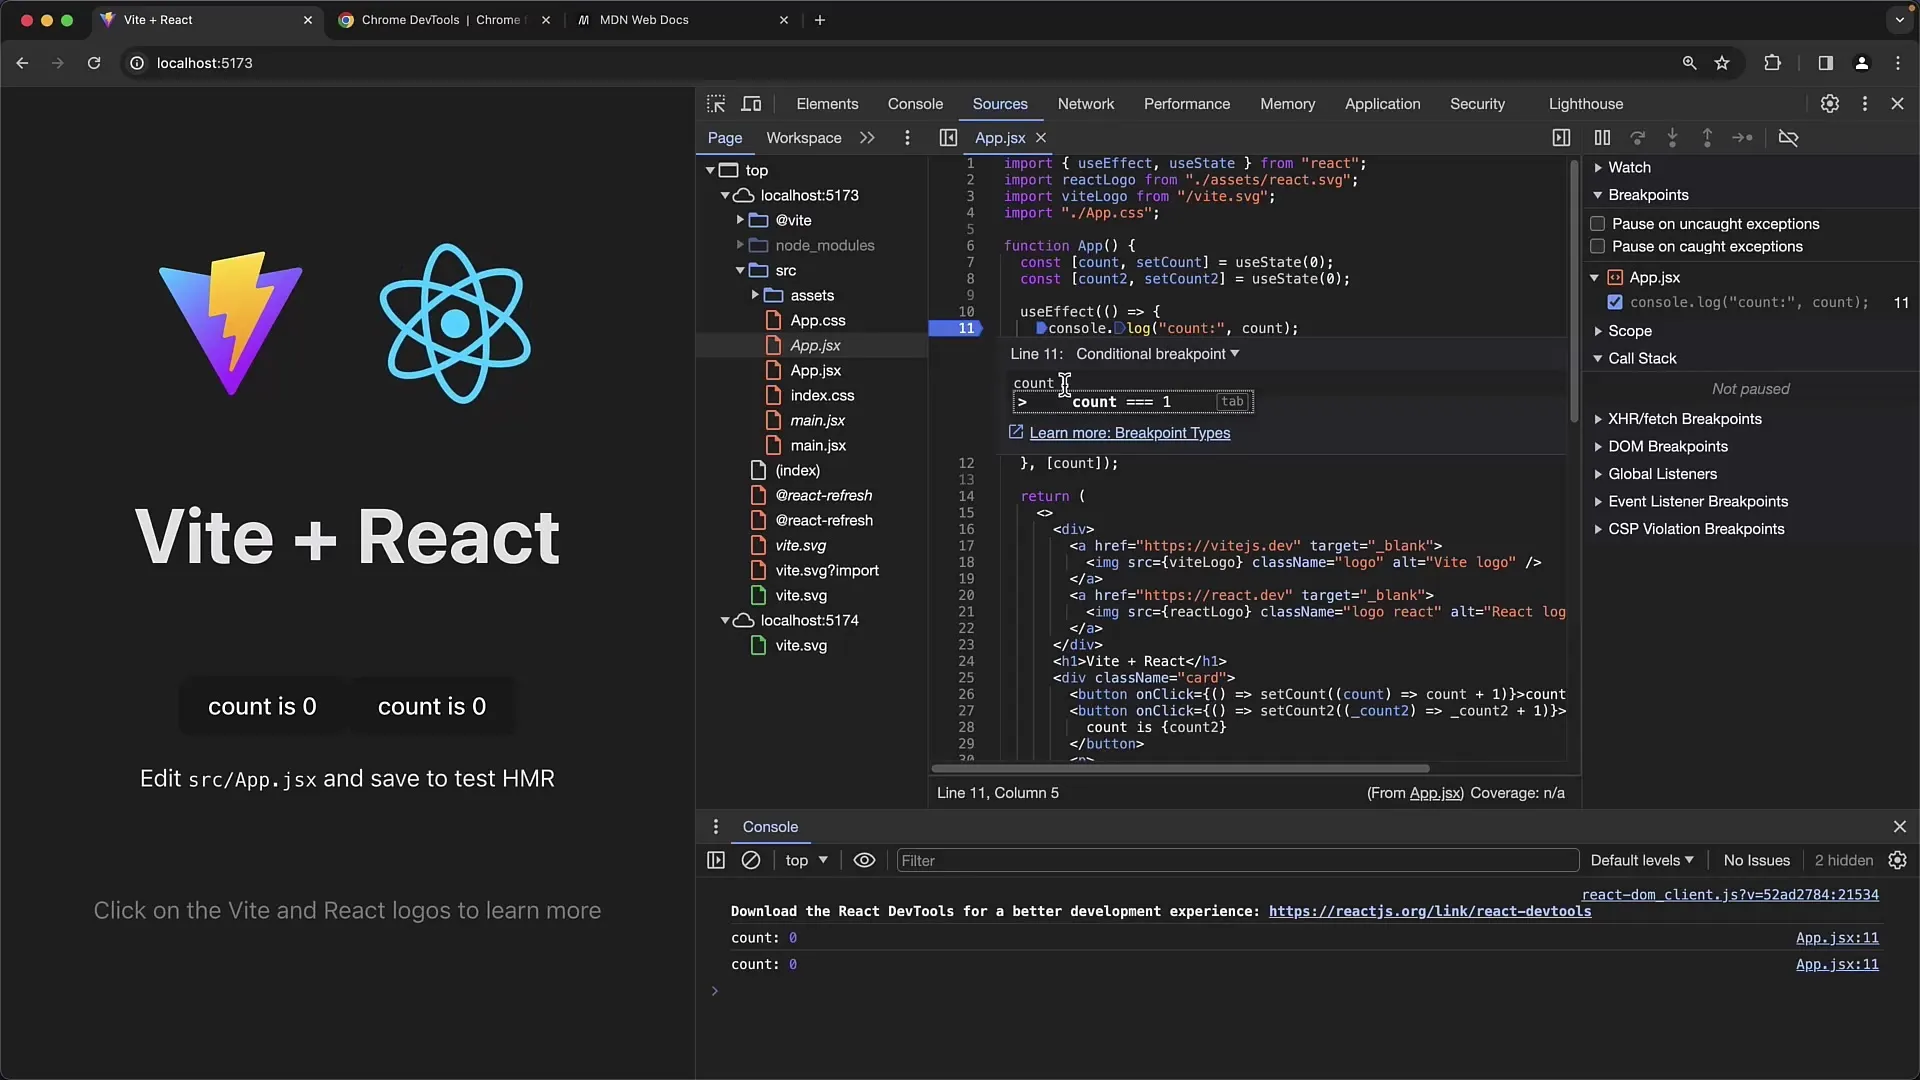
To confirm the condition, press "Return". The breakpoint will then be displayed in orange in the code, with a question mark indicating that it is a conditional breakpoint.
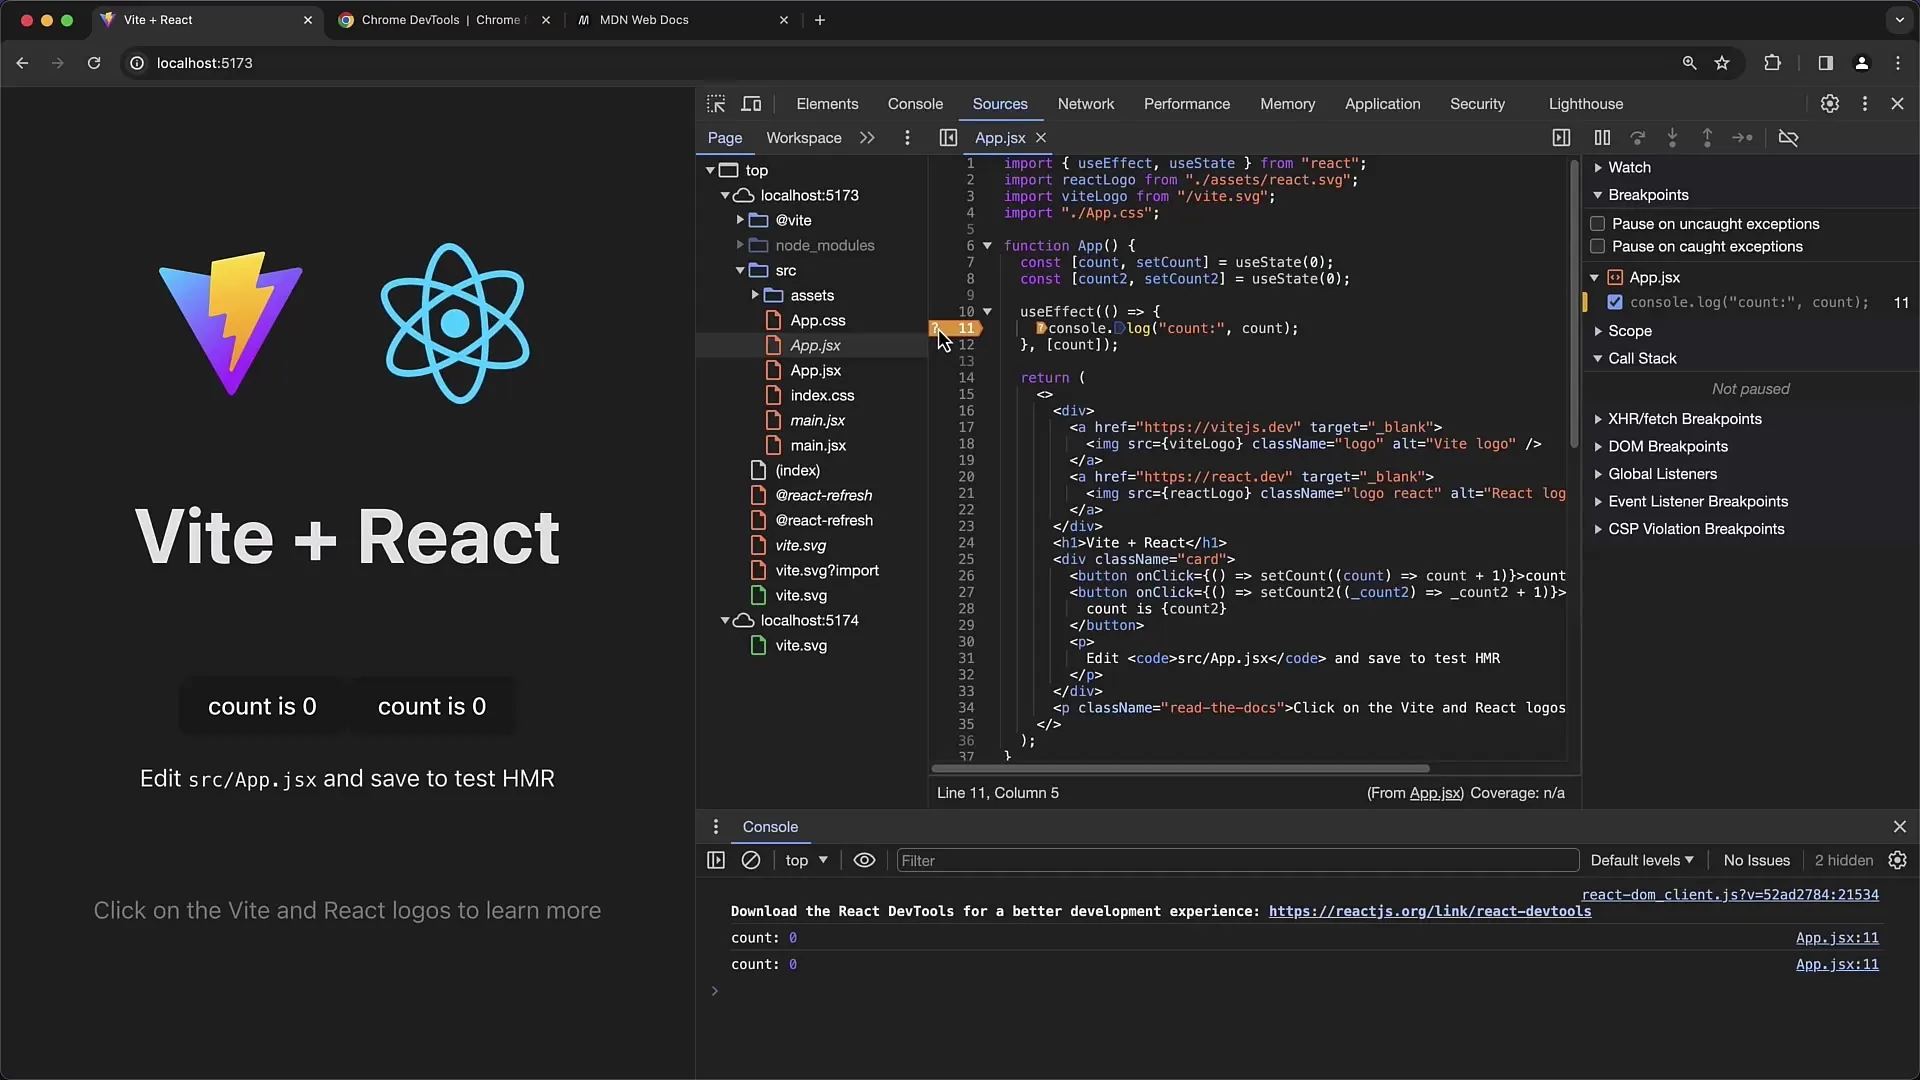
Now, reload the page. At this point, the debugger should not pause since the condition has not been met or verified. Press count multiple times to increase it.
When count reaches the value that fulfills the condition (in our case, 8), you will see the debugger halt, as expected.
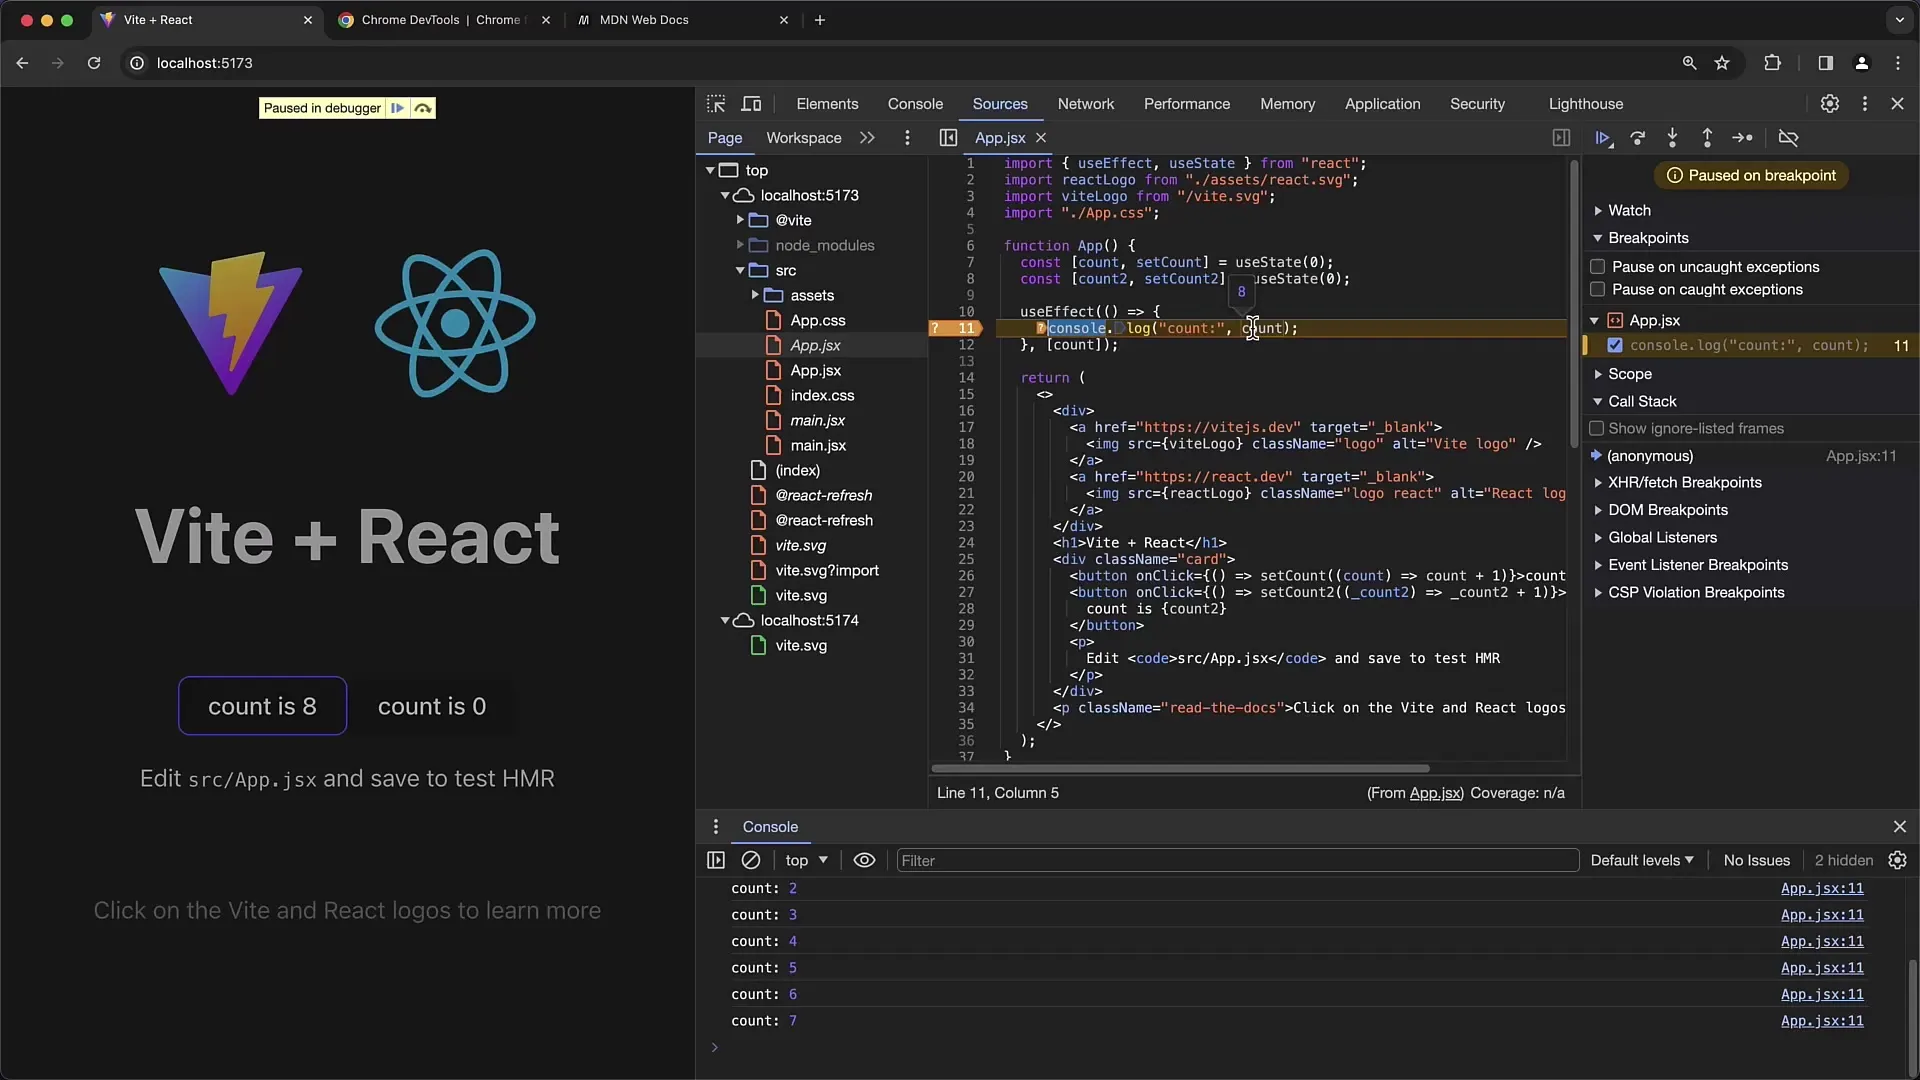
To check the current condition at any time, you can click on "Edit Breakpoint" again and see all active conditions.
If you continue pressing count, the debugger will no longer pause unless you change the condition.
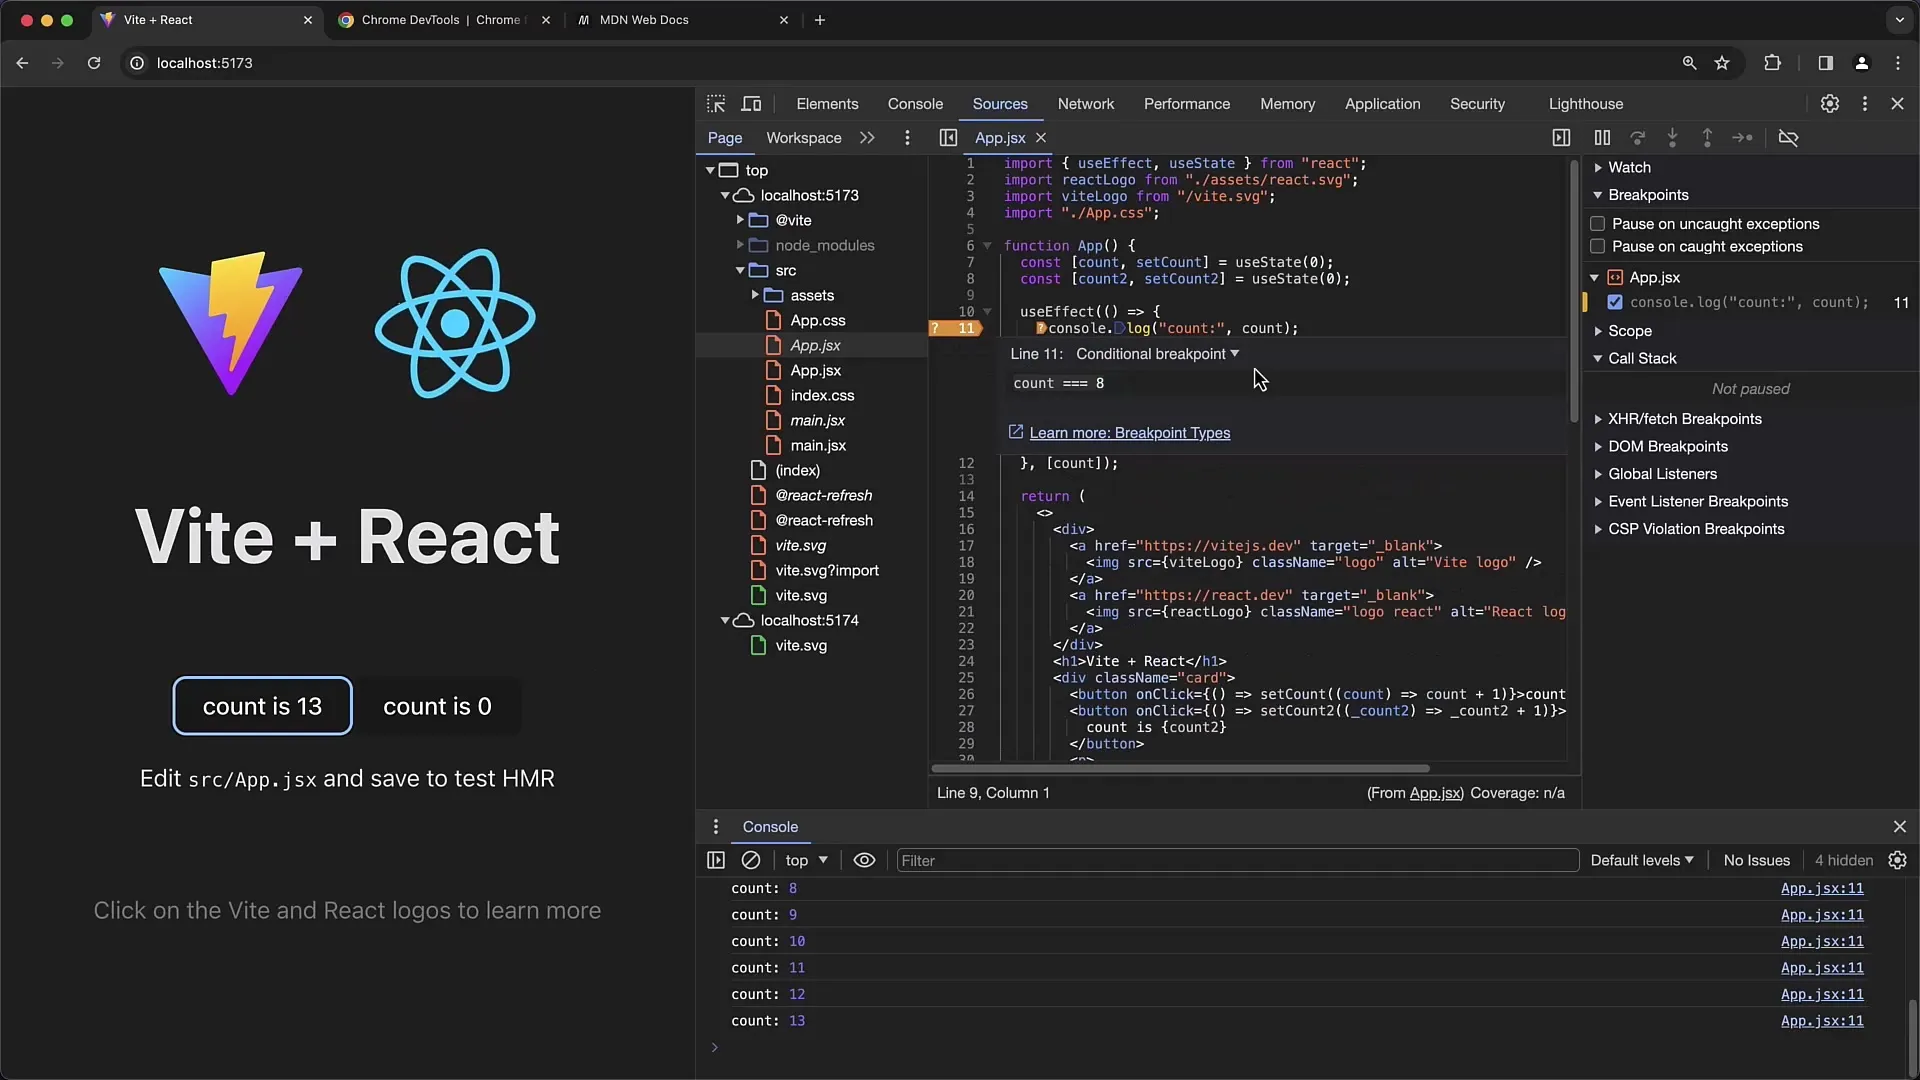
You have the flexibility to enter any expressions in the condition field. For instance, you could use a condition stating that count is greater than 8.
When you make the change and then reload the page, the debugger will pause when the condition is true.
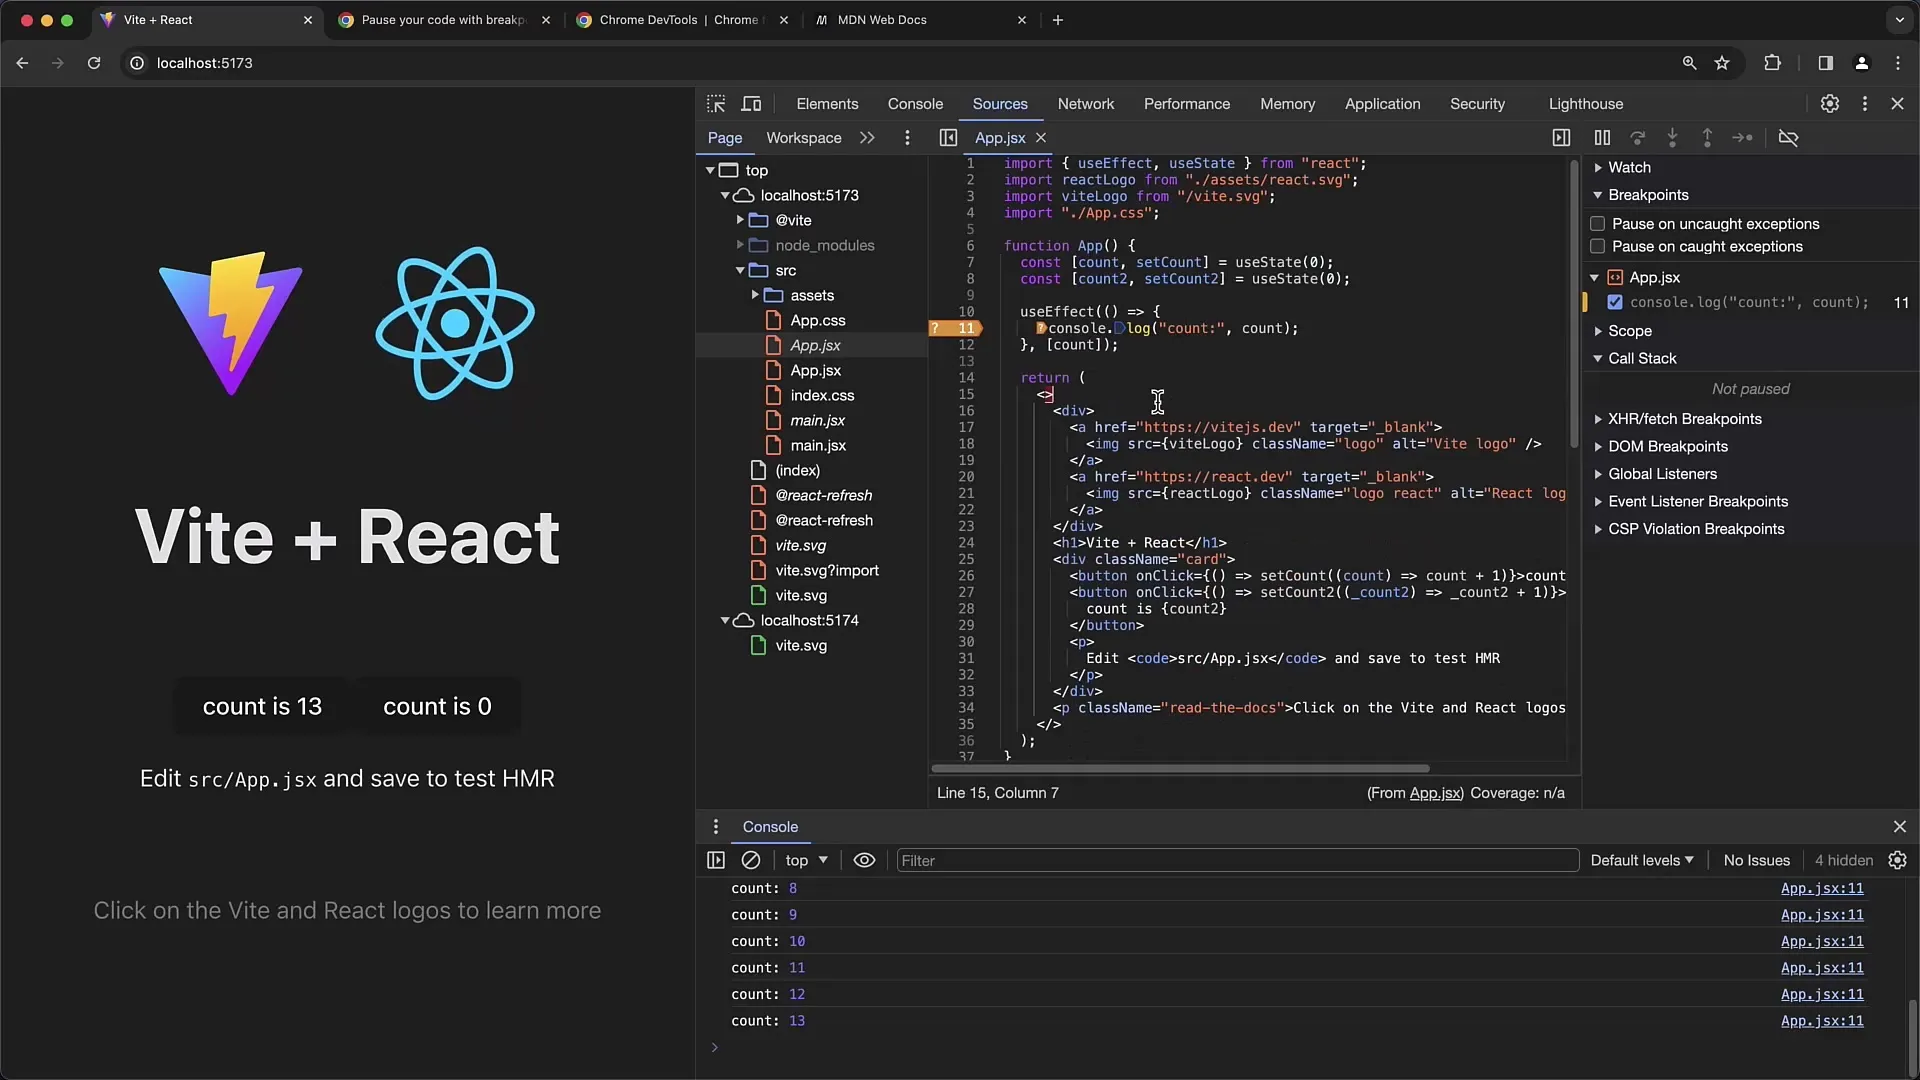
Each time you press count, the debugger will also pause when count is now greater than 8.
To check the condition at any time, you can open Edit Breakpoint again and see all active conditions.
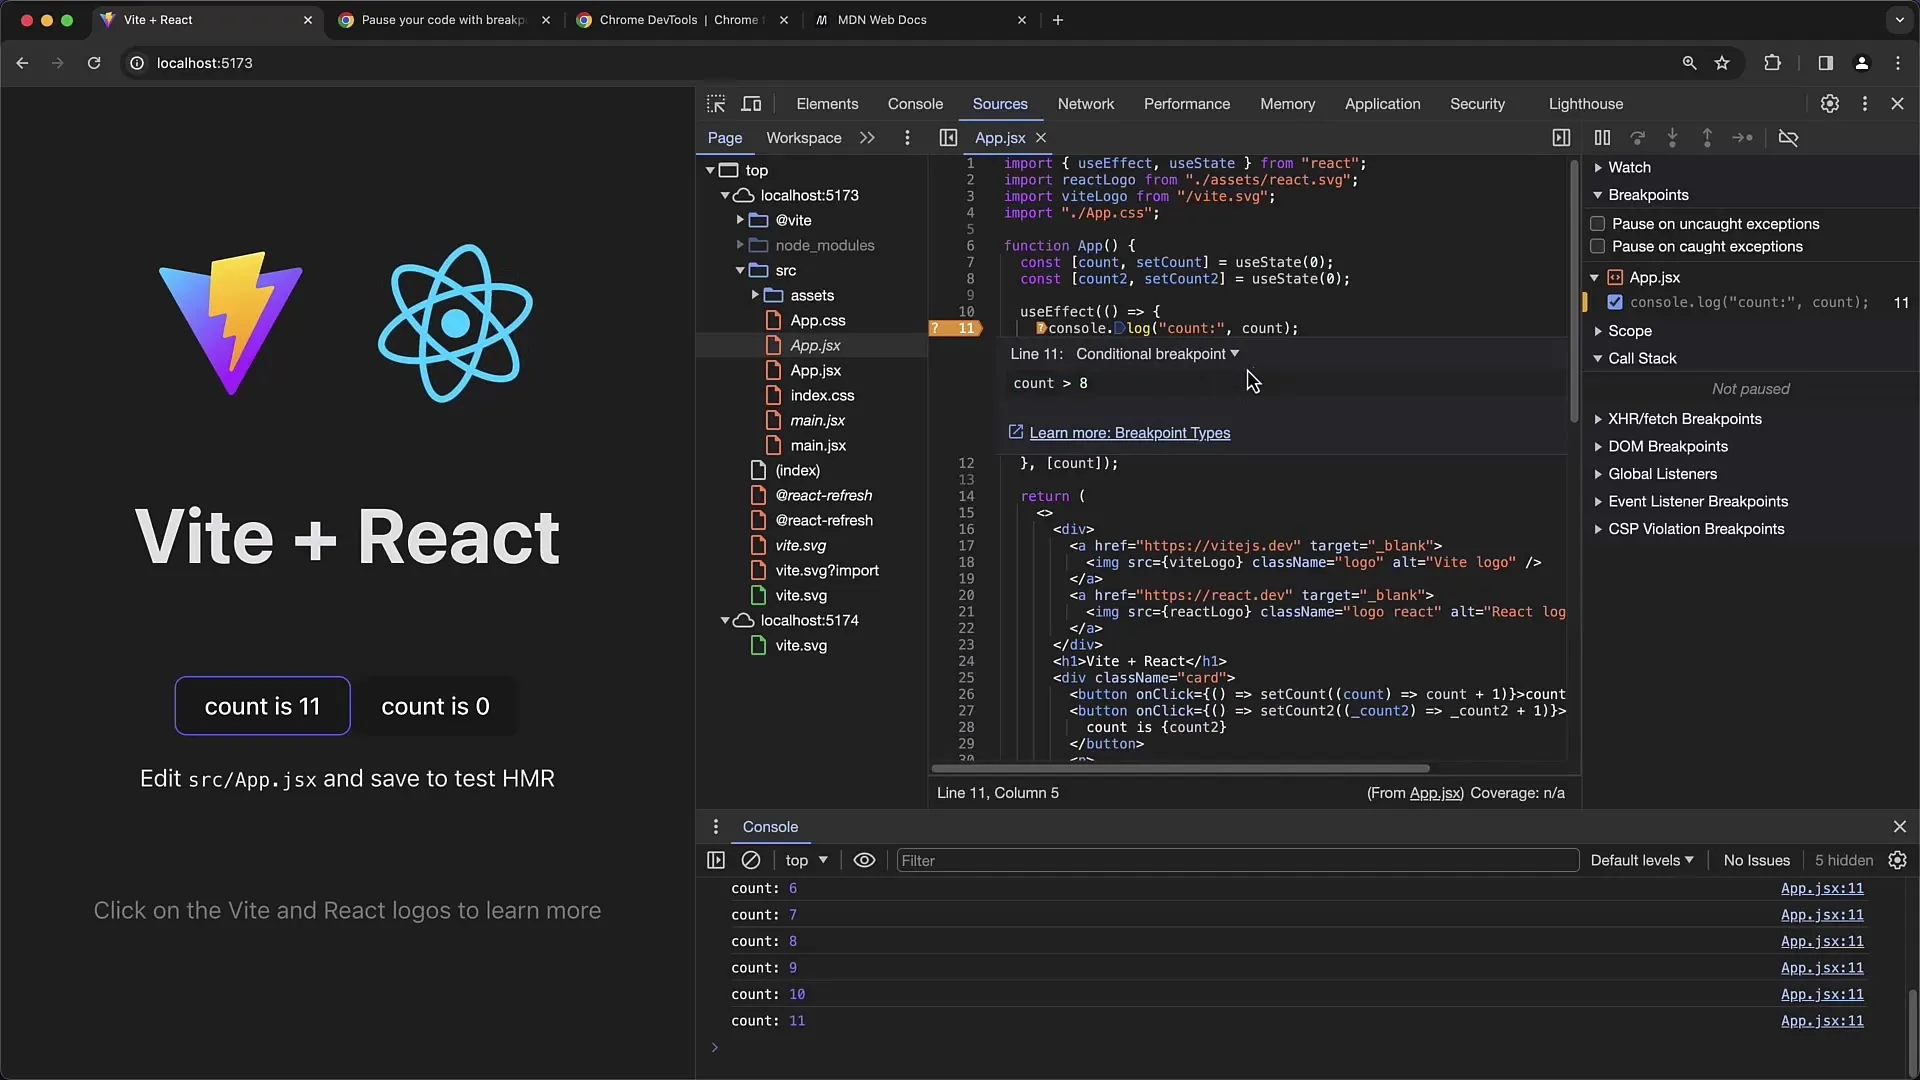
In addition to conditional breakpoints, there are other types like Logpoints. A Logpoint is another useful feature that allows you to set conditions, but instead of stopping, only a message is output, for example, "true" or "false," depending on whether the condition is met or not.
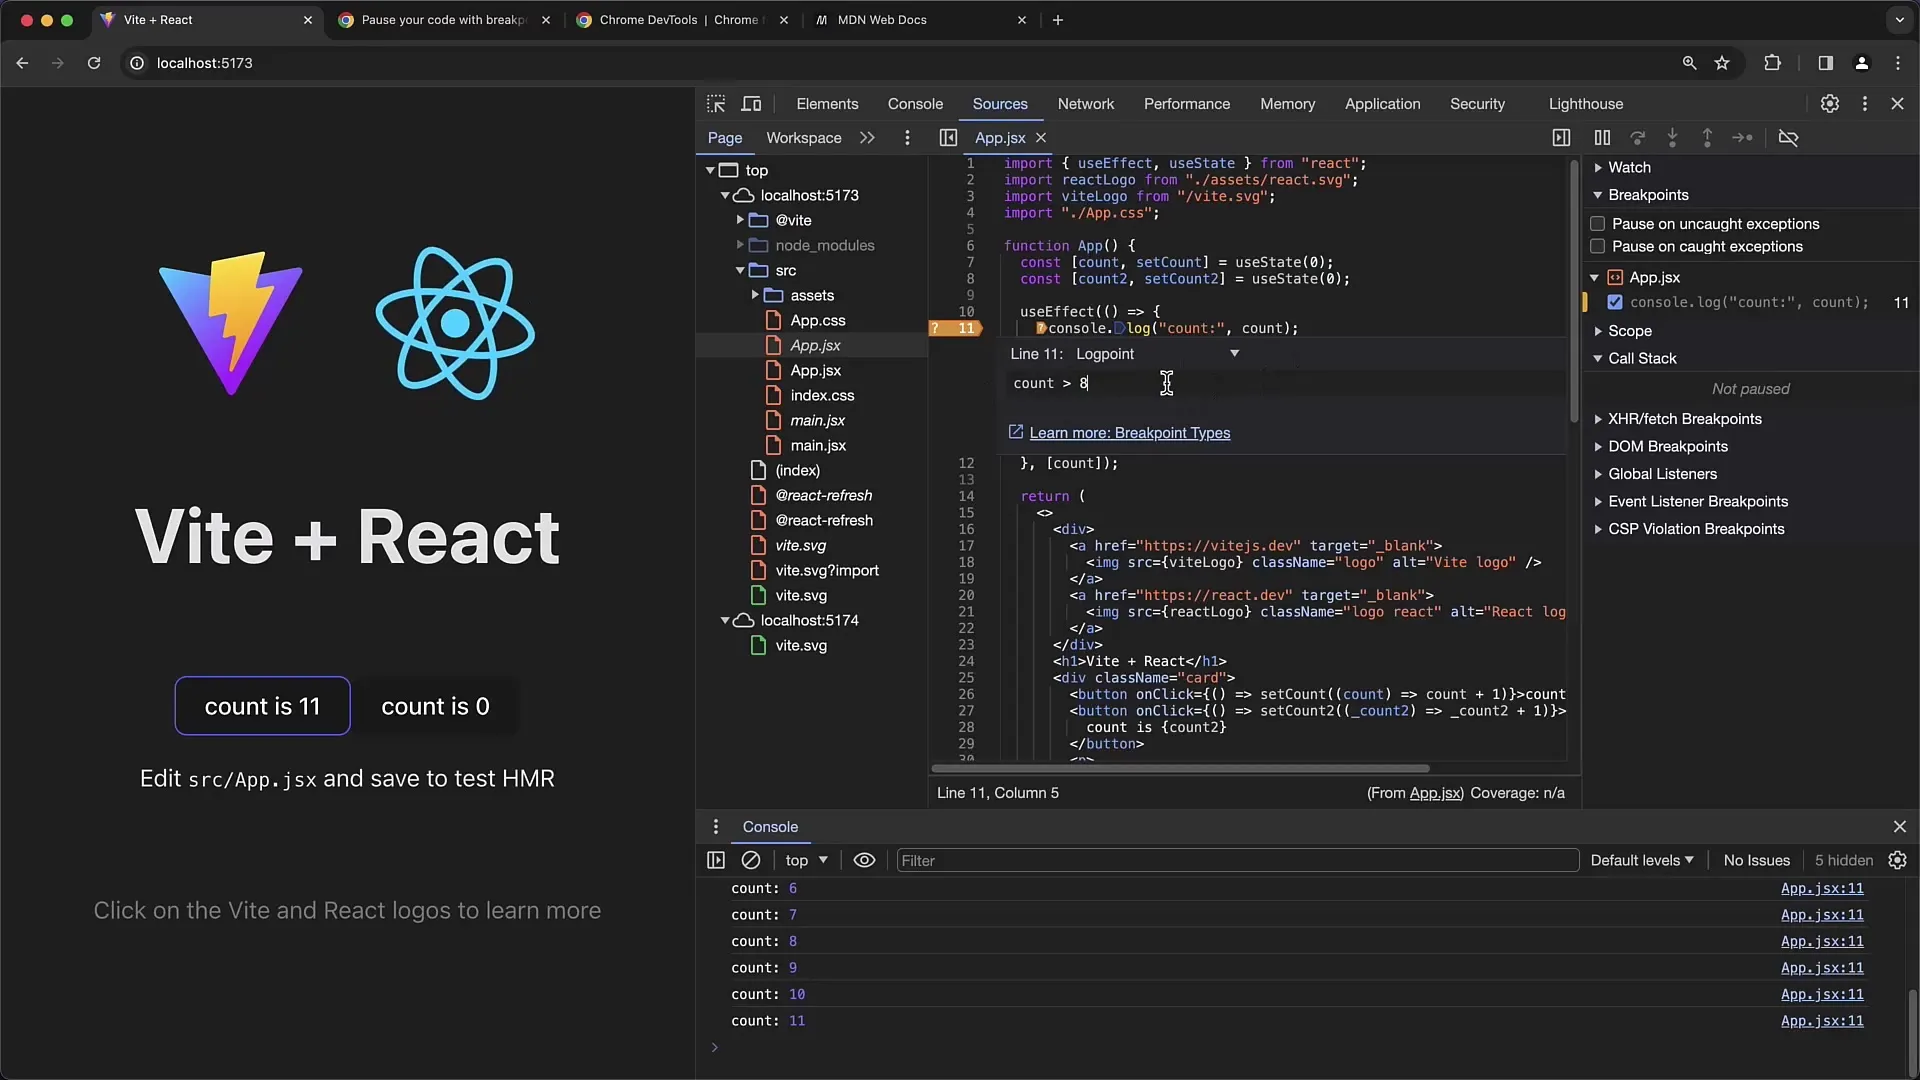
Once you reload and click again, you will notice that you receive "false" or "true" depending on the condition's state.

It is important to understand these different types of breakpoints as they can help you optimize your debugging work.
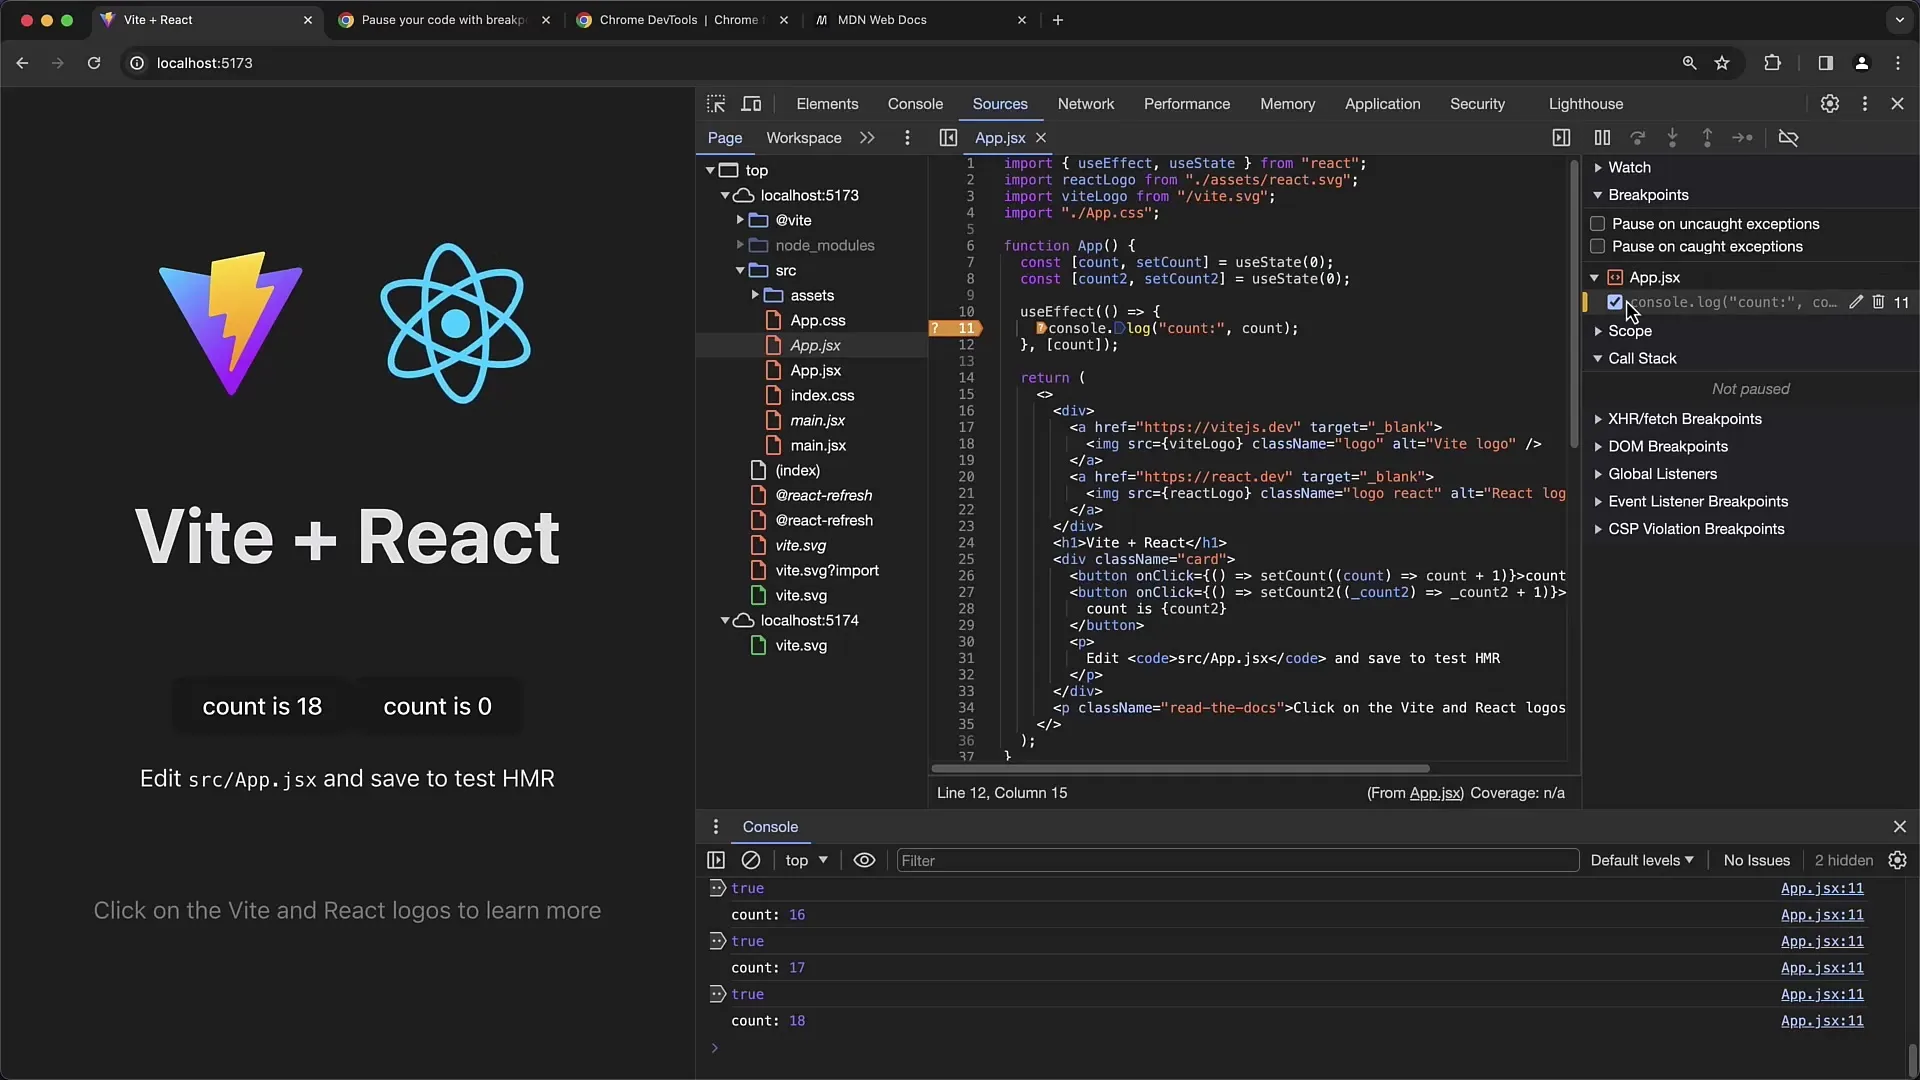
To manage all set breakpoints, there is an overview where you can delete or edit existing breakpoints. If you click on a single breakpoint, you will be taken directly to where the breakpoint is set in the code.
Summary
In this tutorial, you have learned how to effectively use conditional breakpoints to optimize the debugging process in your web applications. You have seen how to add, edit, and remove breakpoints, as well as how alternative breakpoint types can be used.
Frequently Asked Questions
What are conditional breakpoints?Conditional breakpoints are breakpoints that are only activated when certain conditions are met.
How do I set a conditional breakpoint?Right-click on a breakpoint and select "Edit Breakpoint" to add a condition.
What happens if the condition for the breakpoint is not met?If the condition is not met, the debugger does not stop at that breakpoint.
Can I use Logpoints in Chrome Developer Tools?Yes, Logpoints are an alternative to breakpoints where you can set conditions to simply output a message instead of pausing.
What other types of breakpoints are there?In addition to conditional breakpoints, there are DOM and Fetch breakpoints that set specific breakpoints for interactions with the DOM or Fetch requests.


