In this guide, you will learn how to use DOM breakpoints in the Chrome Developer Tools to monitor changes to DOM elements. DOM breakpoints are especially useful for performing debugging when manipulating DOM structures. This technique allows you to trace the timing and cause of changes in the DOM, which can help you with troubleshooting and optimizing your web applications.
Main Insights
- DOM breakpoints allow monitoring specific changes to DOM elements.
- There are different types of breakpoints: Subtree Modifications, Attribute Modifications, and Node Removal.
- Using DOM breakpoints can help you better understand the effects of scripts on the DOM structure.
Step-by-Step Guide
To work with DOM breakpoints, you first need to open the Chrome Developer Tools. You can do this by pressing the F12 key or by right-clicking on the page and selecting "Inspect."
Now that the Developer Tools are open, navigate to the "Elements" tab. Here you will see the entire DOM structure for the current page.
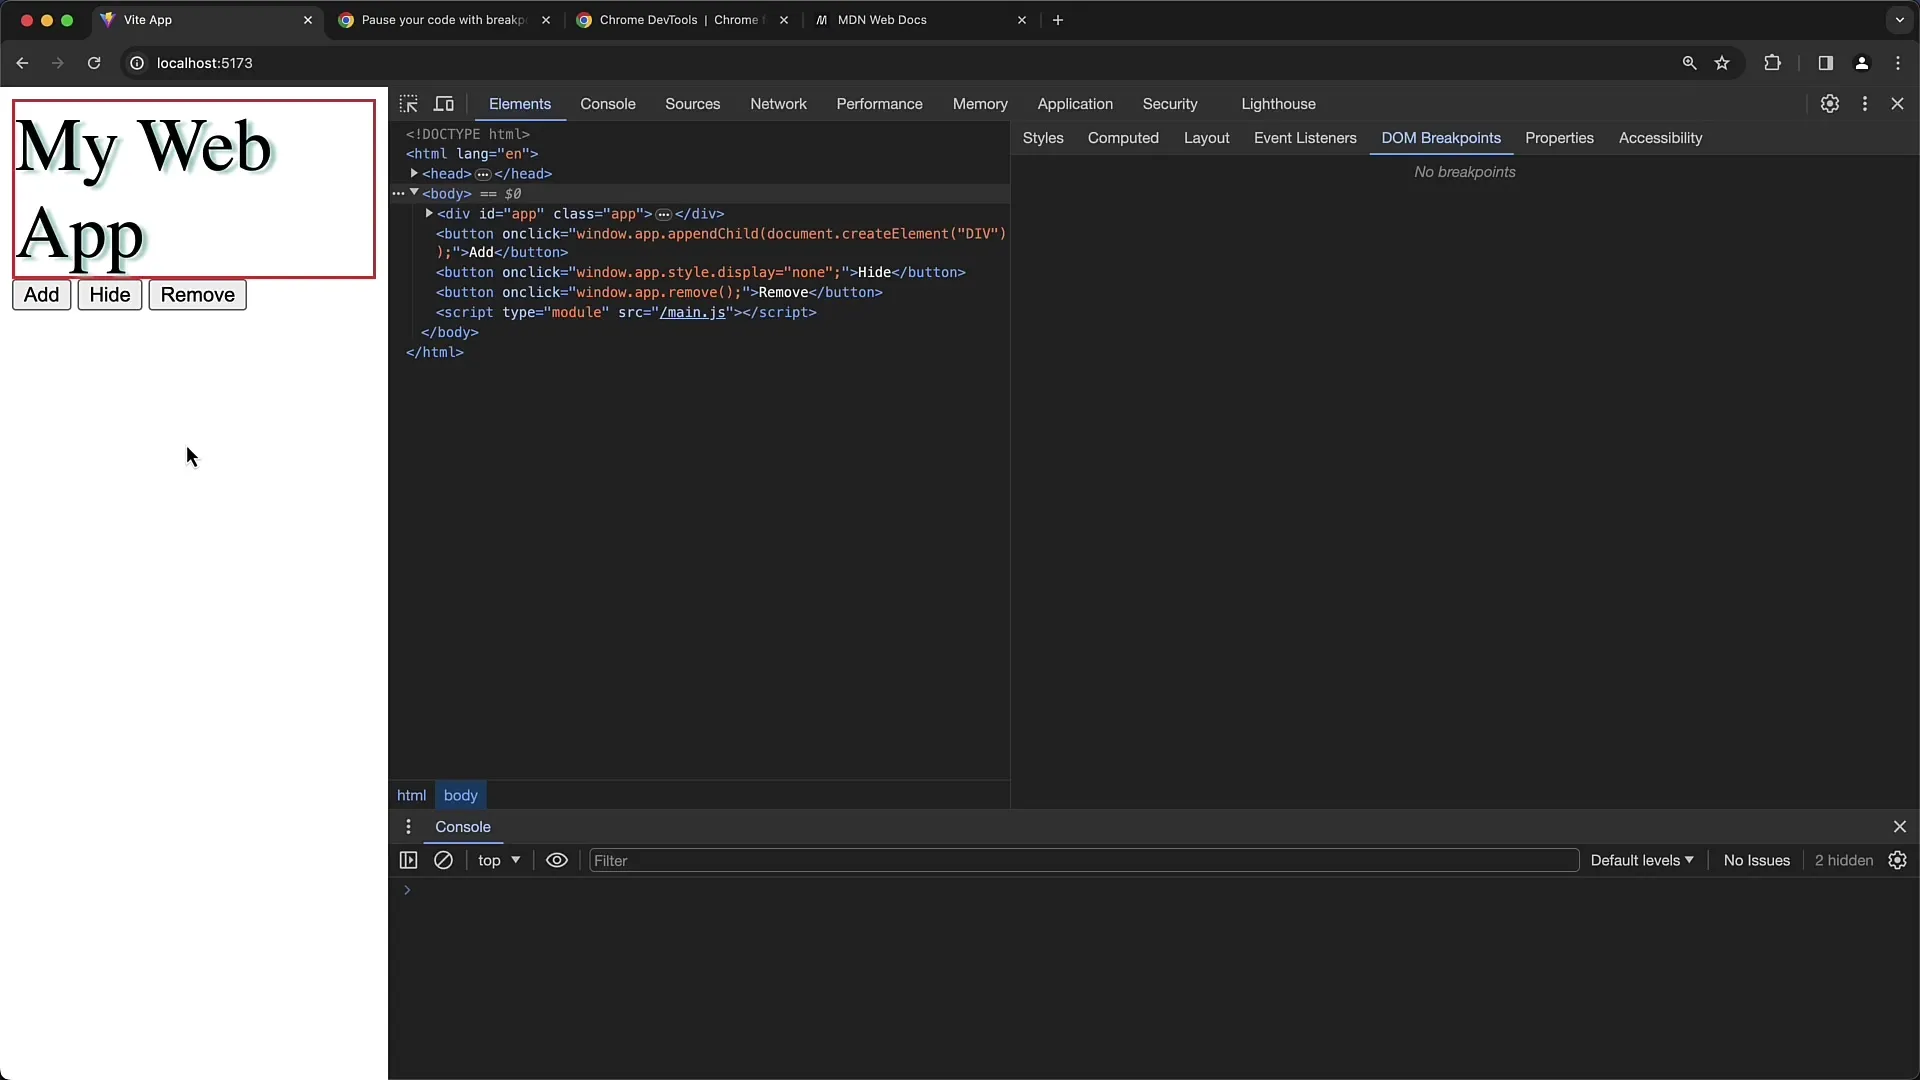
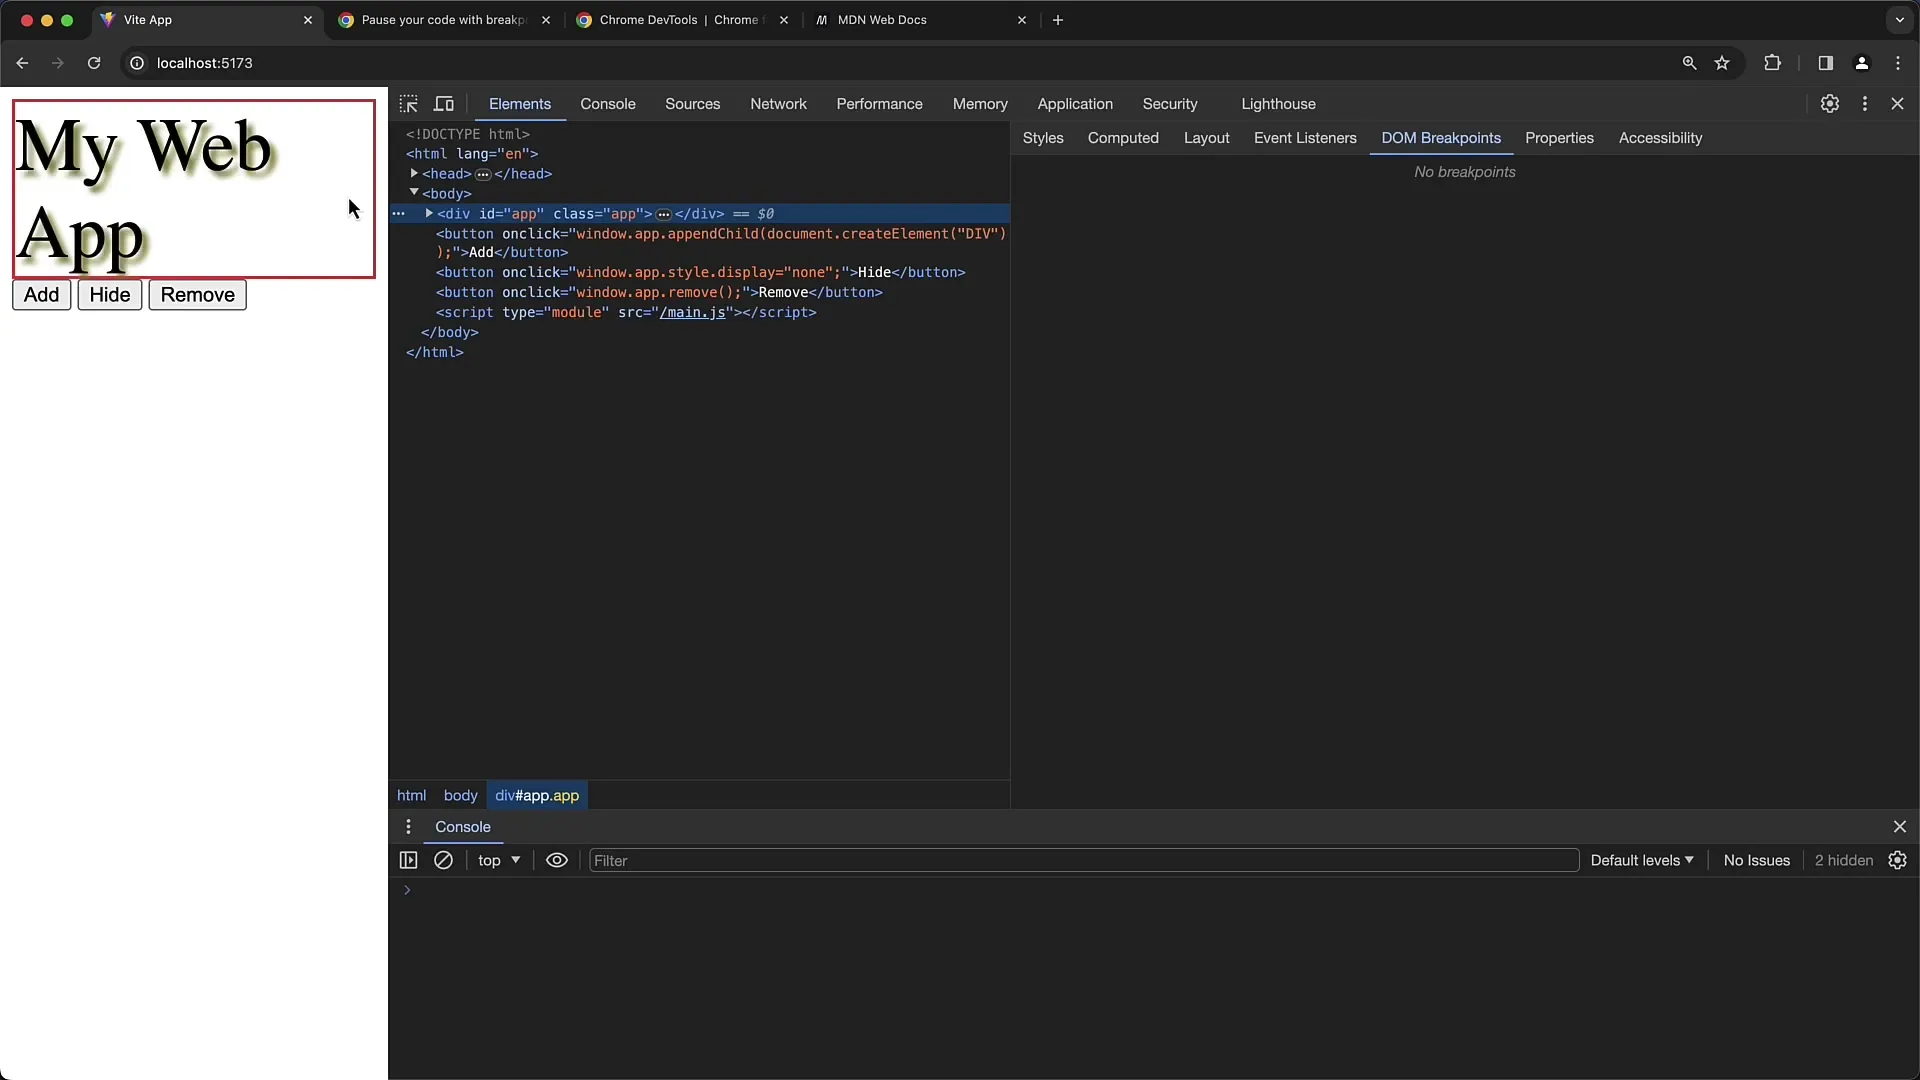
To set a DOM breakpoint, select an element you want to monitor. In our example, we choose a div element with the ID "App."
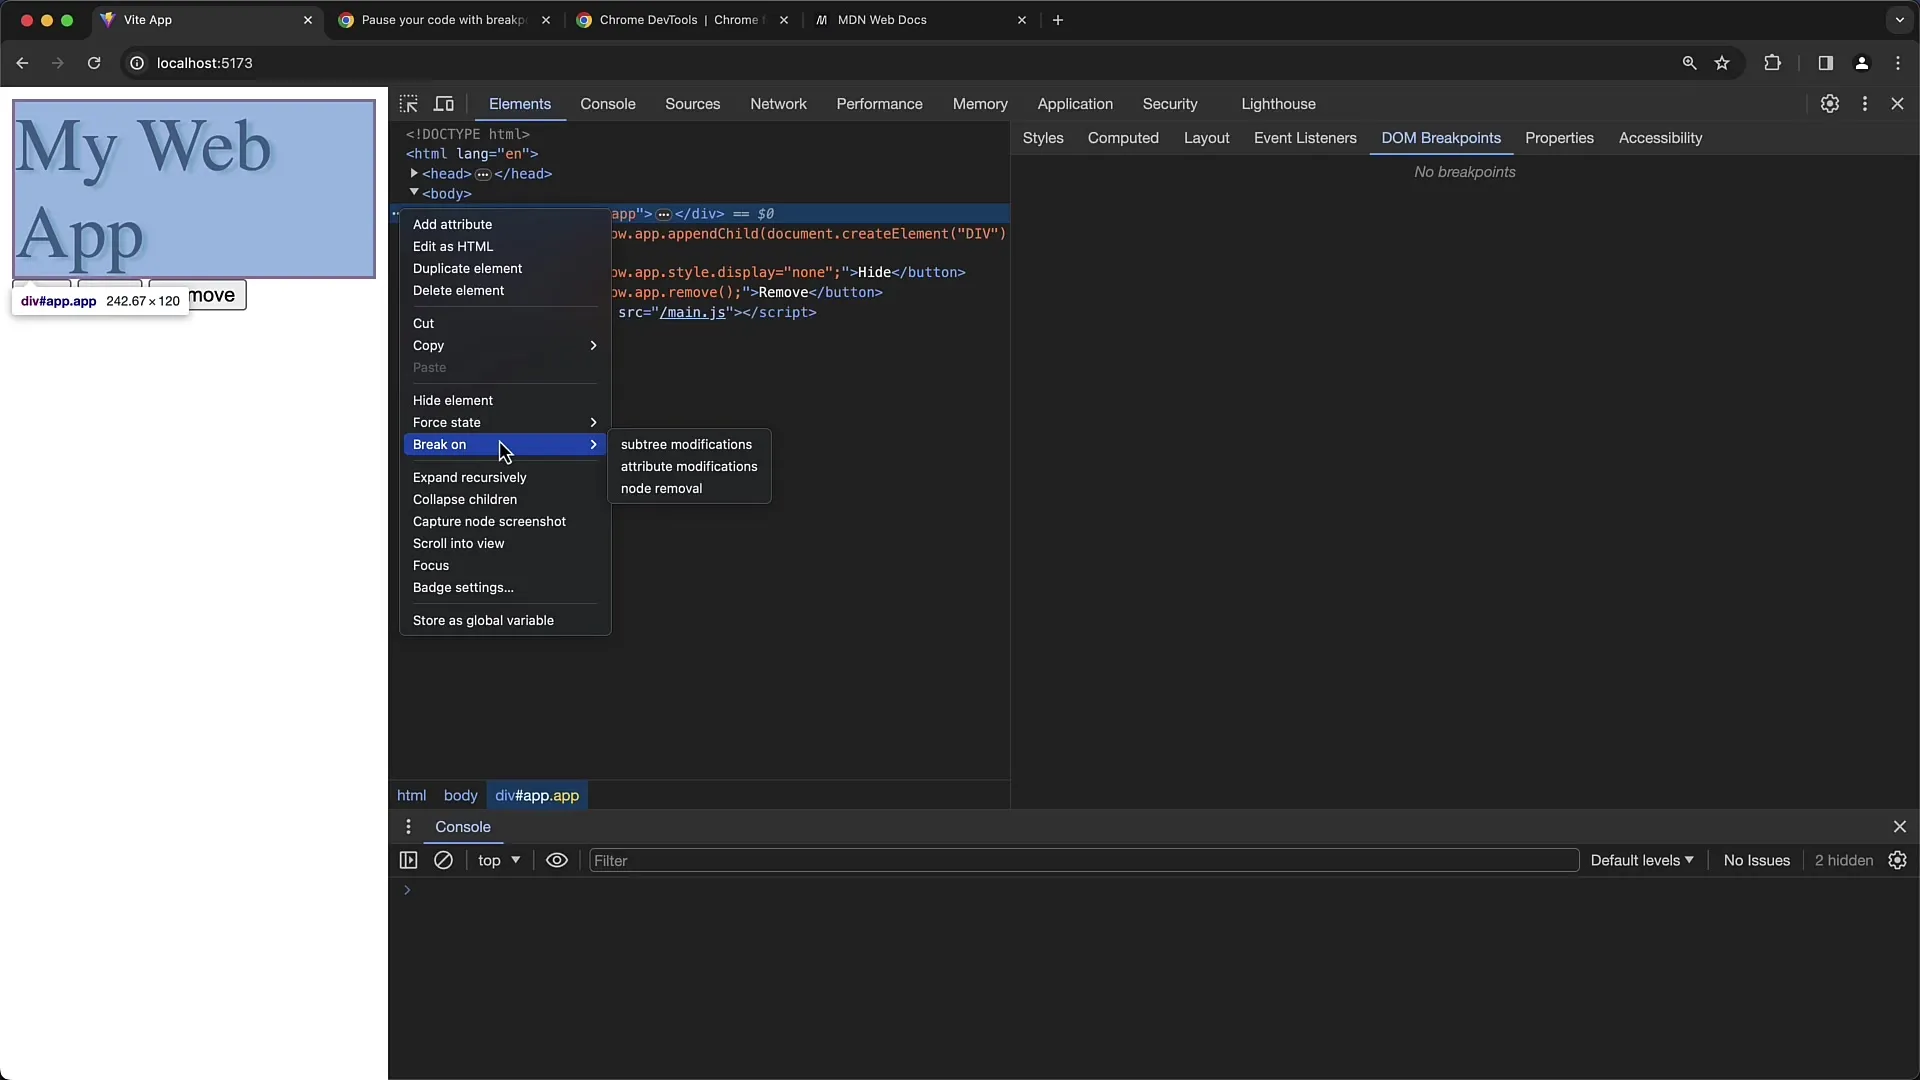
Right-click on the selected element or click on the three vertical dots in the top-right corner of the element. Now select the "Break on" option from the dropdown menu.
In the opening menu, you have three options to choose from: "Subtree Modifications," "Attribute Modifications," and "Node Removal." Let's start with the first option, "Subtree Modifications."
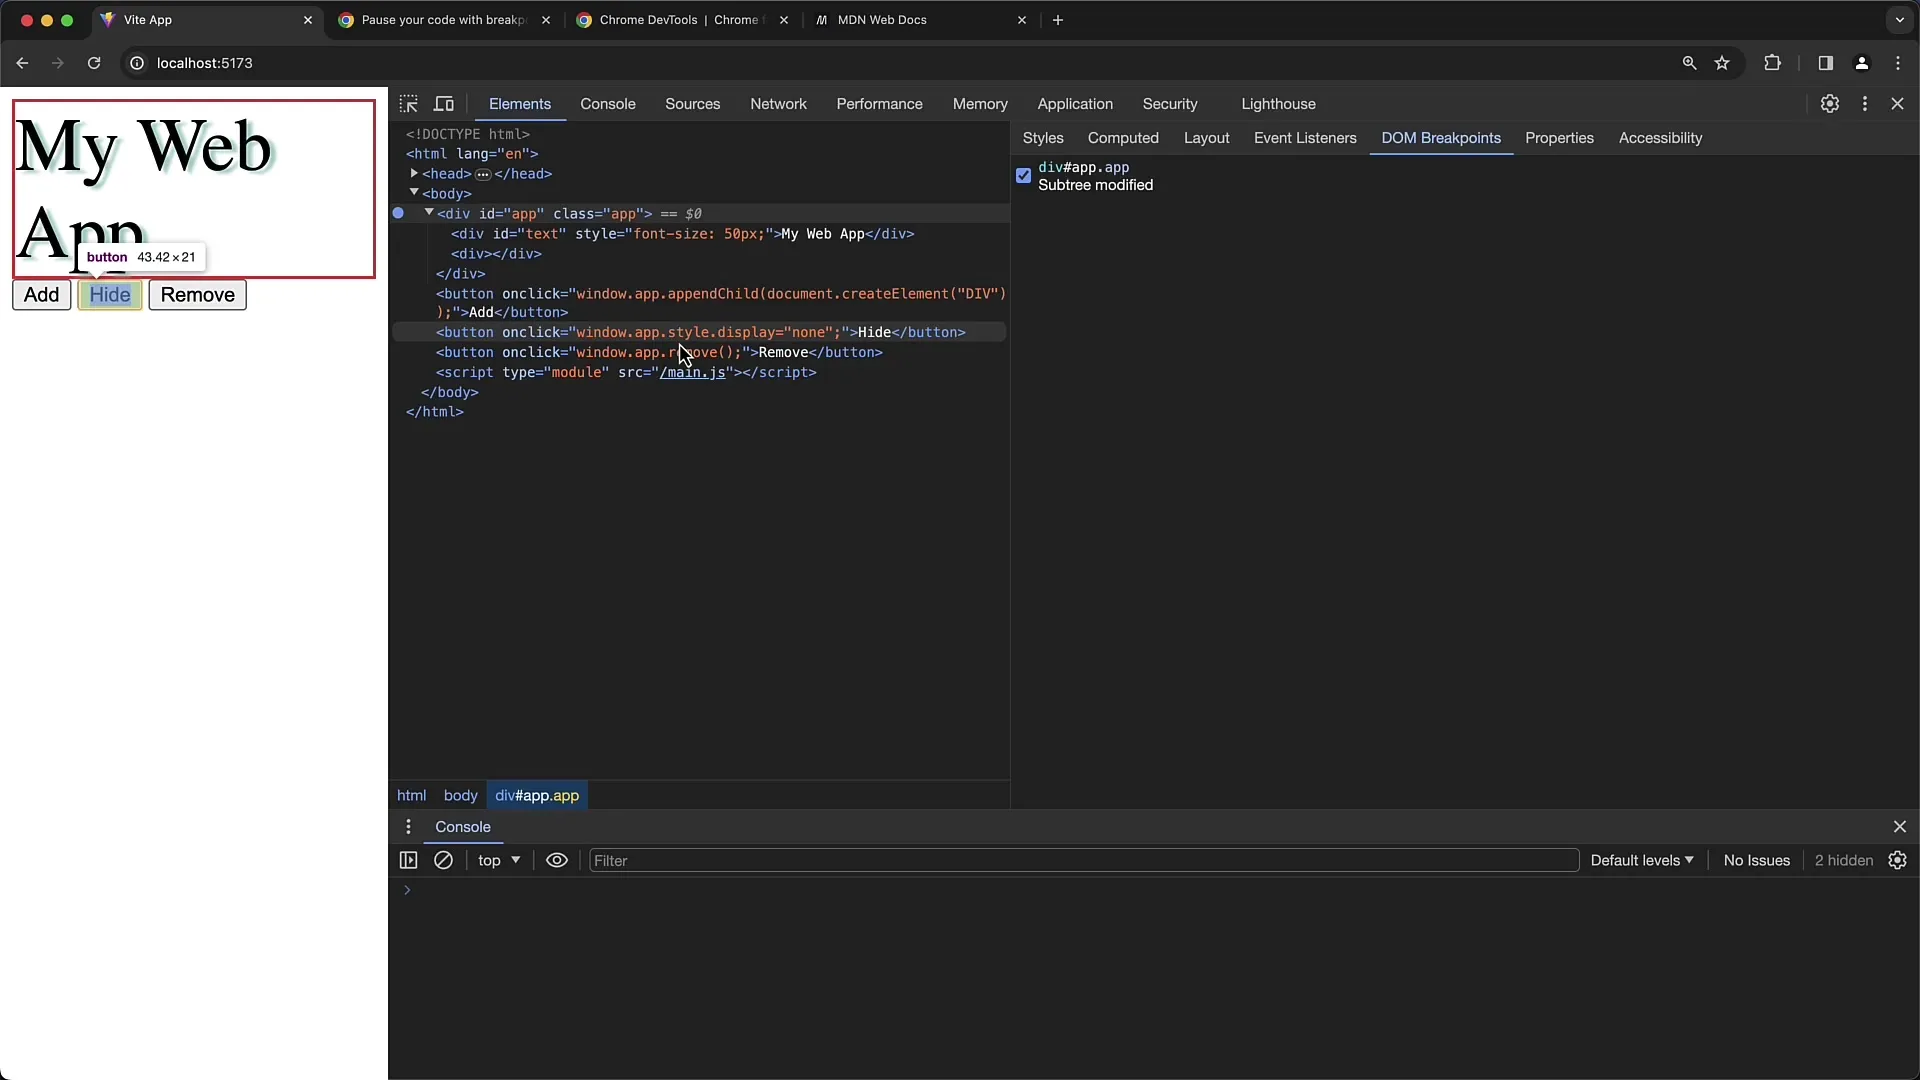
When you activate "Subtree Modifications," a breakpoint is set for any changes to the subordinate elements of the selected div element. In our example, we have a button that adds a new child to our div with the ID "App."
Now click on the button. You will notice that the script execution stops at the point where the child is added. Here you can see the exact details of the changes made.
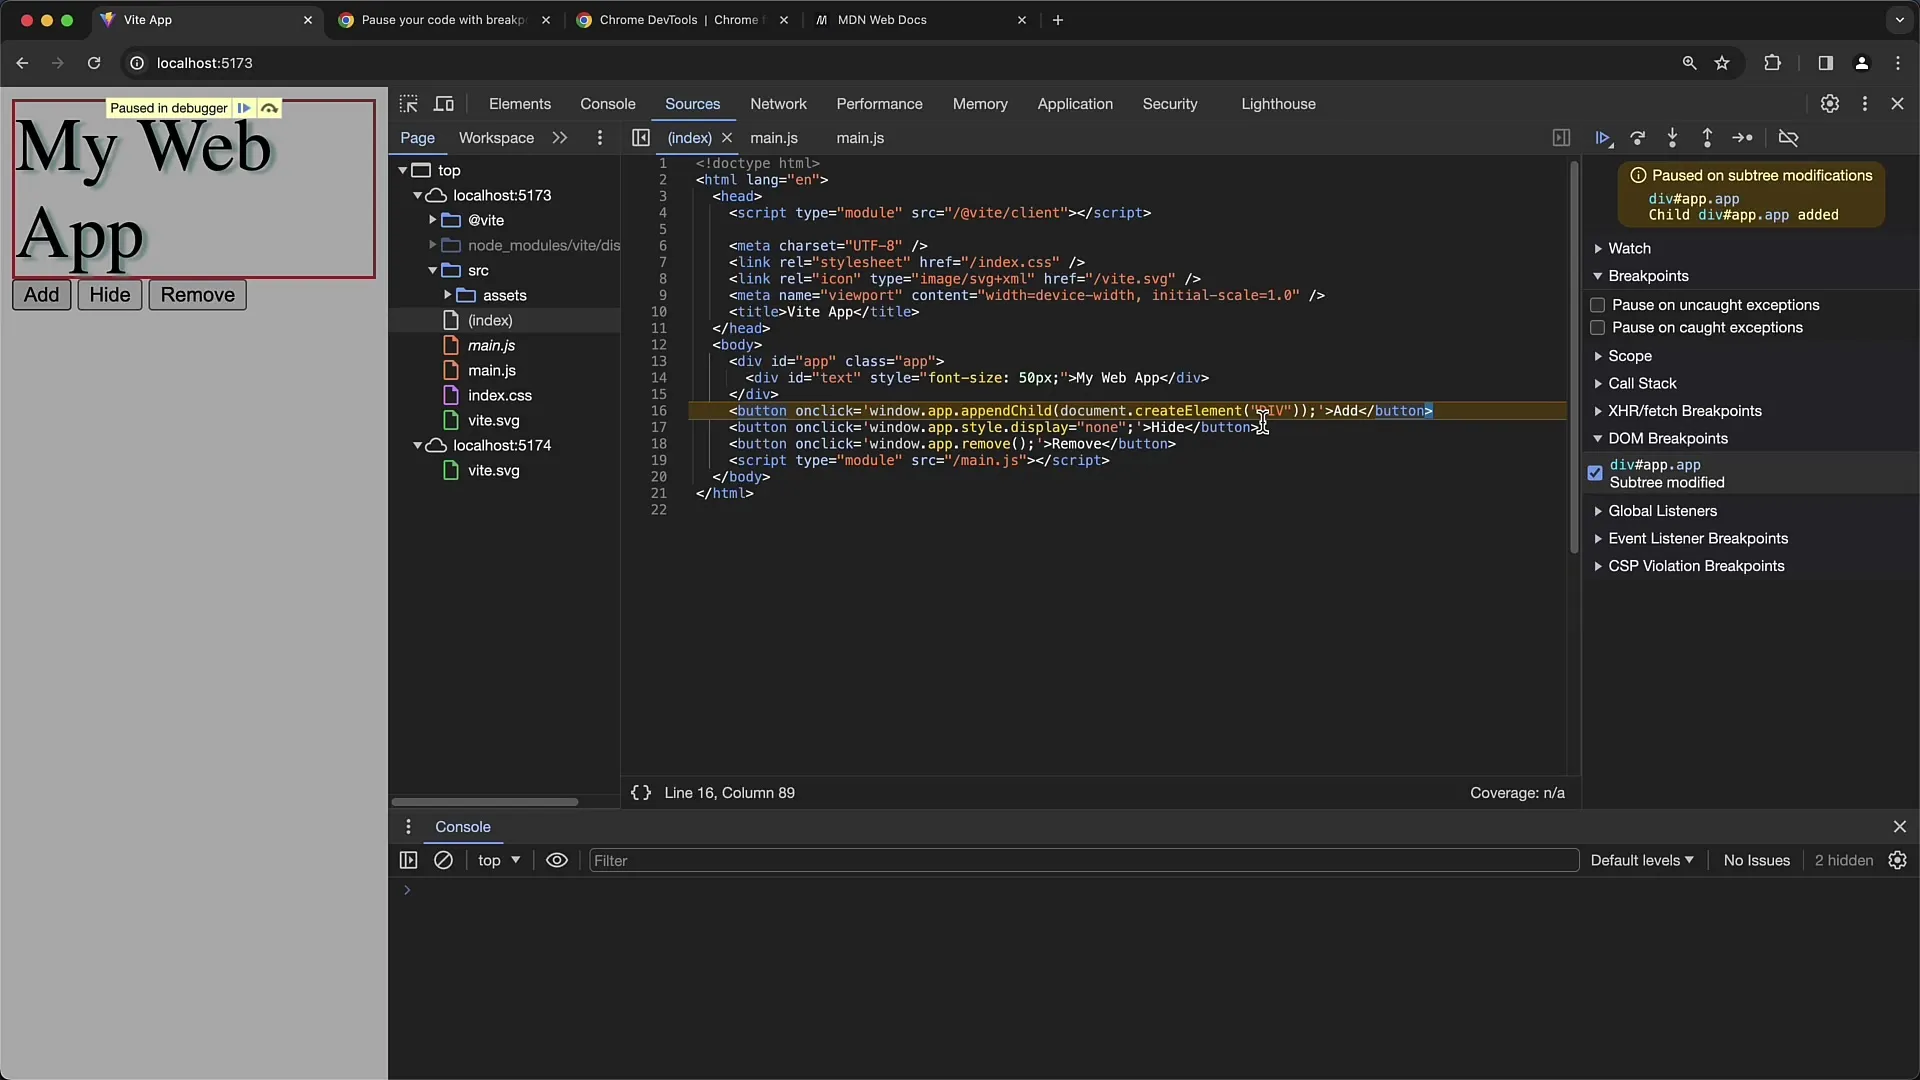
In this case, the added content corresponds to calling appendChild on the element with the ID "App." You can see that a div element is added, which represents a subtree modification.
Let's move on to the next option: "Attribute Modifications." This helps you monitor changes to the attributes of a specific element. Click on the second button that is supposed to change the style of the "App" element.
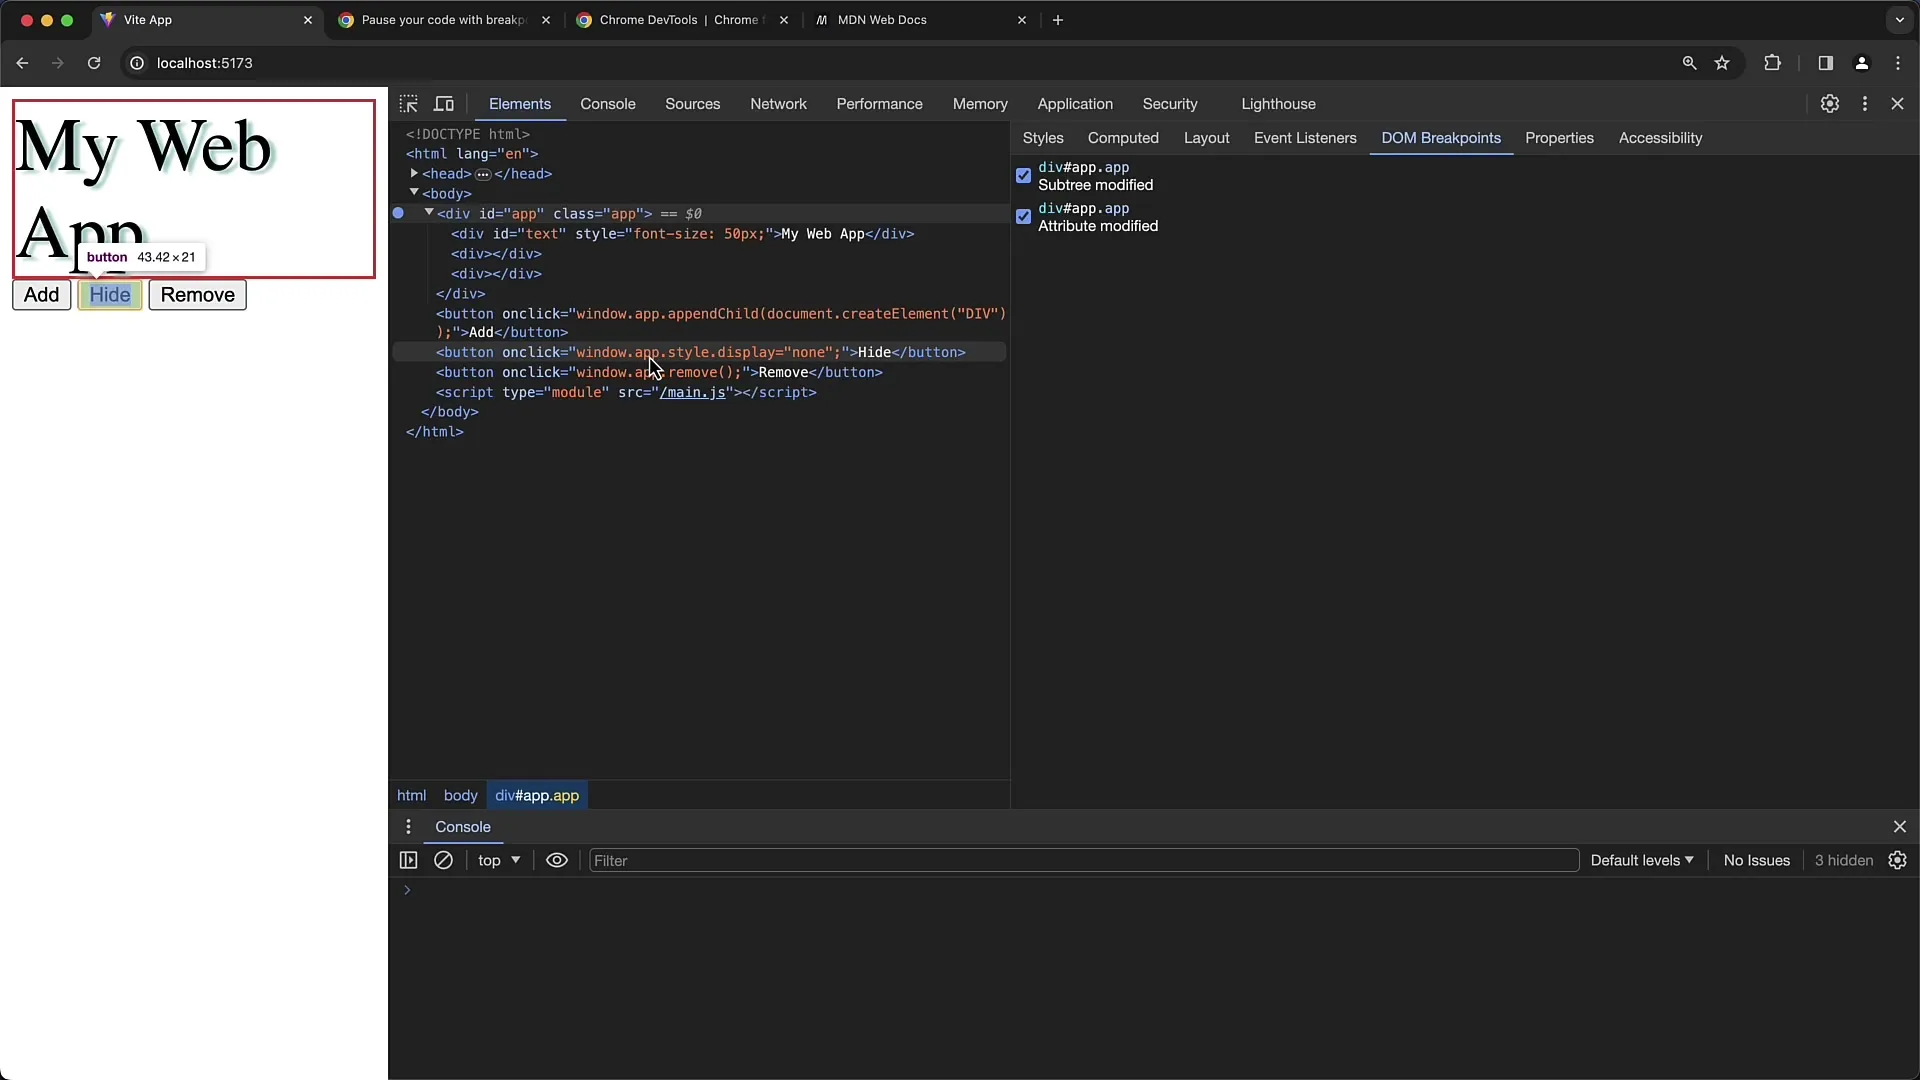
Activate the "Attribute Modifications" and click on the button. If you want to cause value changes to the element's attributes, the execution will pause again at the point where the change is made.
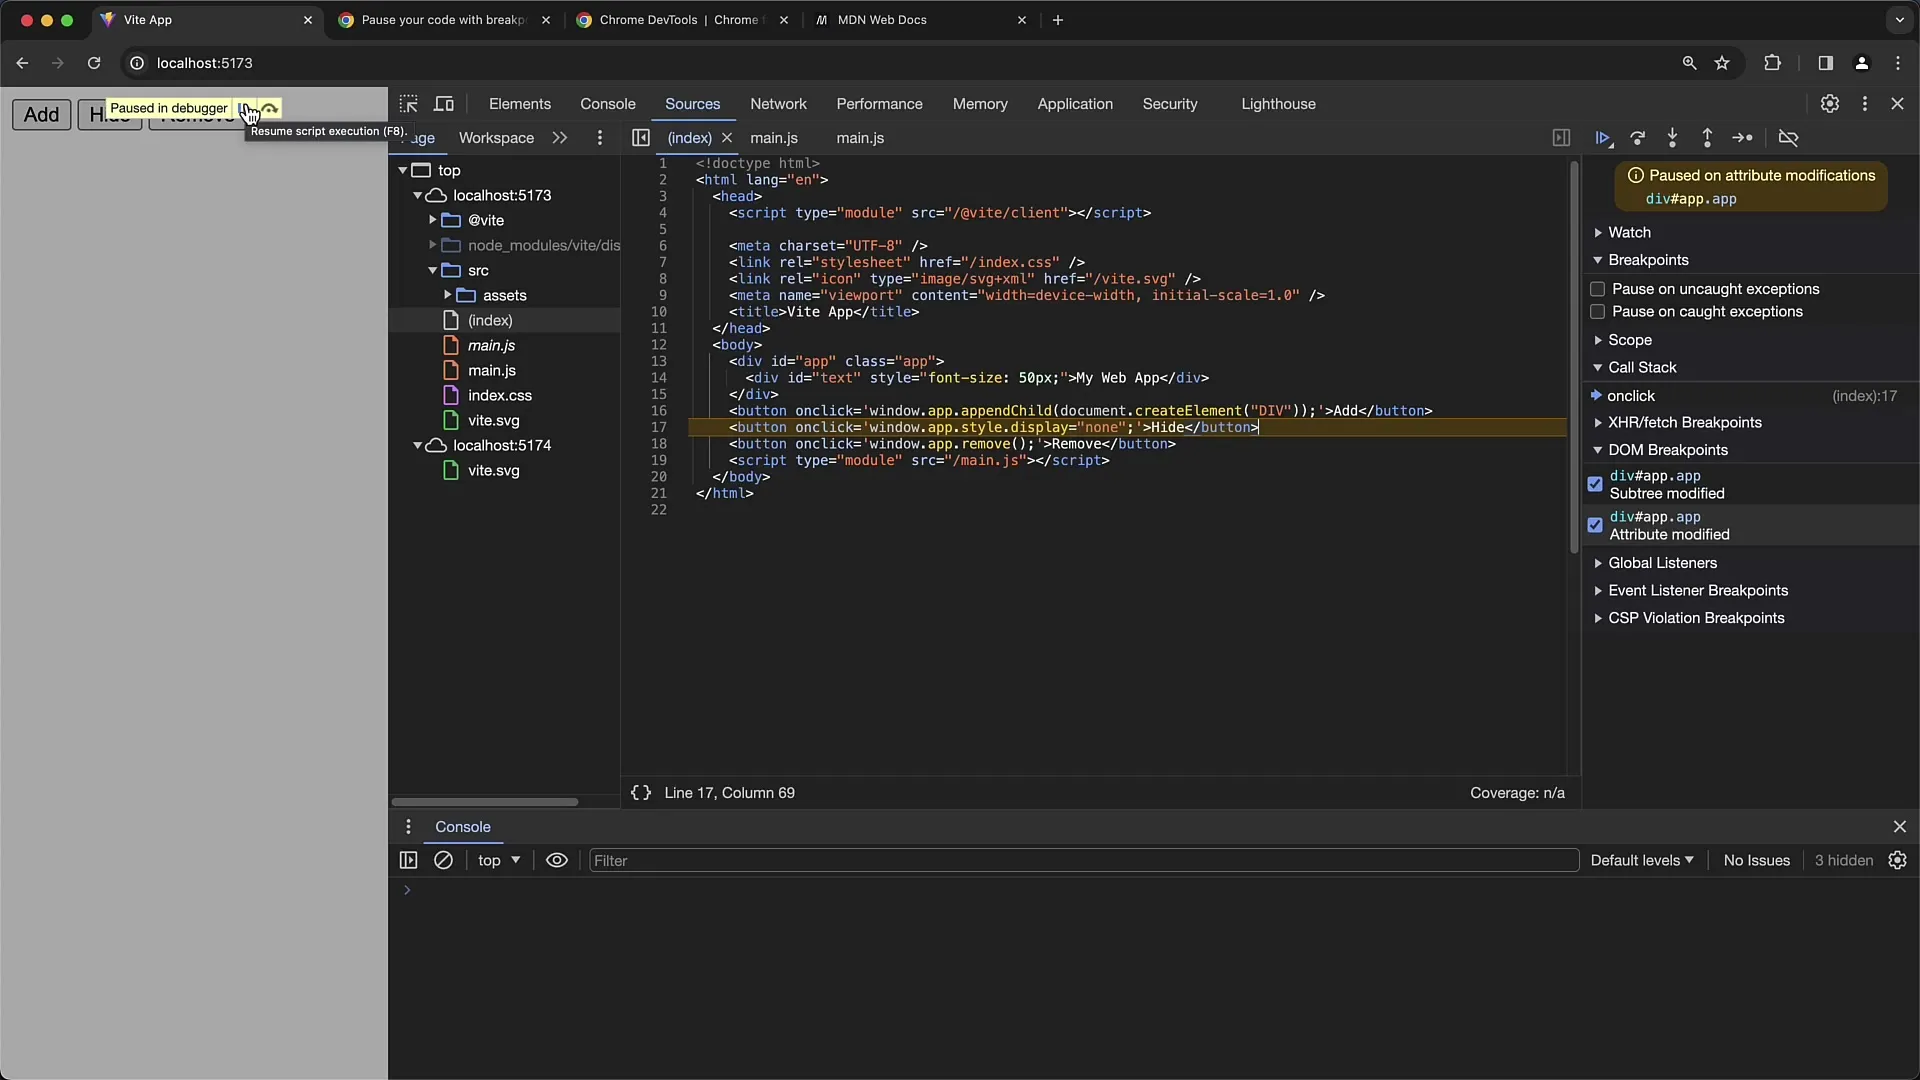
You will see that the display value of the element has been set to none, making the element invisible. This is an effective way to debug styles and attributes.
Finally, there is the option "Node Removal." This monitoring is helpful if you want to track when an element is removed. Activate this breakpoint and hit the third button that is supposed to remove the element.
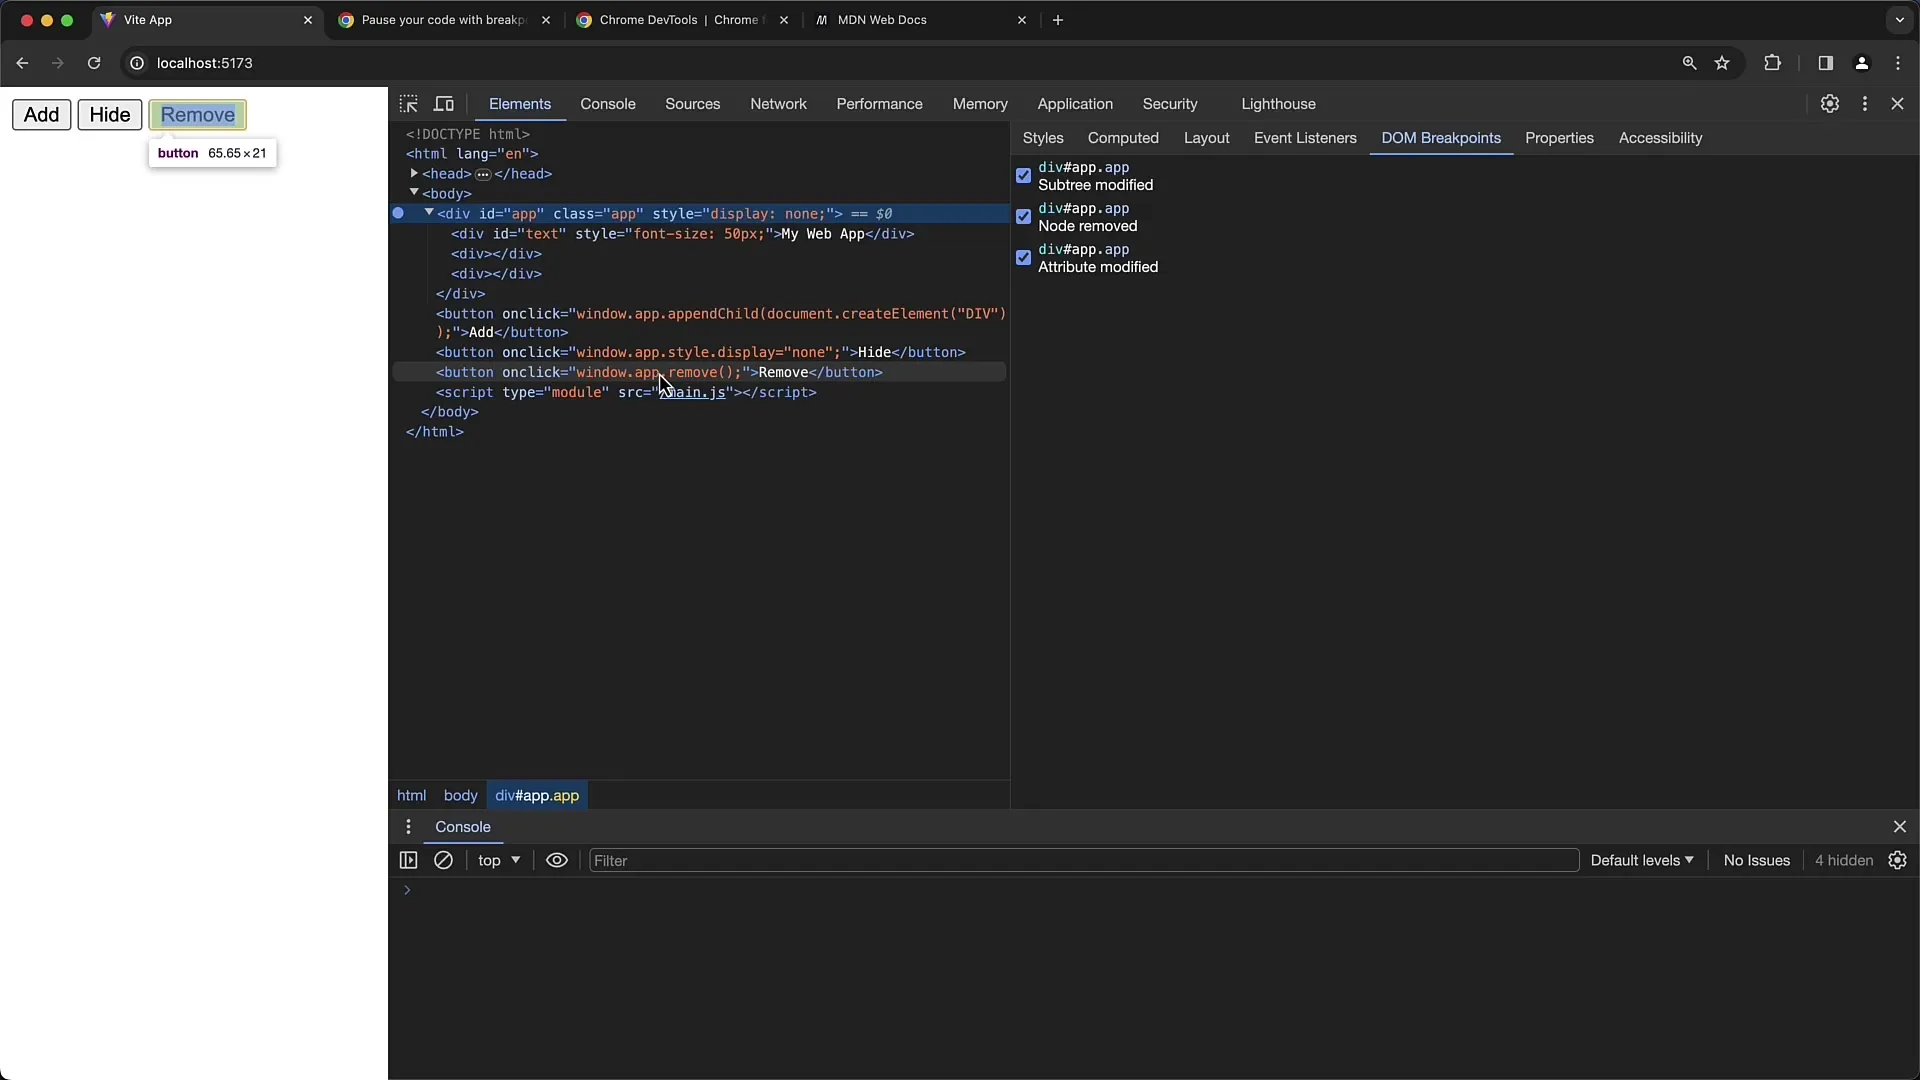
The element is deleted, and your debugger will pause at that point again, allowing you to see that the remove command has deleted the element.
A note: When you remove an element, the set breakpoints also disappear. You must set them again to continue using them.
In the Elements panel, you can see all the set DOM breakpoints. These are important if you want to gain deeper insights into editing your DOM structures.
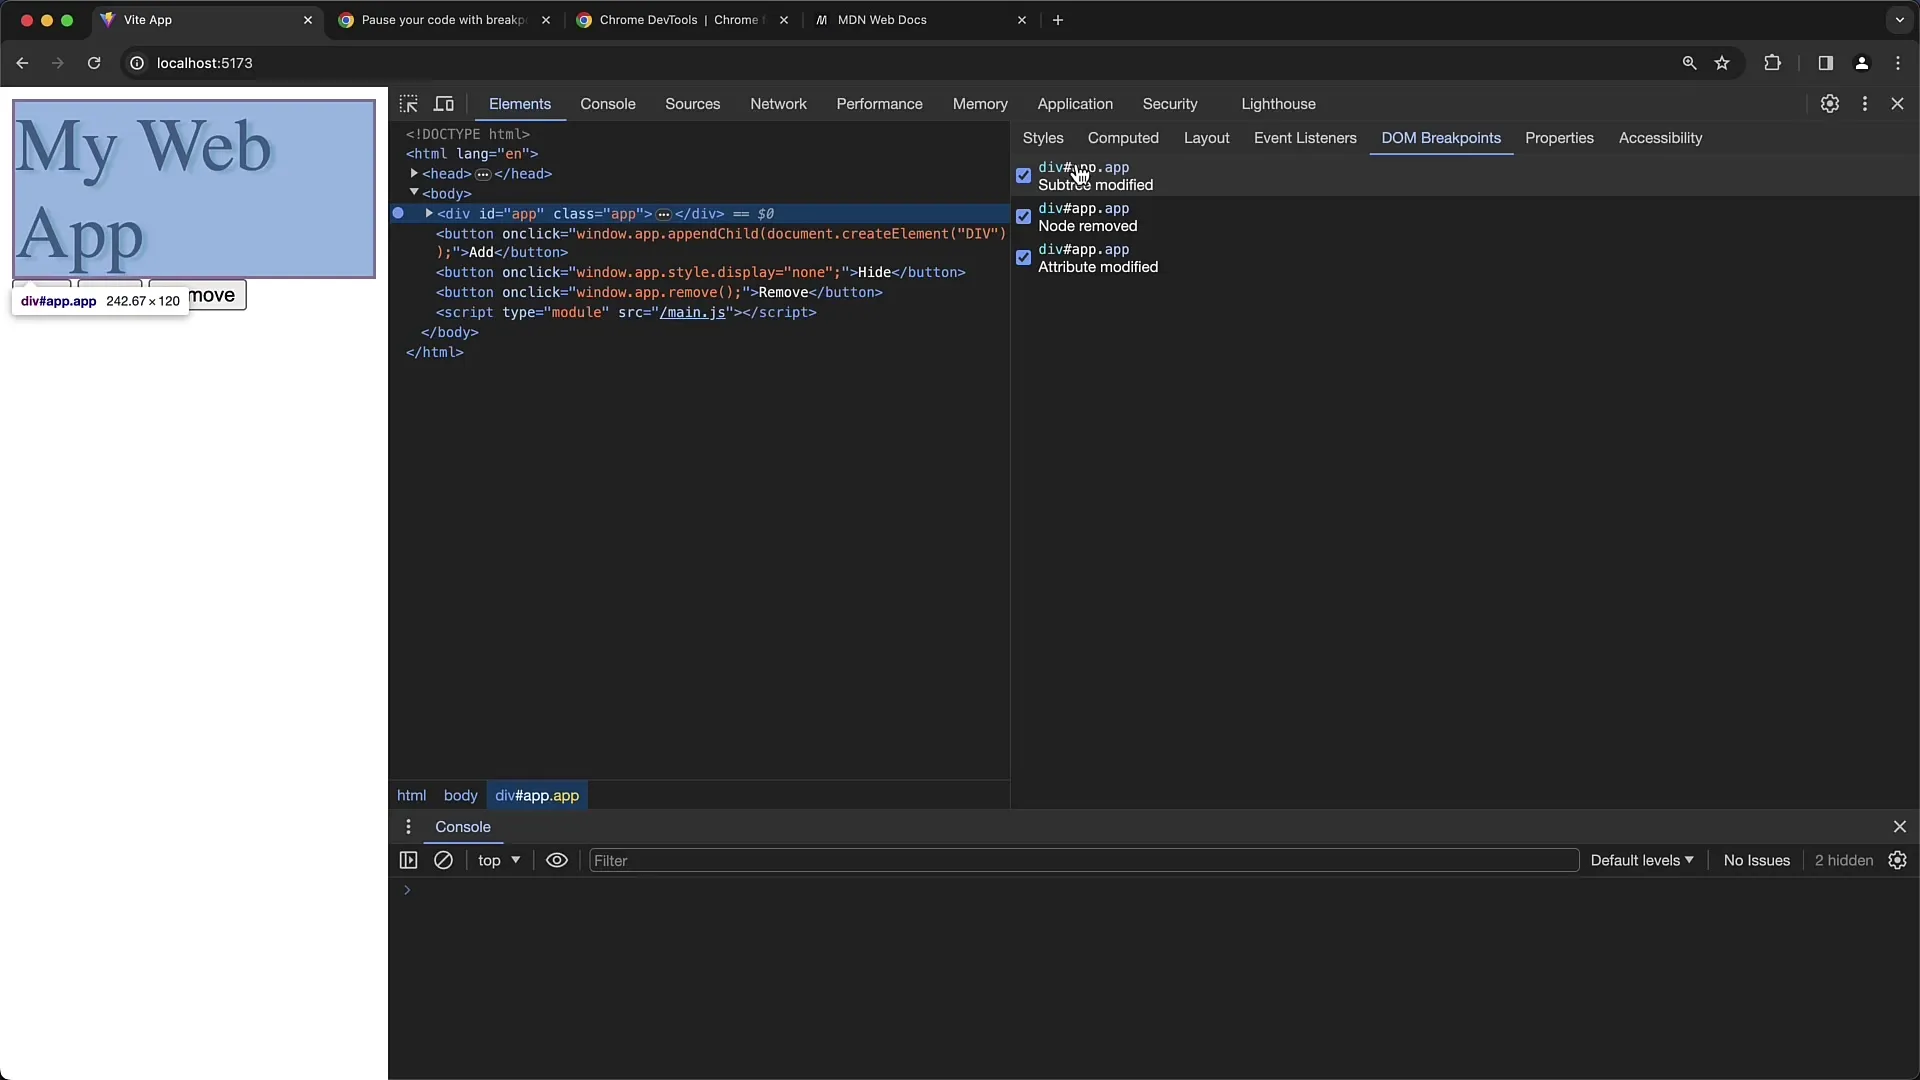
In summary, using DOM breakpoints helps you systematically track how and when changes are made to your DOM. This is invaluable when dealing with complex DOM manipulations.
Summary
By effectively using DOM breakpoints, you can monitor specific changes in your DOM, helping you identify issues faster and optimize your web applications.
Frequently Asked Questions
What are DOM Breakpoints?DOM Breakpoints are features in the Chrome Developer Tools that allow you to monitor when changes are made to DOM elements.
How do I set a DOM Breakpoint?Select an element in the Developer Tools, right-click, and choose "Break on" to select different types of breakpoints.
What types of DOM Breakpoints are available?There are three types: Subtree Modifications, Attribute Modifications, and Node Removal.
When are DOM Breakpoints useful?They are useful when you want to understand and debug the behavior of DOM manipulations.
What happens if I remove an element with a breakpoint?If you remove an element, the associated breakpoints also disappear. You will need to set them again to continue using them.


