In this guide, I'll show you how to debug a simple TypeScript application simulating a calculator. The goal is to identify the bug that causes the addition of two numbers to not produce the expected result. The Chrome Developer Tools are used in this practical exercise to analyze the code and quickly find the bug. Through this guide, you will understand the importance of debugging and which tools can assist you.
Key Takeaways
- By using Chrome Developer Tools, you can easily analyze the state of your application.
- Type checking in TypeScript helps to detect errors early before the code is executed.
- The importance of types and proper value handling is crucial to avoid errors.
Step-by-Step Guide
First, launch your Chrome browser and load the web application with the TypeScript implementation of the calculator. The project should already be running on a server so that you can open the HTML file in Chrome.
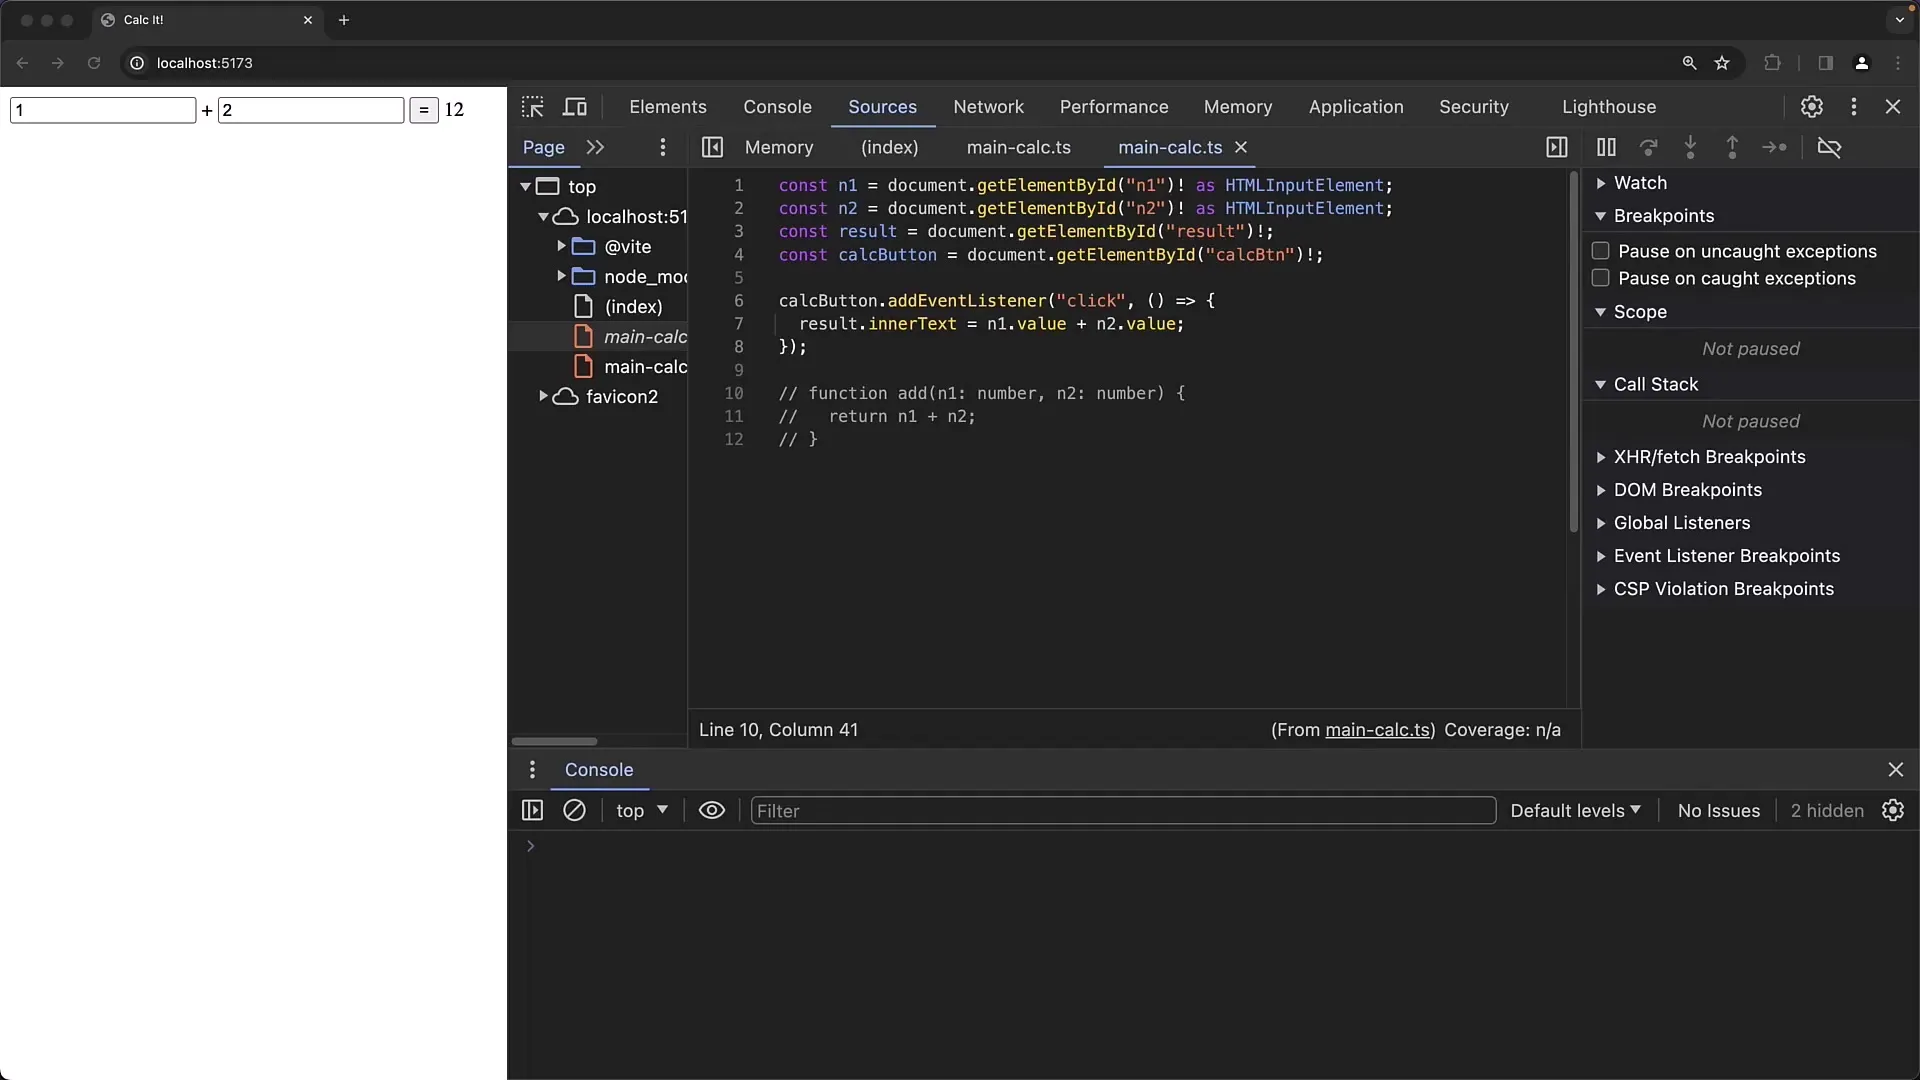
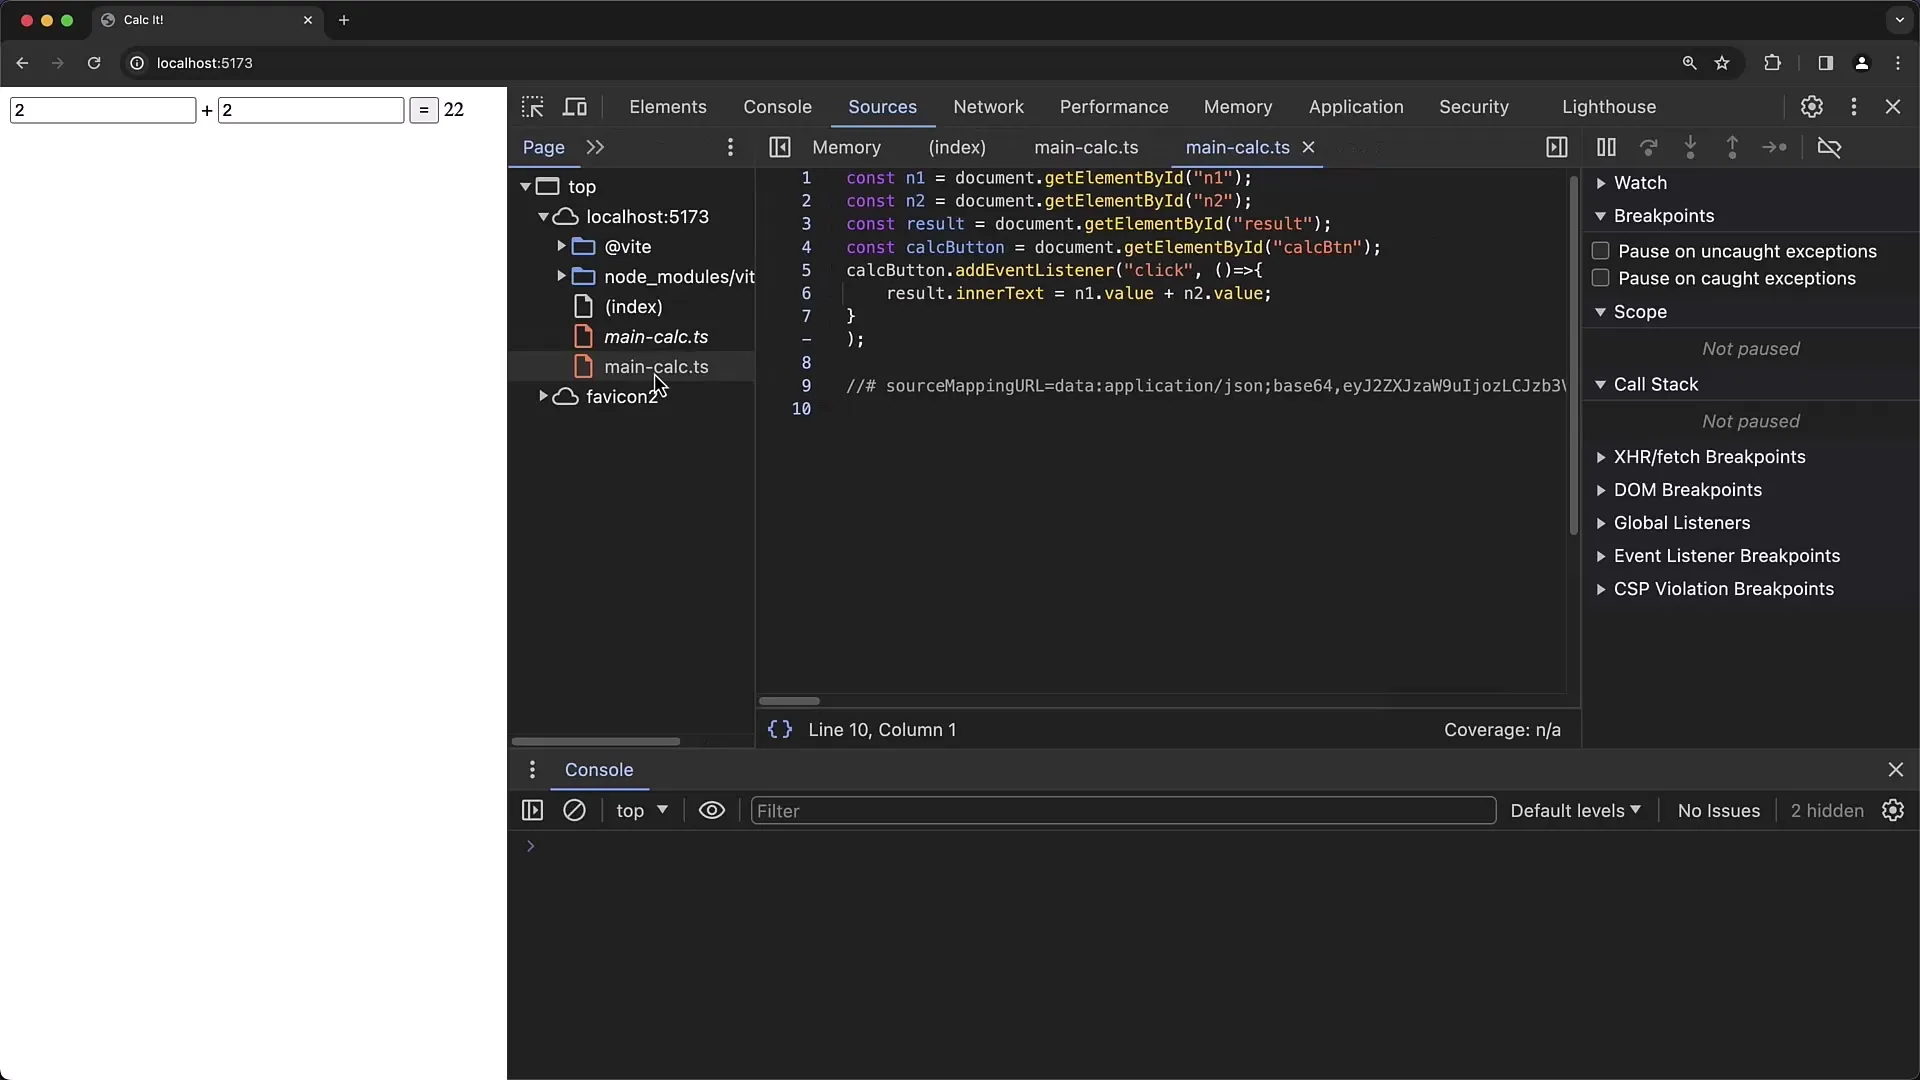
Next, make sure that both the TypeScript and JavaScript files (transpiled file) are present in your project. The TypeScript file contains comments and type information, while the transpiled JavaScript files do not contain this information.
Open the Chrome Developer Tools by right-clicking on the page and selecting "Inspect" or by pressing F12. Go to the "Elements" tab to view the HTML code of the page and ensure that the input fields and button are set up correctly.
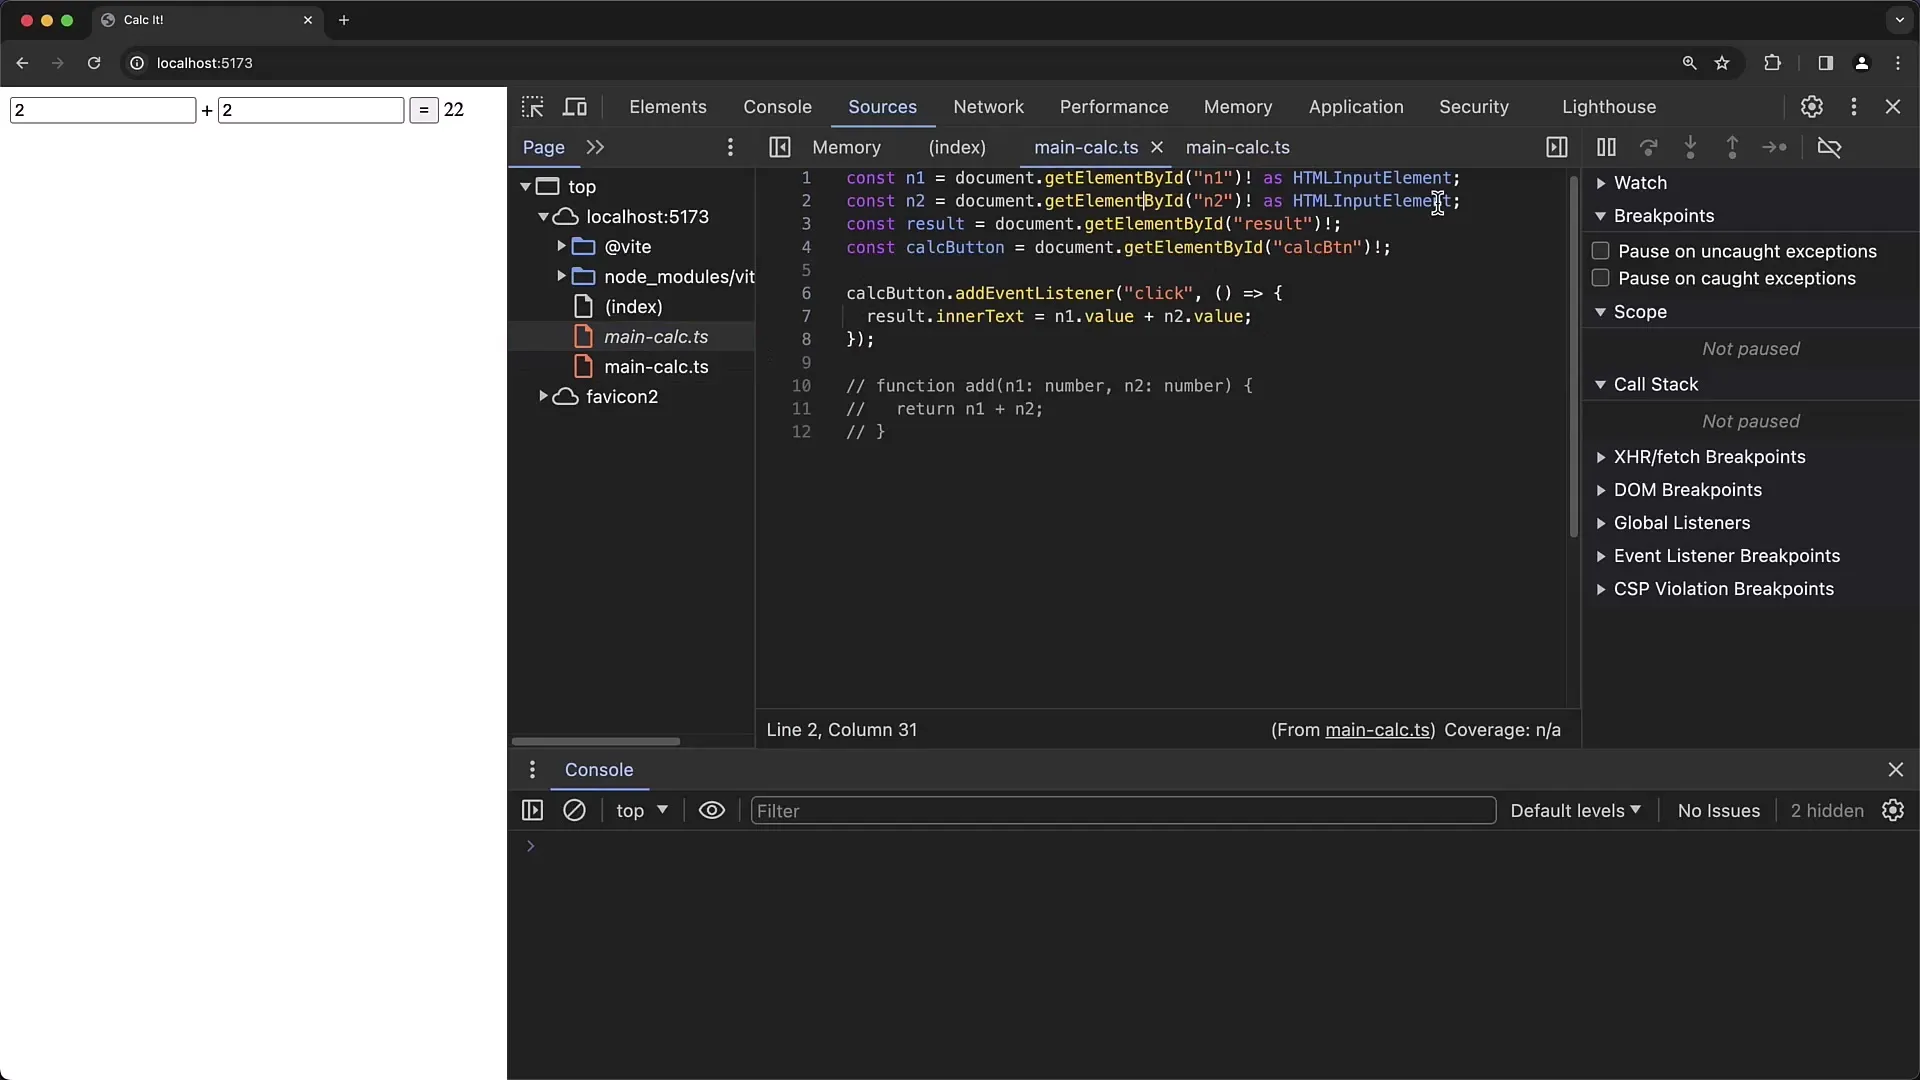
The calculator has two input fields for numbers and a button to trigger the addition. You can enter some test values and click the button. You'll notice that the sum is not calculated correctly; you might get 22 instead of the expected 4. Debugging is necessary to clarify this deviation.
Now, set a breakpoint in your code by clicking on the event listener function responsible for the addition. This occurs in the section that handles the addition. When you enter values in the input fields and click the button, you should enter the debugger.
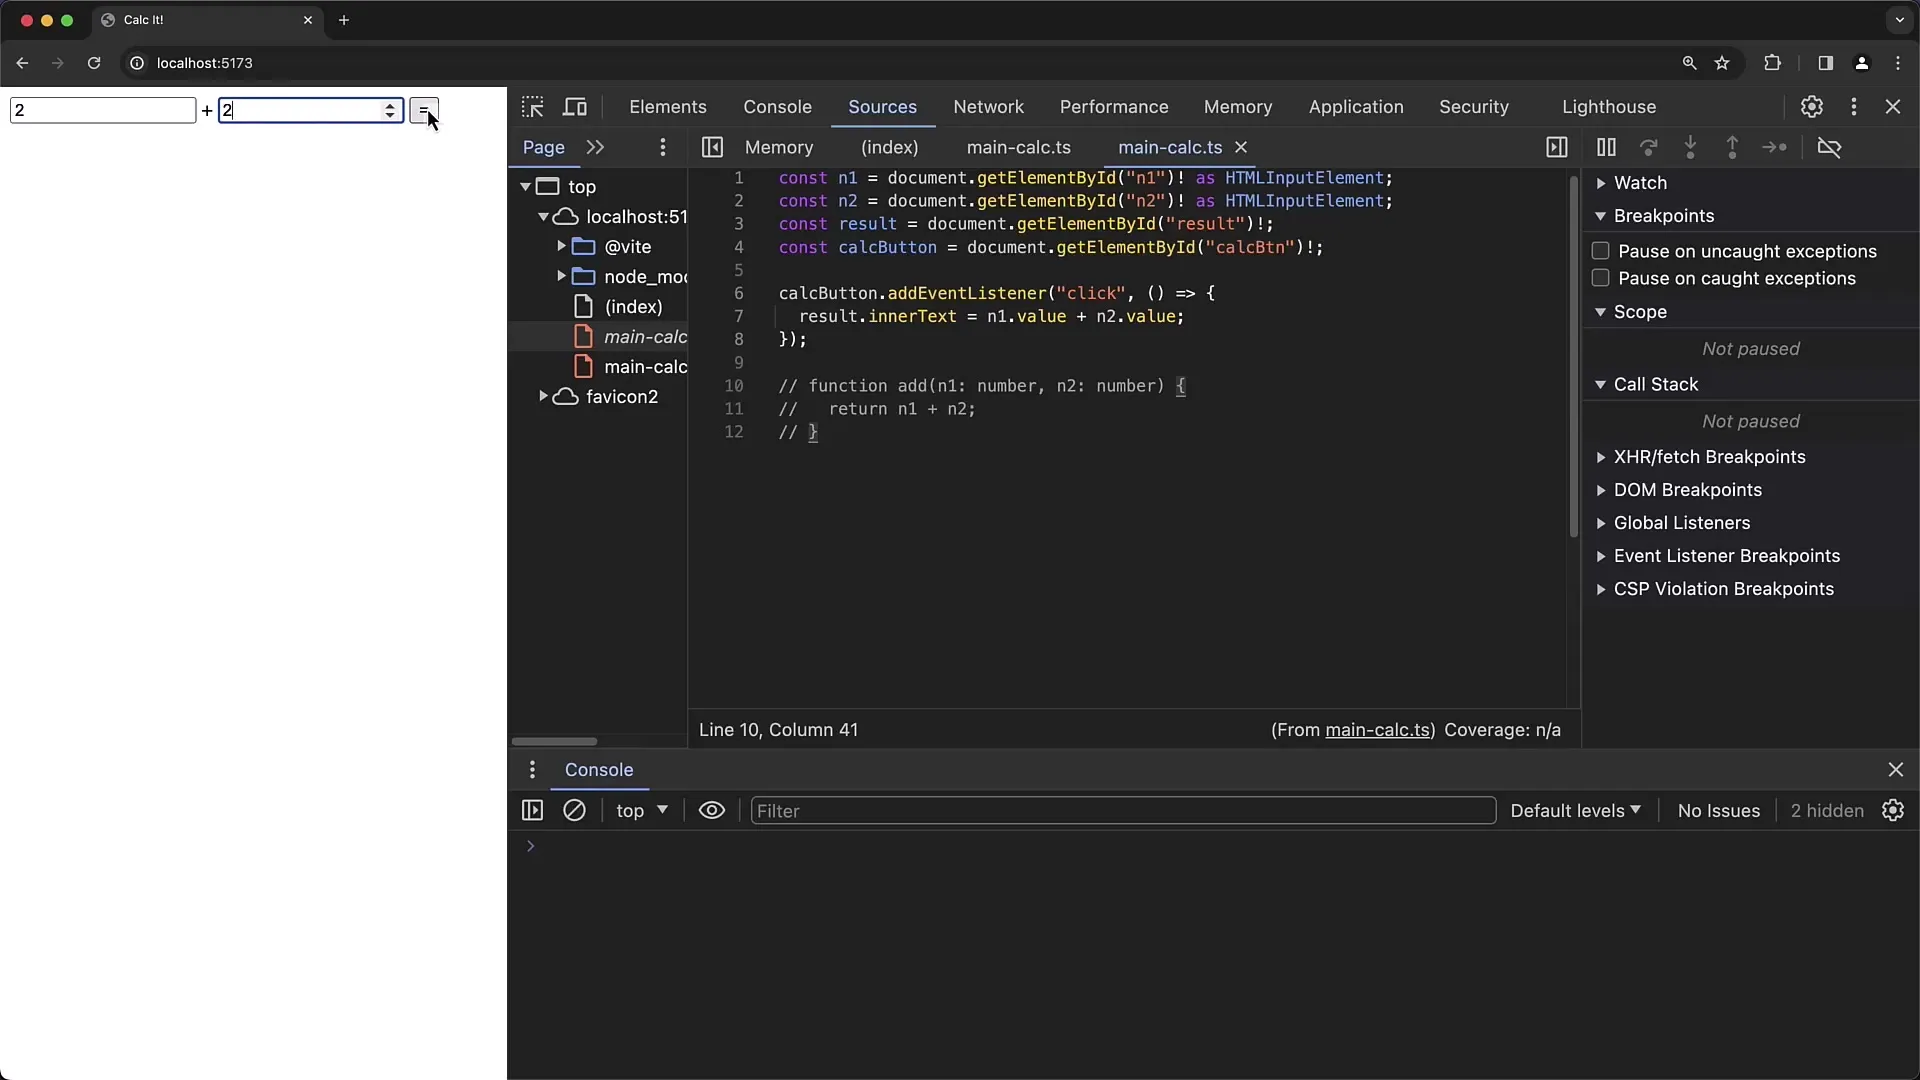
In the debugger view, you can inspect the variables. In particular, it is important to check the inner text and the values of the input fields to see which values are being passed. You'll notice that the values of the input fields are of type String, not Number as you expected.
This type conflict causes the addition to not work correctly. Instead of adding the numbers, they are concatenated. For example, entering "1" and "6" results in "16", which is not the desired outcome. This logical error is easy to understand but important to identify.
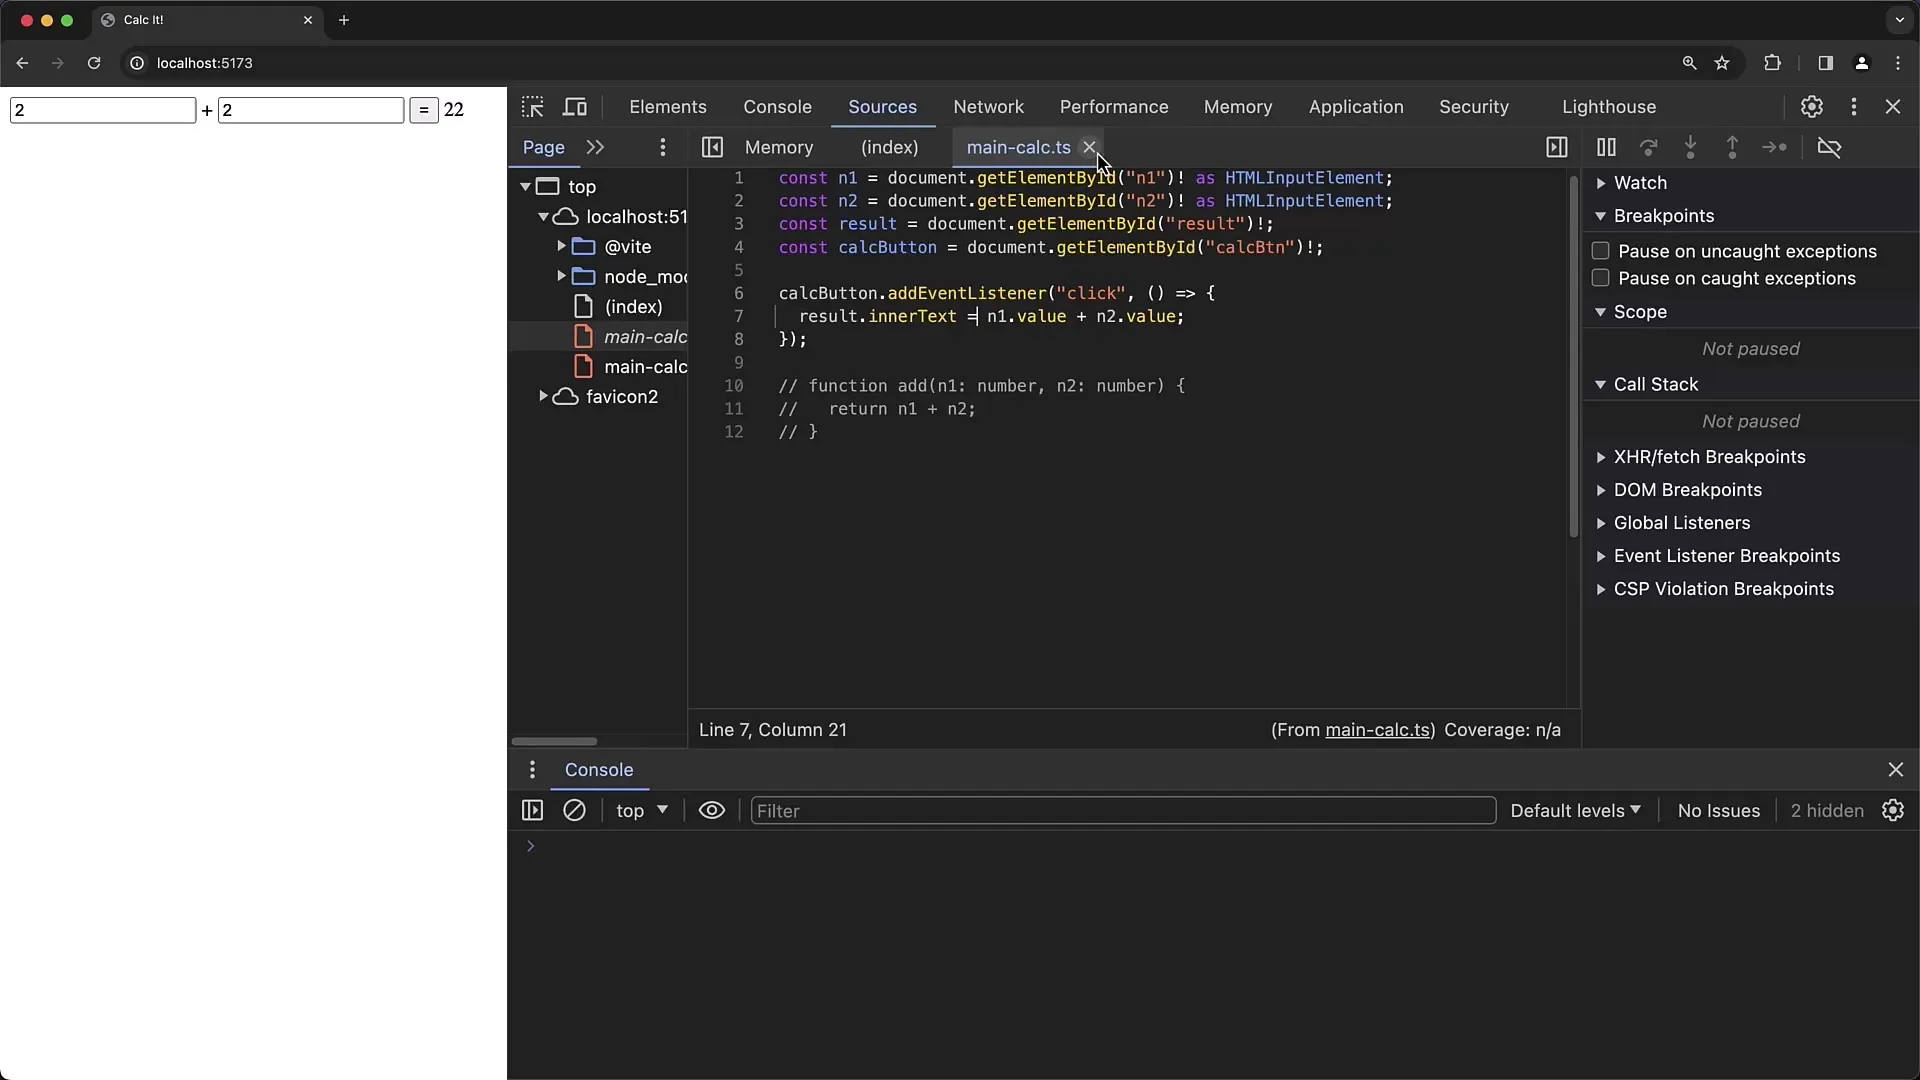
Now, fix the error. Go back to your TypeScript file in Visual Studio Code and change how the values are processed. Instead of n1.value + n2.value, use n1.valueAsNumber + n2.valueAsNumber to ensure they are numbers, not strings.
After making the change, save the file and refresh the page in Chrome. Then review the values in the input fields before adding them. This time, the correct sum of two numbers will be displayed.
If everything was done correctly, when you press the button, the sum will be displayed as "10" if you enter values like "2" and "8," for example. You have successfully fixed the bug and learned how important type checking is in TypeScript.
Additionally, you can leverage the benefits of TypeScript by clearly defining variable types. This significantly reduces the possibility of runtime errors. Always remember to specify types to make debugging easier.
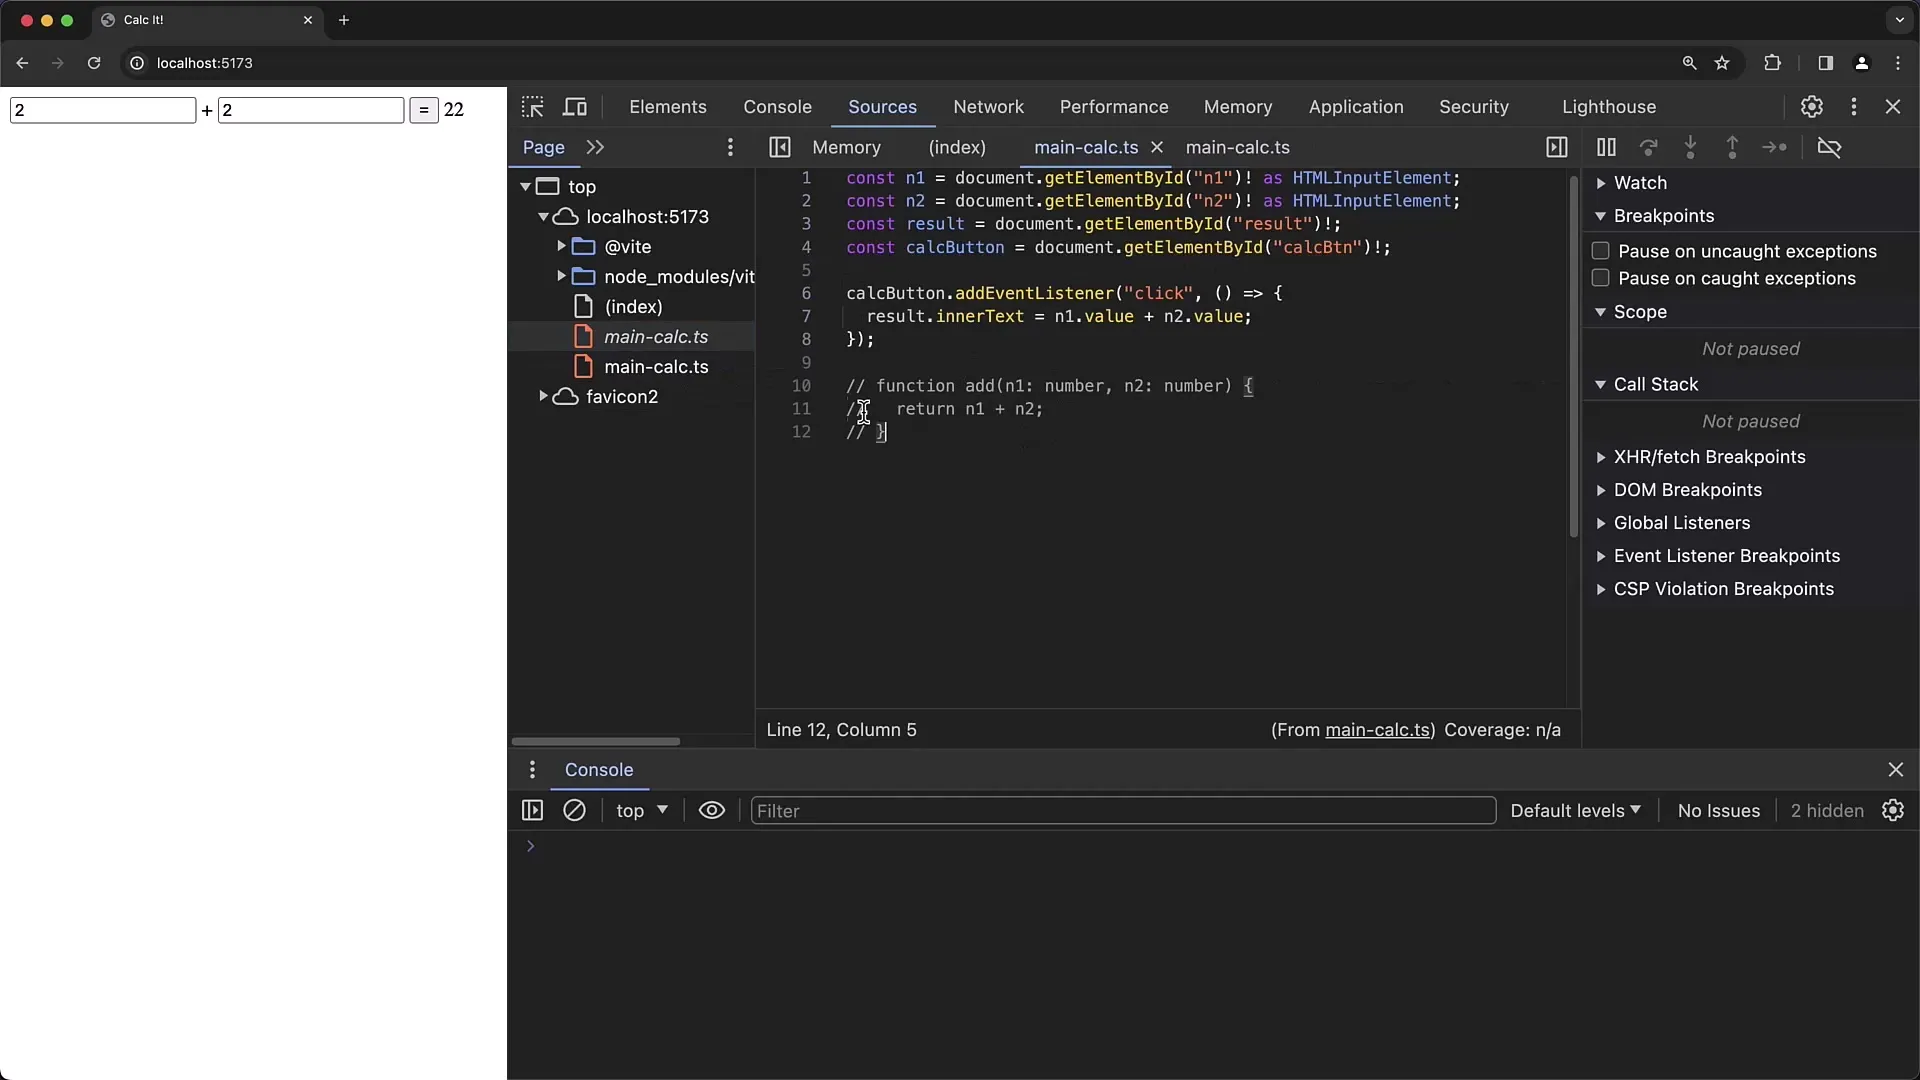
Finally, you have also seen how important the Chrome Developer Tools are for analyzing the code and behavior of an application in real time. Debugging with these tools can significantly contribute to improving your development processes.
Summary
In this guide, you have learned how to debug a simple TypeScript application. Special attention was given to the use of Chrome Developer Tools taking into account the types in TypeScript. Ultimately, you have realized how important it is to detect errors early and how crucial type checking can be in TypeScript.
Frequently Asked Questions
What was the main error found in the TypeScript application?The main error was that string values were used instead of numbers, leading to incorrect calculations.
What role do Chrome Developer Tools play in debugging?Chrome Developer Tools help analyze the code in real time and identify errors in the program flow.
How can you avoid errors in TypeScript?By defining types in TypeScript, you can reduce runtime errors and ensure that only the correct data types are used.


