Debugging tools are crucial for analyzing code and identifying errors. The Chrome Developer Tools offer a variety of functions to help you monitor network requests and understand how your application communicates with the server. In this guide, we focus on Fetch-Breakpoints, which allow you to pause the code as soon as a network request is made. This enables you to gain deeper insights into how your app works and quickly resolve any issues.
Key Takeaways
- Fetch-Breakpoints allow pausing the code at each network request.
- You can specify specific URLs to control behavior selectively.
- In the Network section of the Developer Tools, you can trace which requests were made and who triggered them.
Step-by-Step Guide
1. Accessing the Developer Tools
To work with Fetch-Breakpoints, you first need to open the Chrome Developer Tools. You can do this by clicking on the three-dot menu in the top right corner of Chrome, then going to "More Tools" and finally selecting "Developer Tools". Alternatively, you can also use the keyboard shortcut Ctrl + Shift + I on Windows or Cmd + Option + I on Mac.

2. Navigating to the Sources
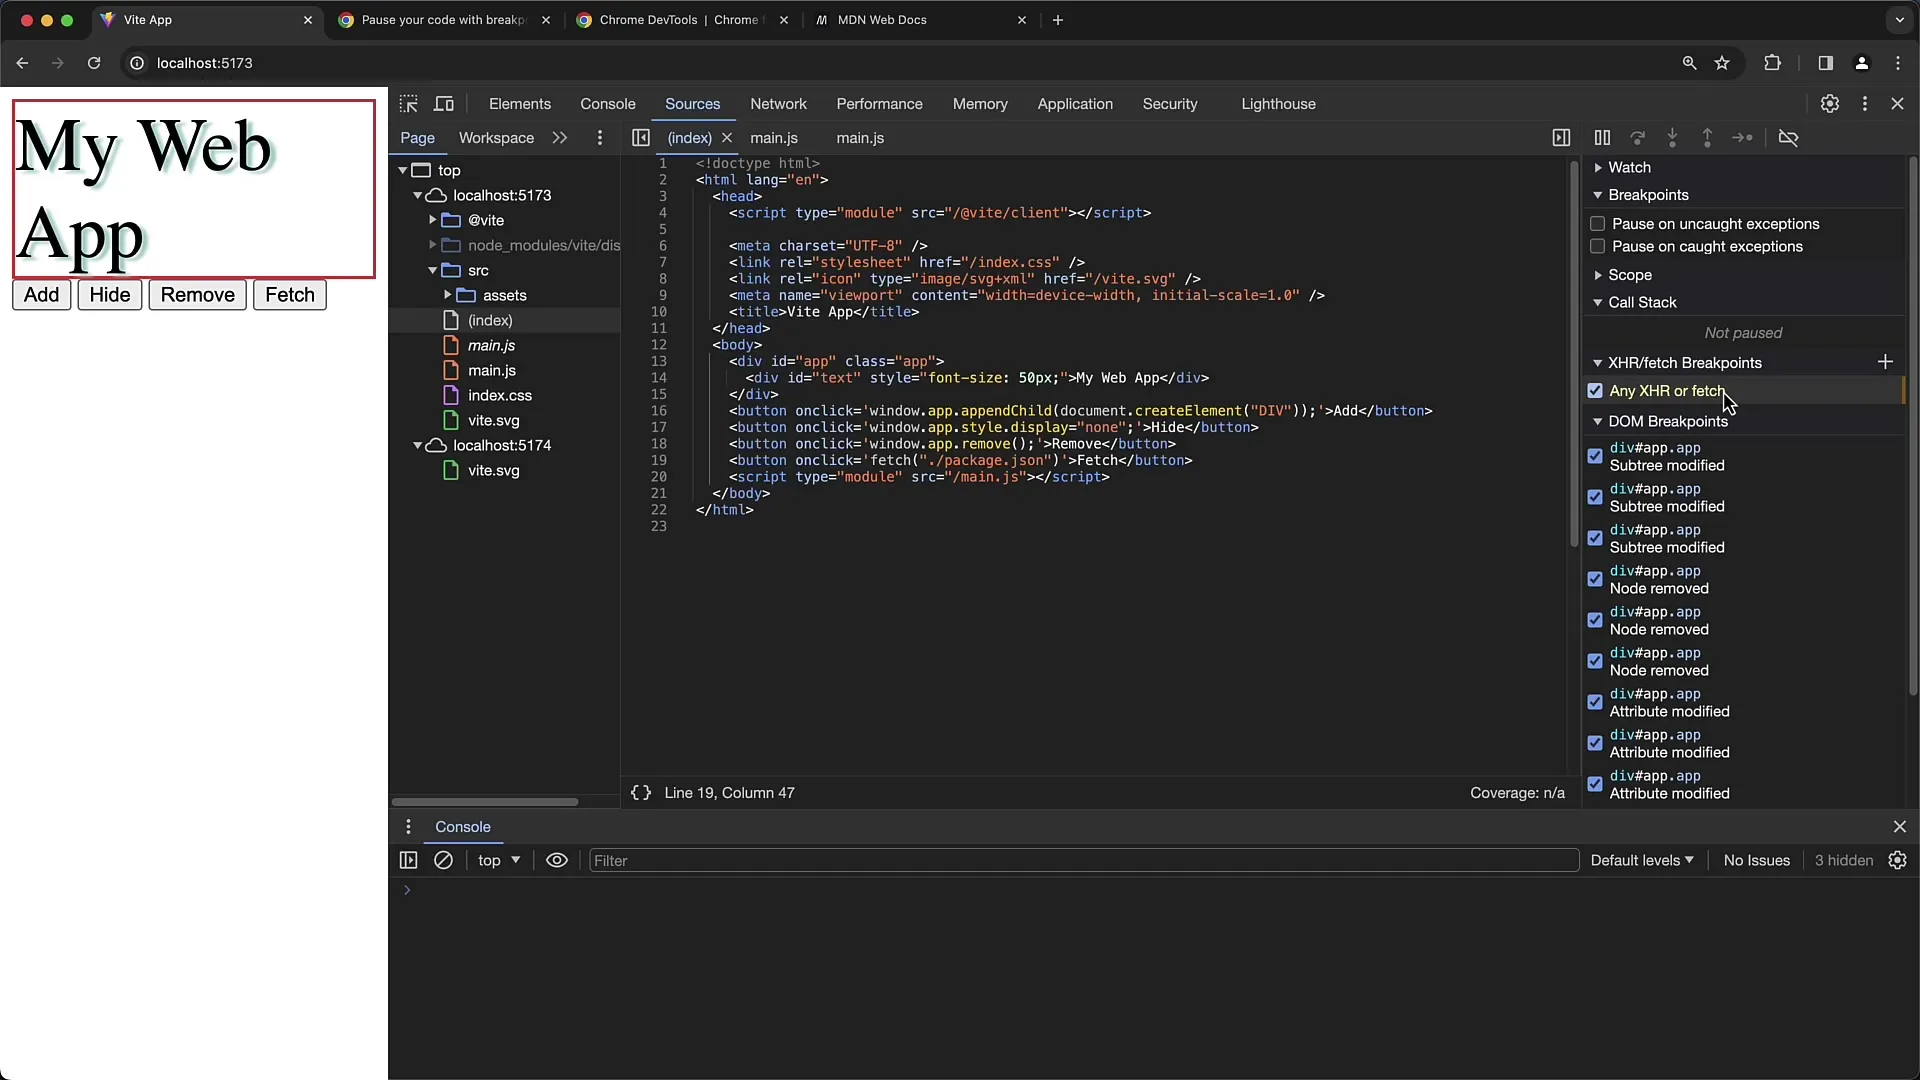
In the Developer Tools, you will find tabs such as "Elements", "Console", "Sources", "Network," and many more. You must now click on the "Sources" tab to access the source of your project. Here, you can view your JavaScript code and set breakpoints.
3. Setting a Fetch-Breakpoint
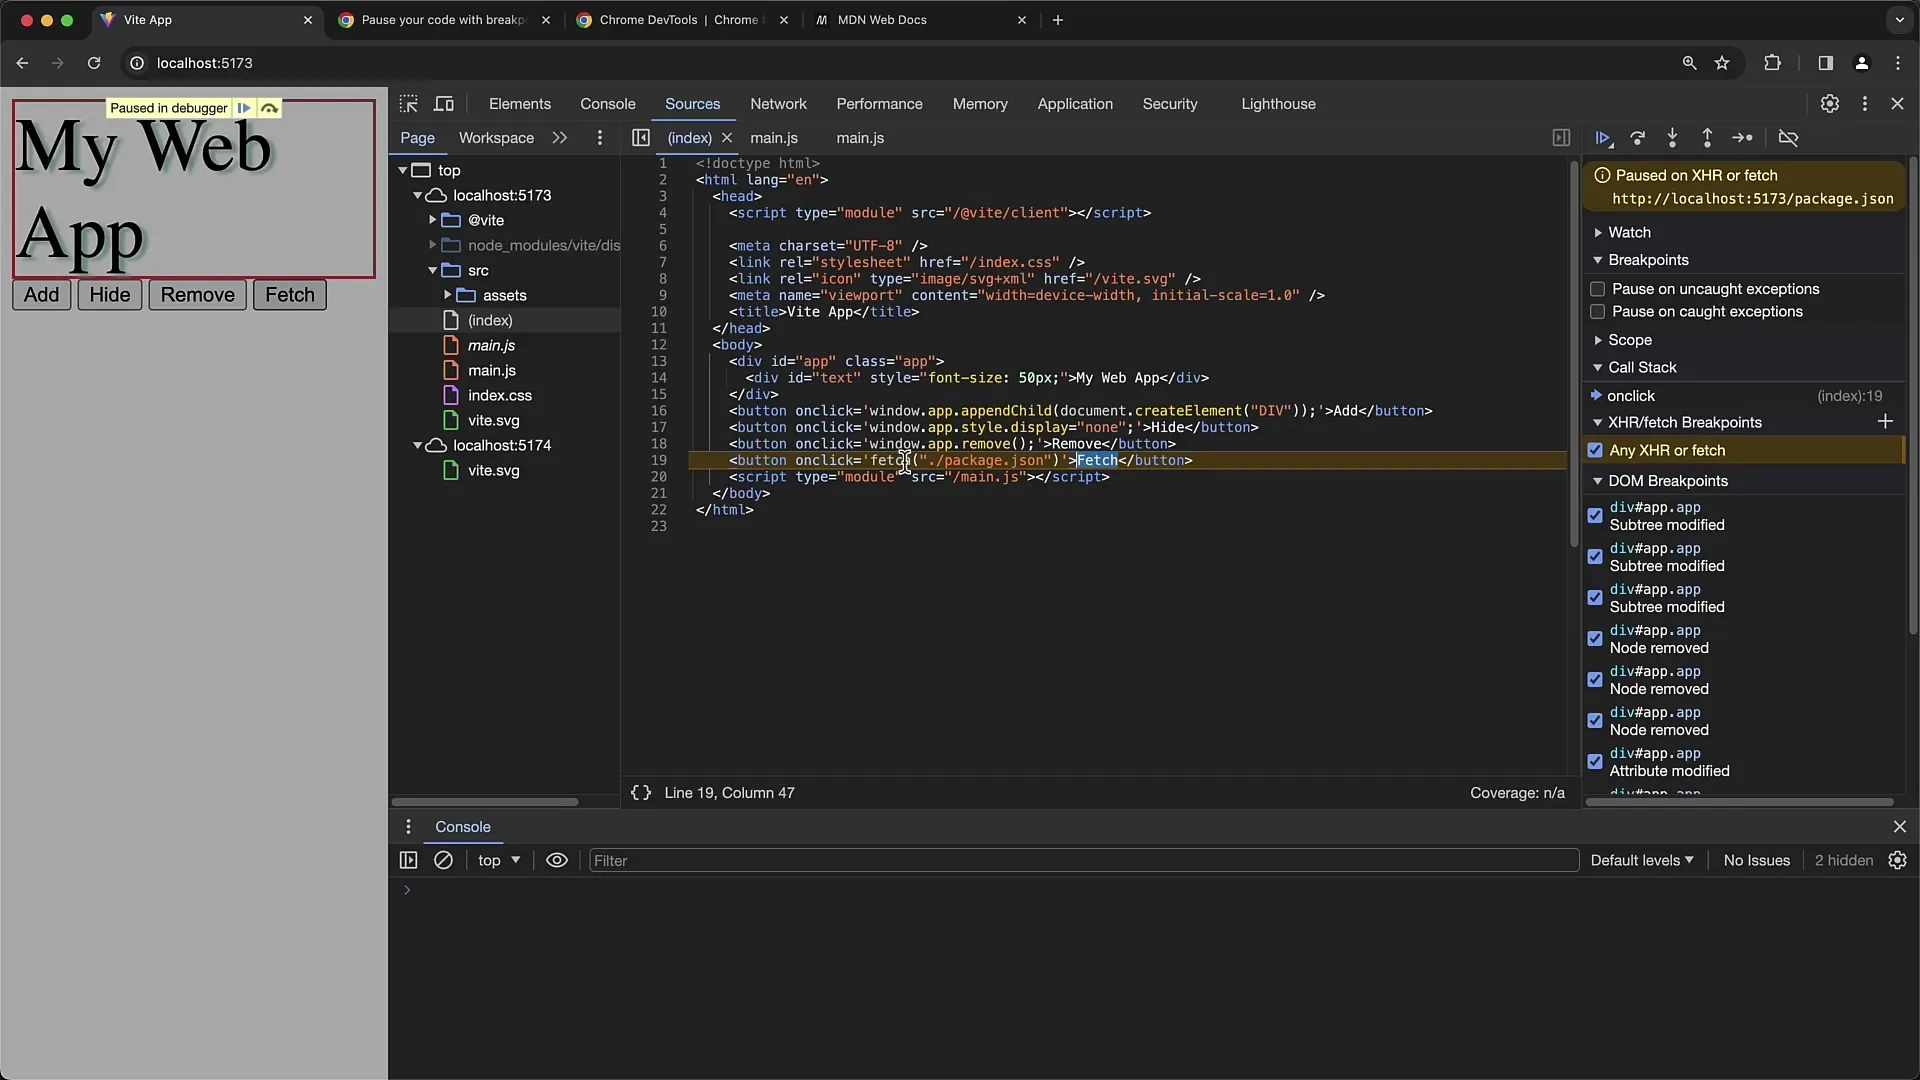
Within the "Sources" tab, there is a section for "XHR" or "Fetch-Breakpoints." To set a Fetch-Breakpoint, click on the corresponding button to add a new breakpoint. You will be prompted to enter a URL or part of a URL to make the breakpoint specific. However, if you do not enter anything, the breakpoint will be activated for all Fetch requests made.
4. Triggering the Breakpoint
To test if the Fetch-Breakpoint was set correctly, perform an action that triggers a Fetch request – for example, by clicking on a button that makes a data query. If the breakpoint worked correctly, the code will pause at that point and show you the current state of the code.

5. Checking the Network Request
When the code is paused, you have the opportunity to check the current state of variables and analyze the network request. Here, you can ensure that the expected data is being retrieved. For example, if you are monitoring a variable in your code that triggers the Fetch request, you can see if the correct endpoint is being addressed.

6. Configuring Specific Breakpoints
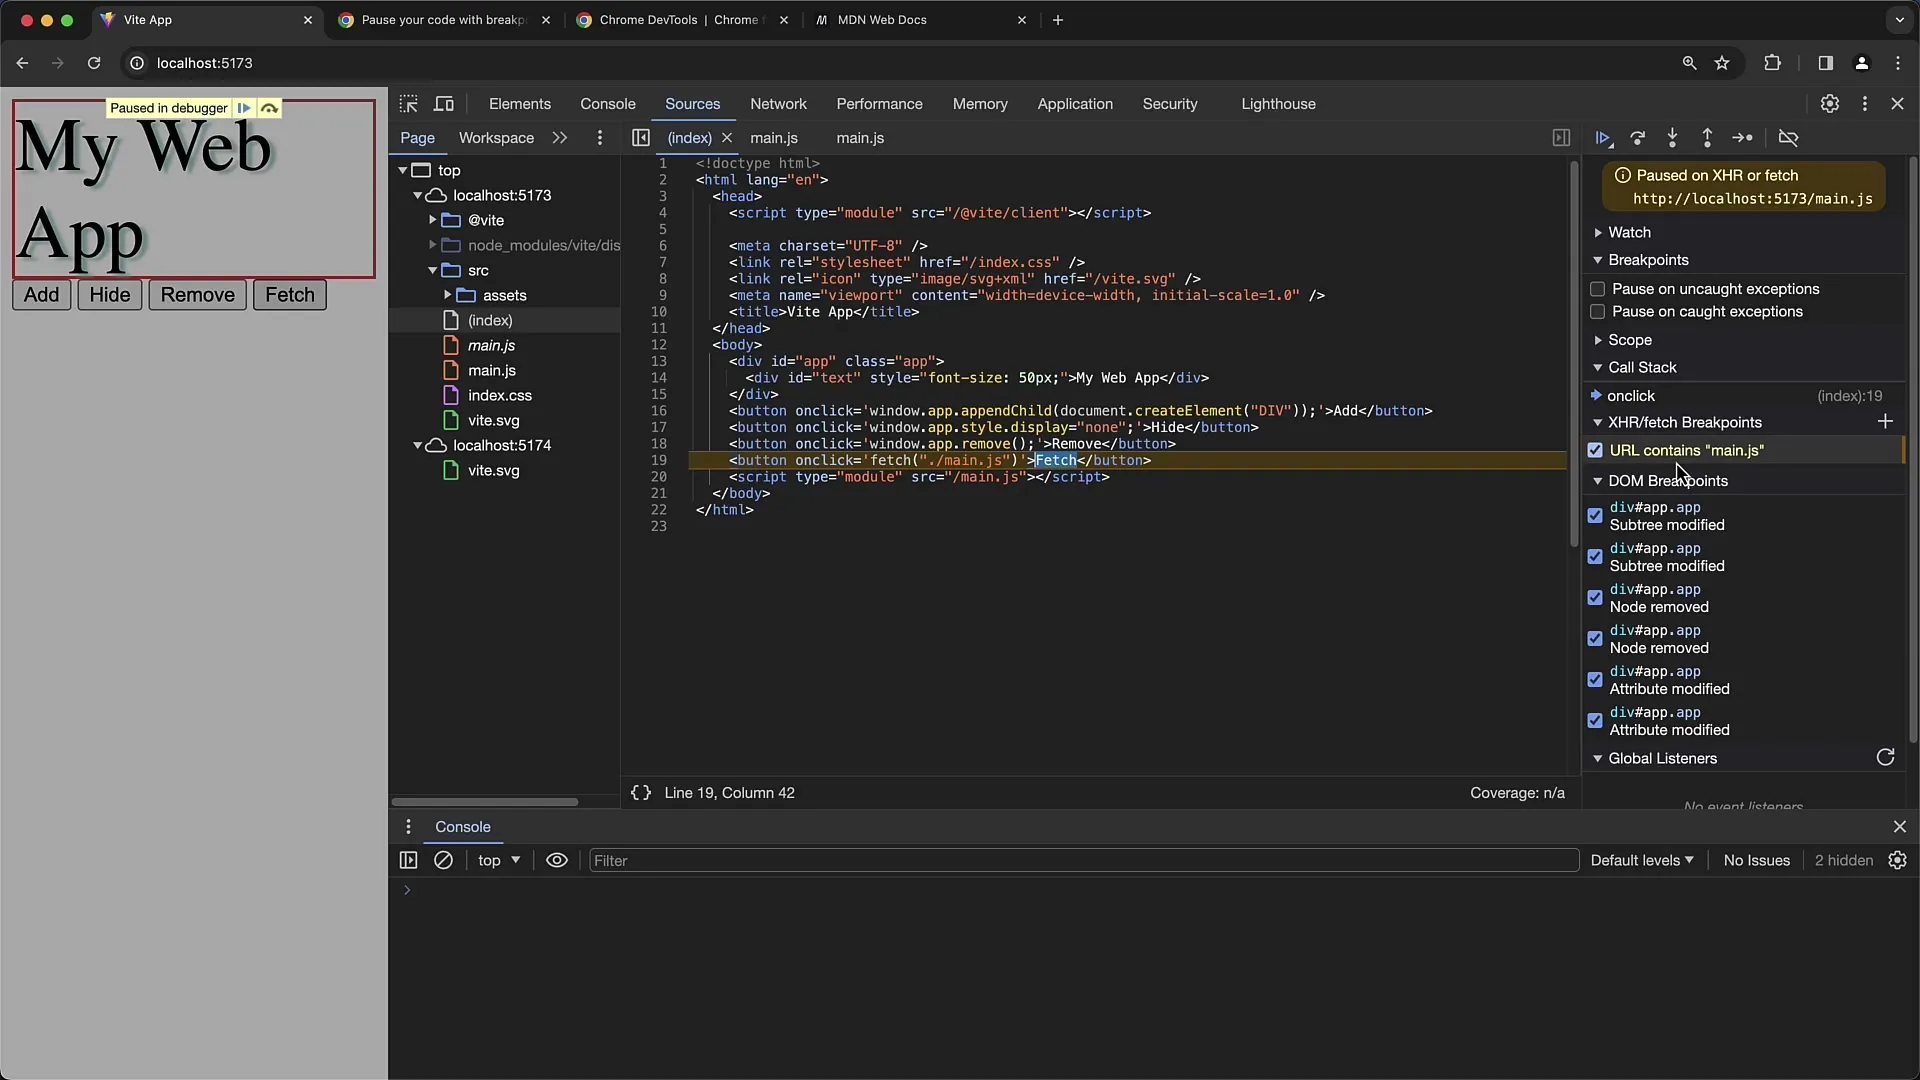
If you are only interested in specific Fetch requests, you can add a new breakpoint and specify a specific URL. For example, you could set the URL to "main.js." Then, when you execute the Fetch request for this URL, the breakpoint should be triggered. If you do not specify the URL, the breakpoint will apply to all network requests, which is useful for investigating general issues.
7. Checking the Initiator
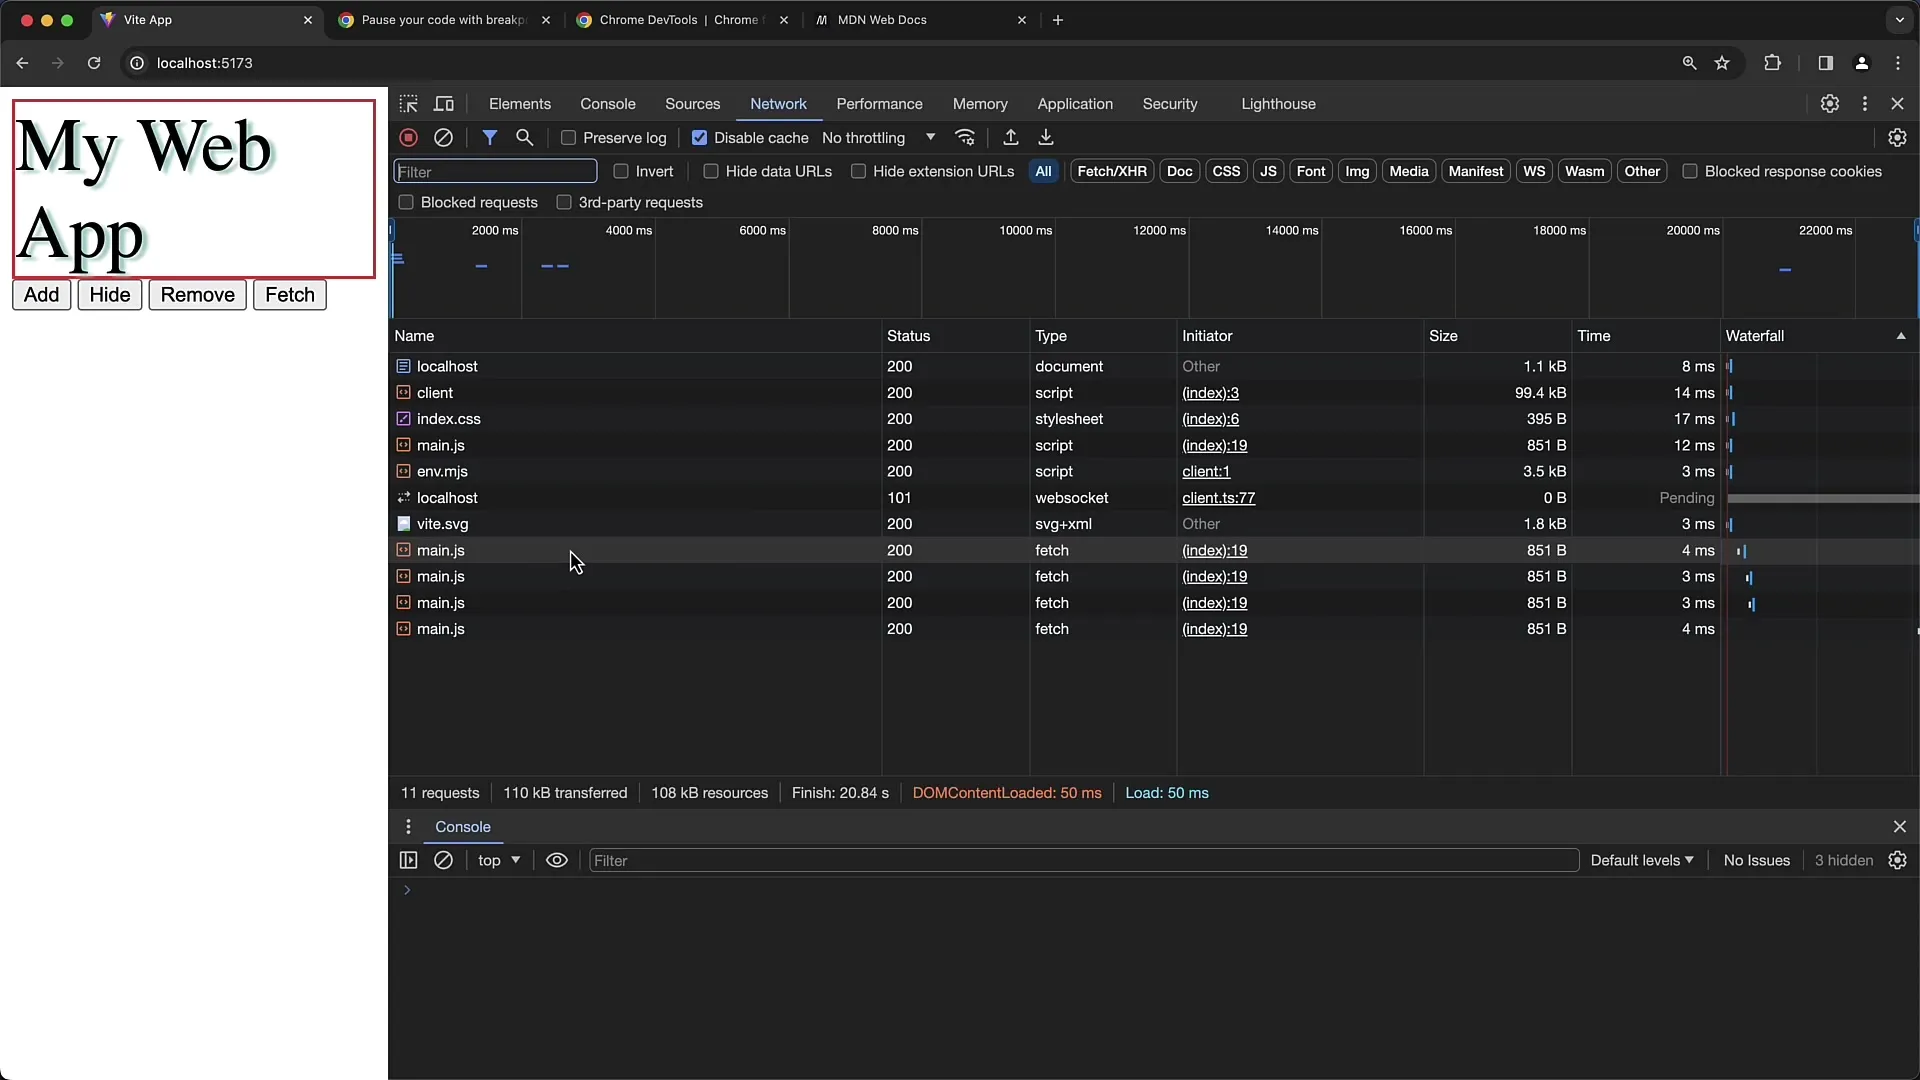
To learn more about the cause of a Fetch request, you can switch to the "Network" tab in the Developer Tools. There, you will see a list of all executed Fetch requests. The "Initiator" column will show you which part of your code triggered the request. Clicking on one of these entries will take you to the corresponding line in the "Sources" tab.

8. Final Checks
When making changes to your code, such as modifying the URL, ensure you reload the developer tools to apply the changes. You can easily do this by refreshing the page. Then, verify if the Fetch request works successfully again and if the breakpoint is triggered as expected.

Summary
In this tutorial, you have learned how to use Fetch Breakpoints in Chrome Developer Tools to pause the code during network requests. You have learned how to set specific breakpoints to stop only at certain points in your code, what information you can read from the Developer Tools, and how to trace who triggered the Fetch request.
Frequently Asked Questions
What are Fetch Breakpoints?Fetch Breakpoints allow you to pause the code at a specific point when a Fetch request is sent to the server.
How do I set a Fetch Breakpoint?You can set a Fetch Breakpoint in the "Sources" tab of Chrome Developer Tools by entering a URL or a general setting for all Fetch requests.
How can I check if my Fetch Breakpoint is working?You can test this by performing an action that triggers a Fetch request. The debugger should pause if the breakpoint is active.
What should I do if no Breakpoints are triggered?Make sure the URL is entered correctly and the code that executes the Fetch request is actually reached. Reloading a page can also help.
How can I see the initiator of a Fetch request?You can view the initiator in the "Network" tab of the Developer Tools. It will show you which part of your code triggered the request.


