In this guide, I will show you how to use the Chrome Developer Tools to efficiently and comprehensively control the debugging process. You will learn how to navigate through source code step by step and precisely support specific points in the program flow. The focus is on introducing helpful shortcuts and functions that facilitate debugging and improve your workflow.
Key Takeaways
- You can quickly and effectively navigate through large codebases by using the file search.
- The step-by-step debugging is supported by various shortcuts and functions that make it easy to step through code.
- For asynchronous functions, there are special mechanisms to clarify which parts of the code are being executed.
Step-by-Step Guide
To begin debugging in Chrome Developer Tools, follow these steps:
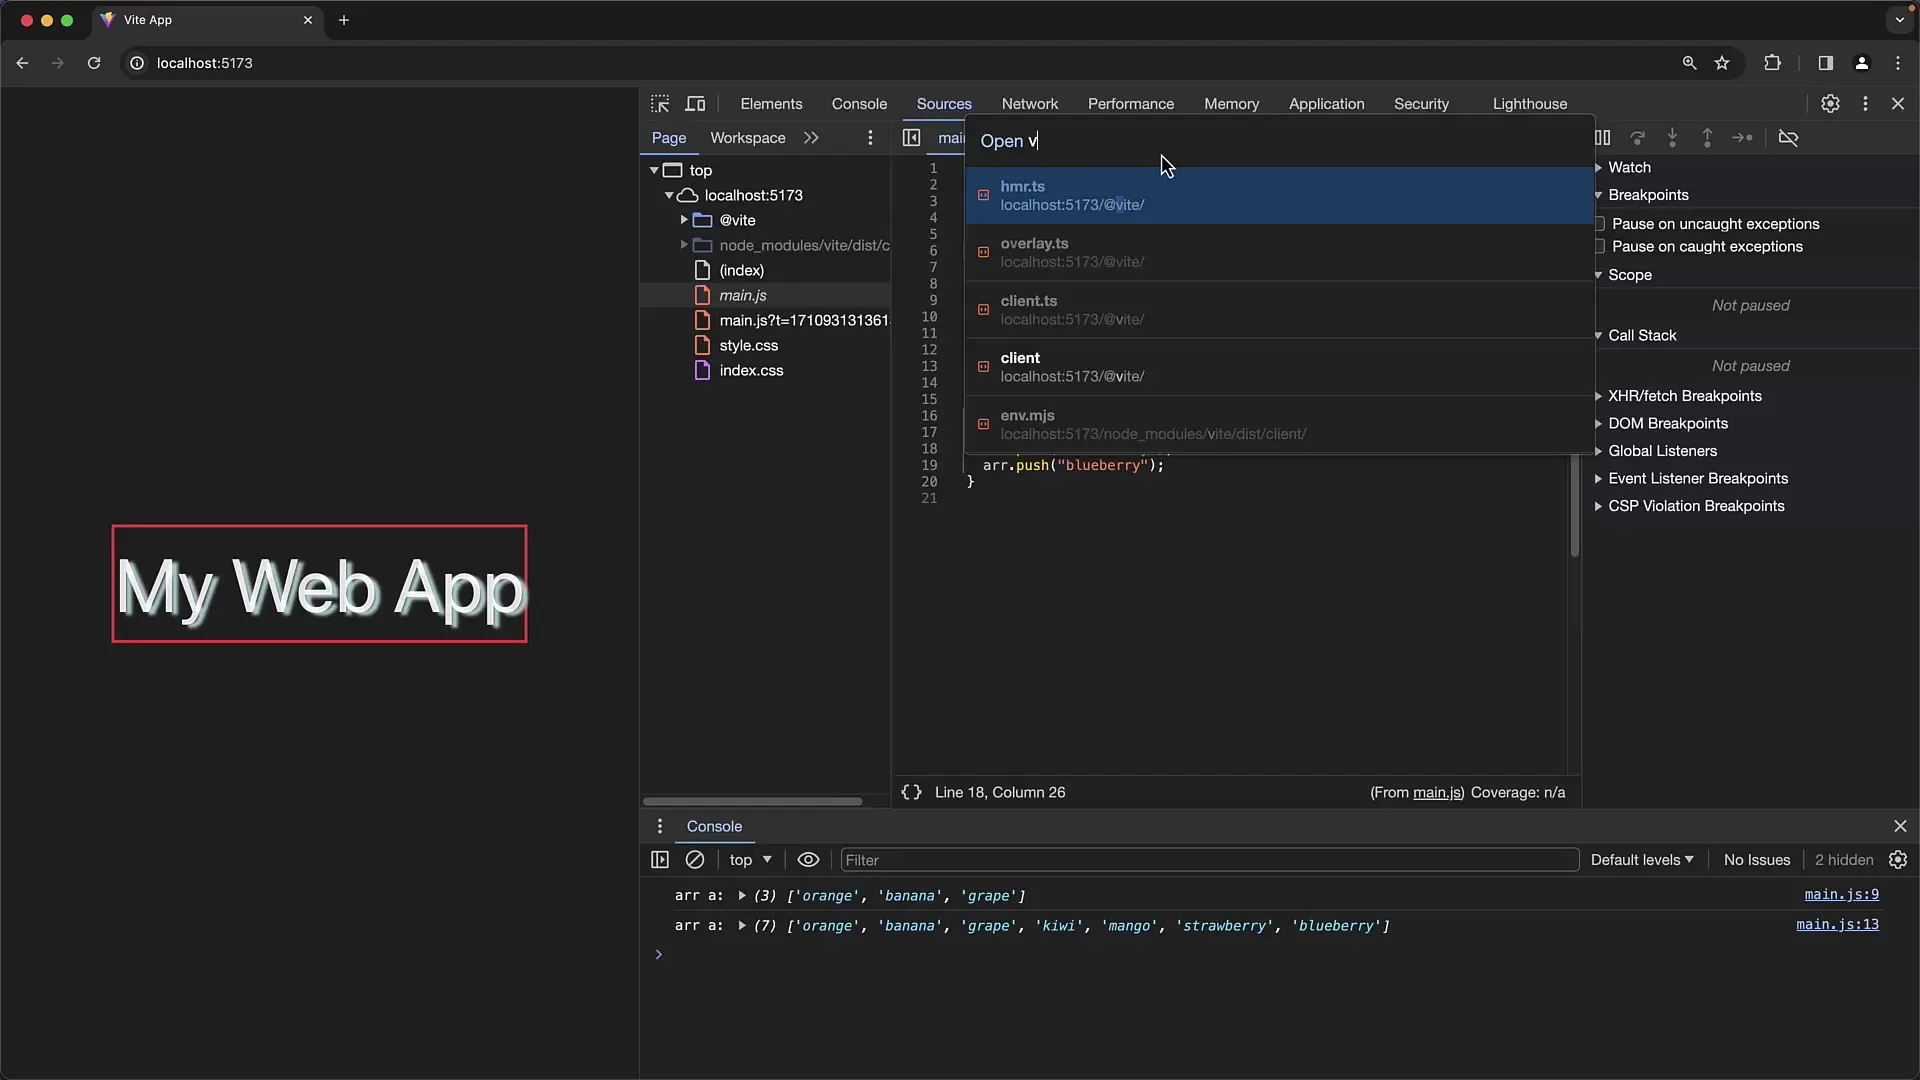
To find the right files, you can use the shortcut "Command P" on a Mac or "Ctrl P" on Windows. This opens a search bar where you can enter the name of the file you are looking for. You will immediately see how the results are filtered and can find the desired document much faster.
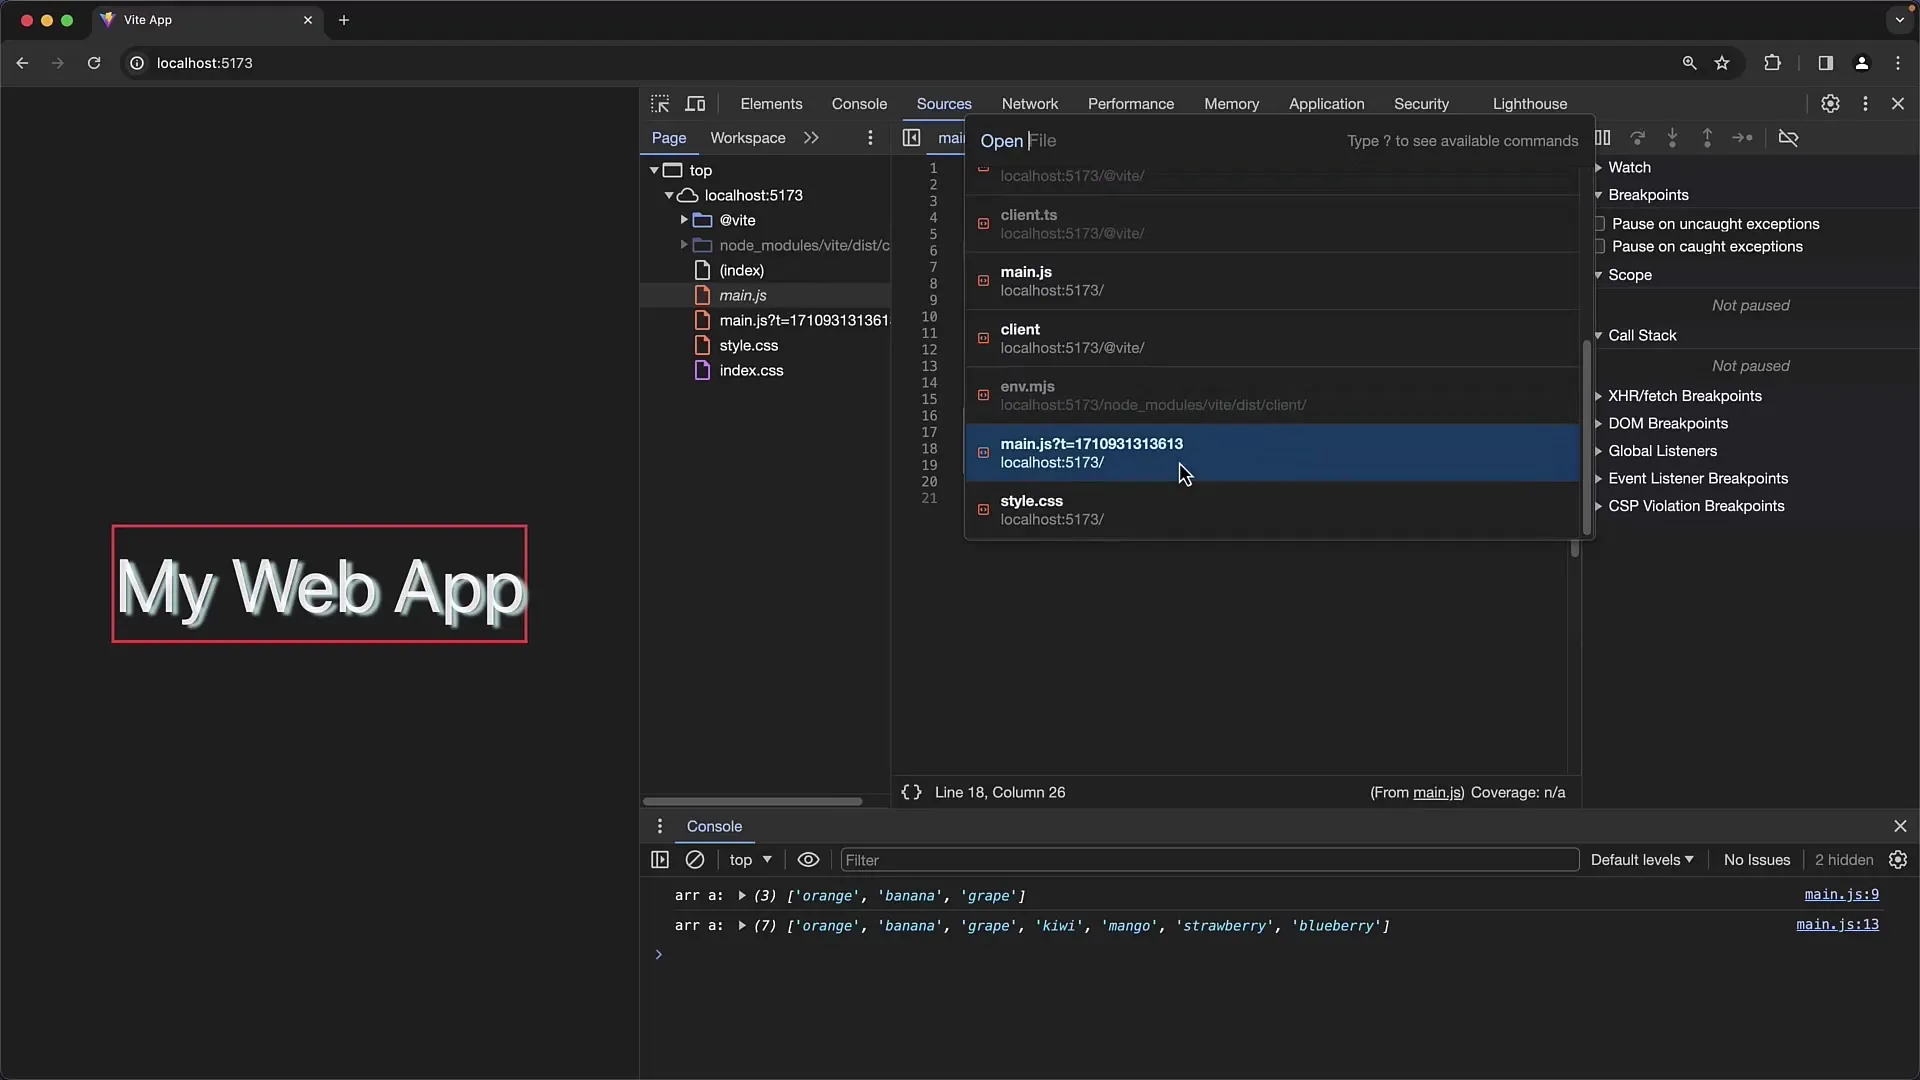
If you are looking for a specific file and do not know the exact name, you can also enter parts of the name or search terms that contain parts of the filename. This allows for effective filtering, especially in large projects with many files.
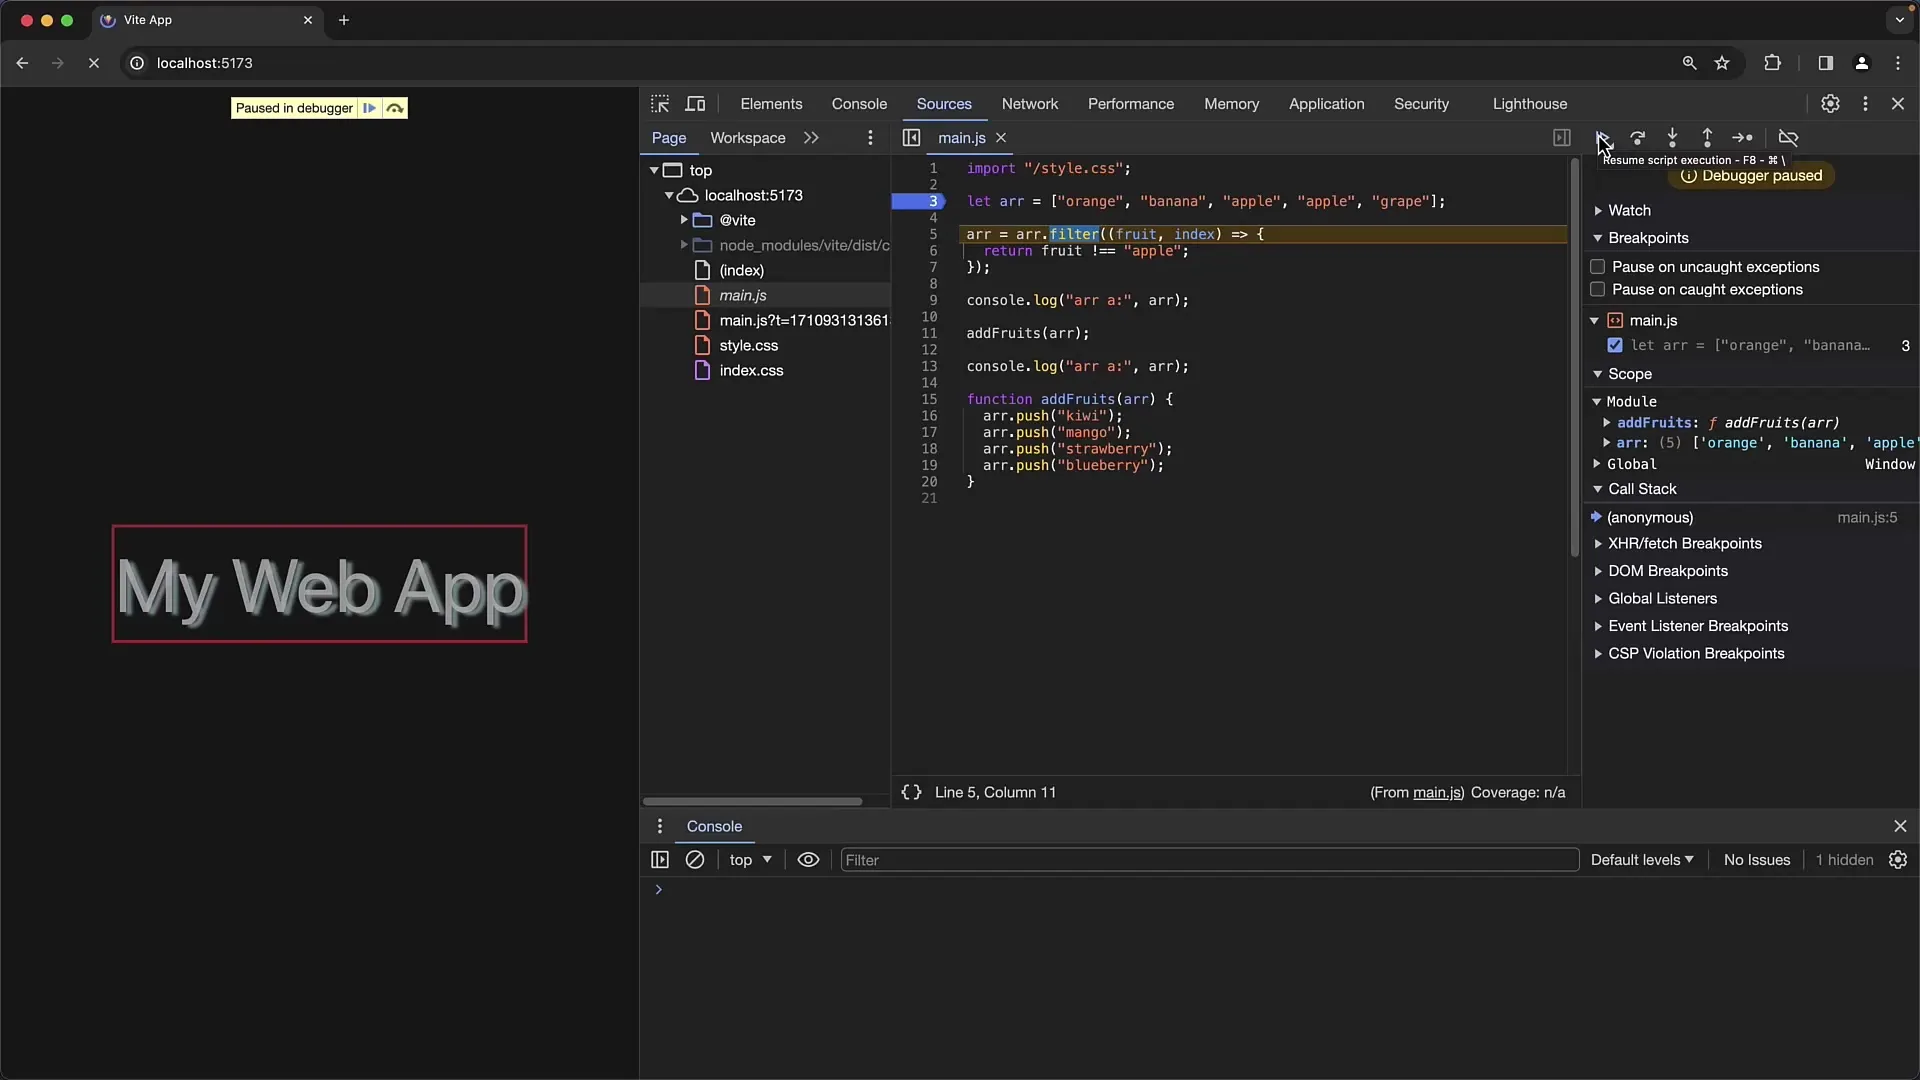
In addition, Chrome Developer Tools offer keyboard shortcuts that make navigating through the code easier. These shortcuts are very helpful for stepping through the source code. Use the keys F8 (to continue in the current function) and F10 (for the next function call). This allows you to make your debugging session much faster and more efficient.
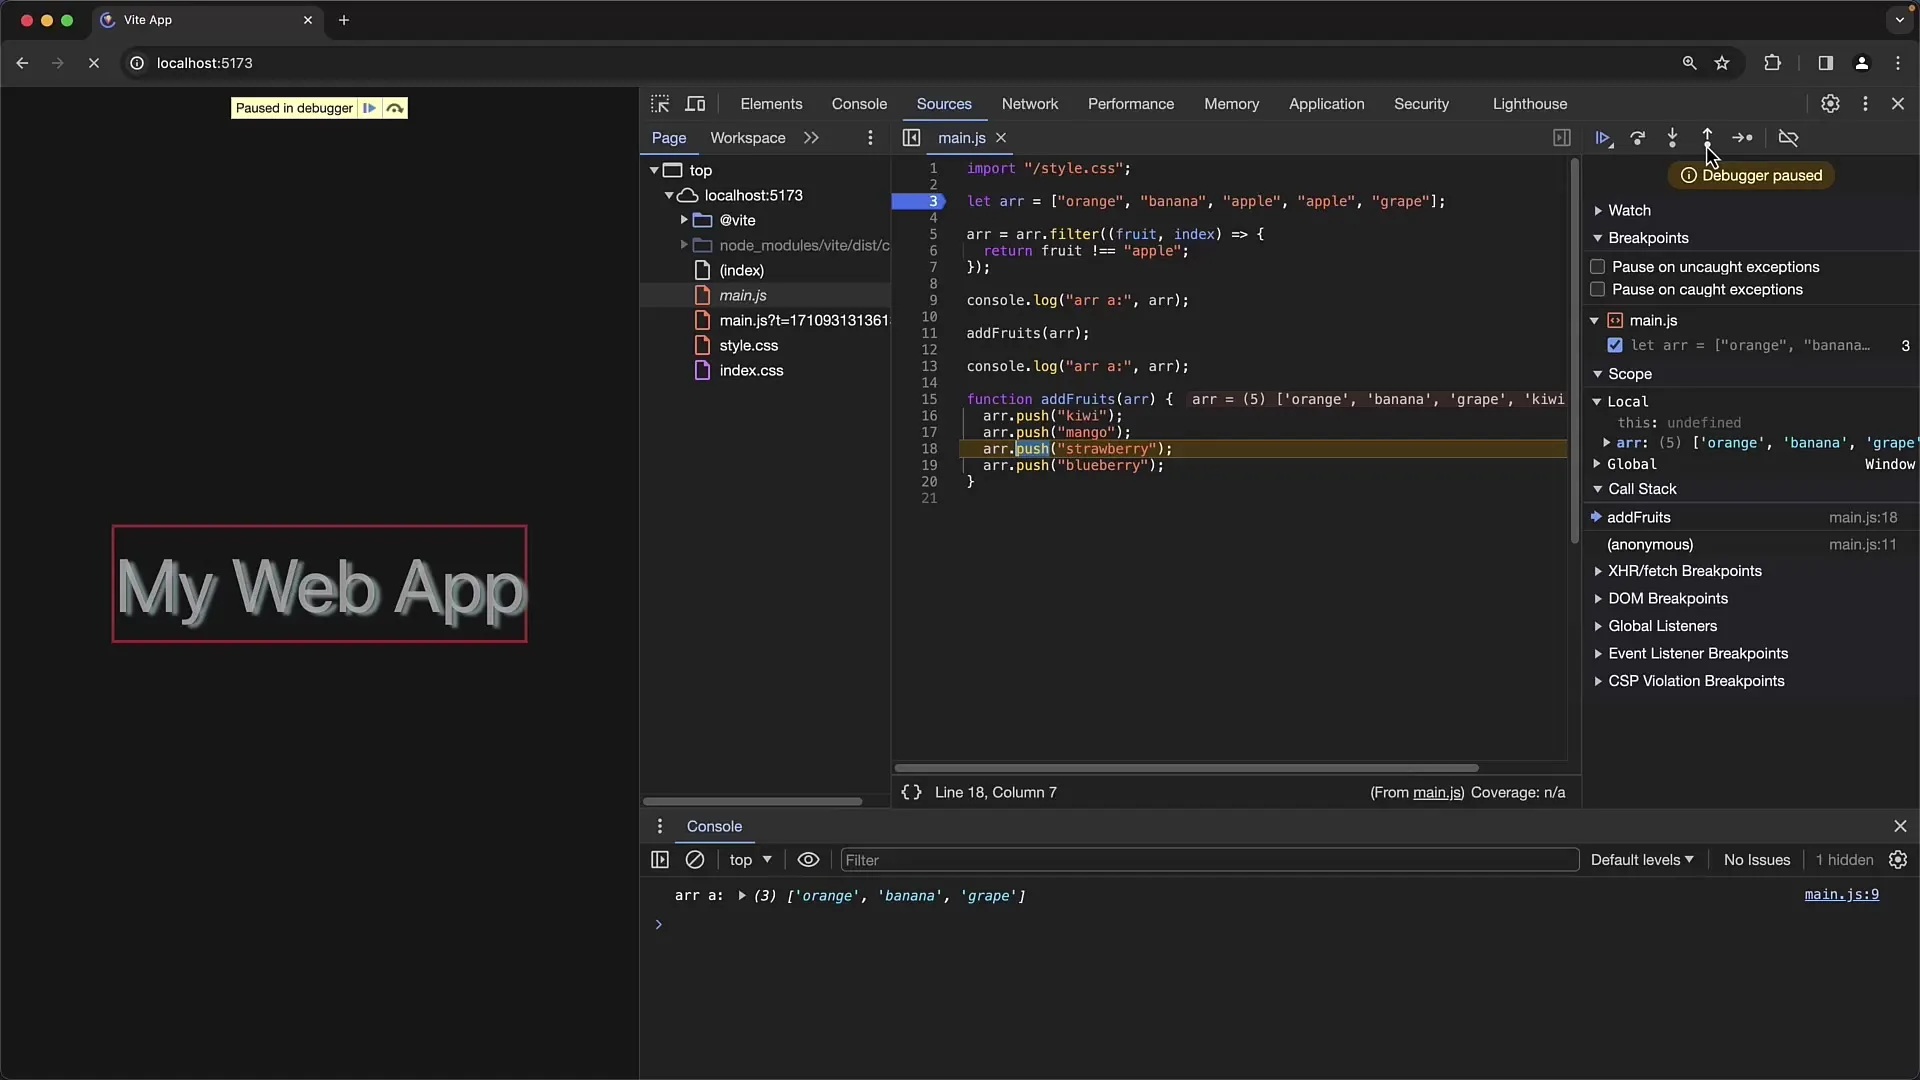
If you want to jump into a function, press F11. This will take you directly to the selected function. You can also step out of a function by using "Shift F11," which takes you up one level. These movements are central to understanding the program flow and the impact of specific code.
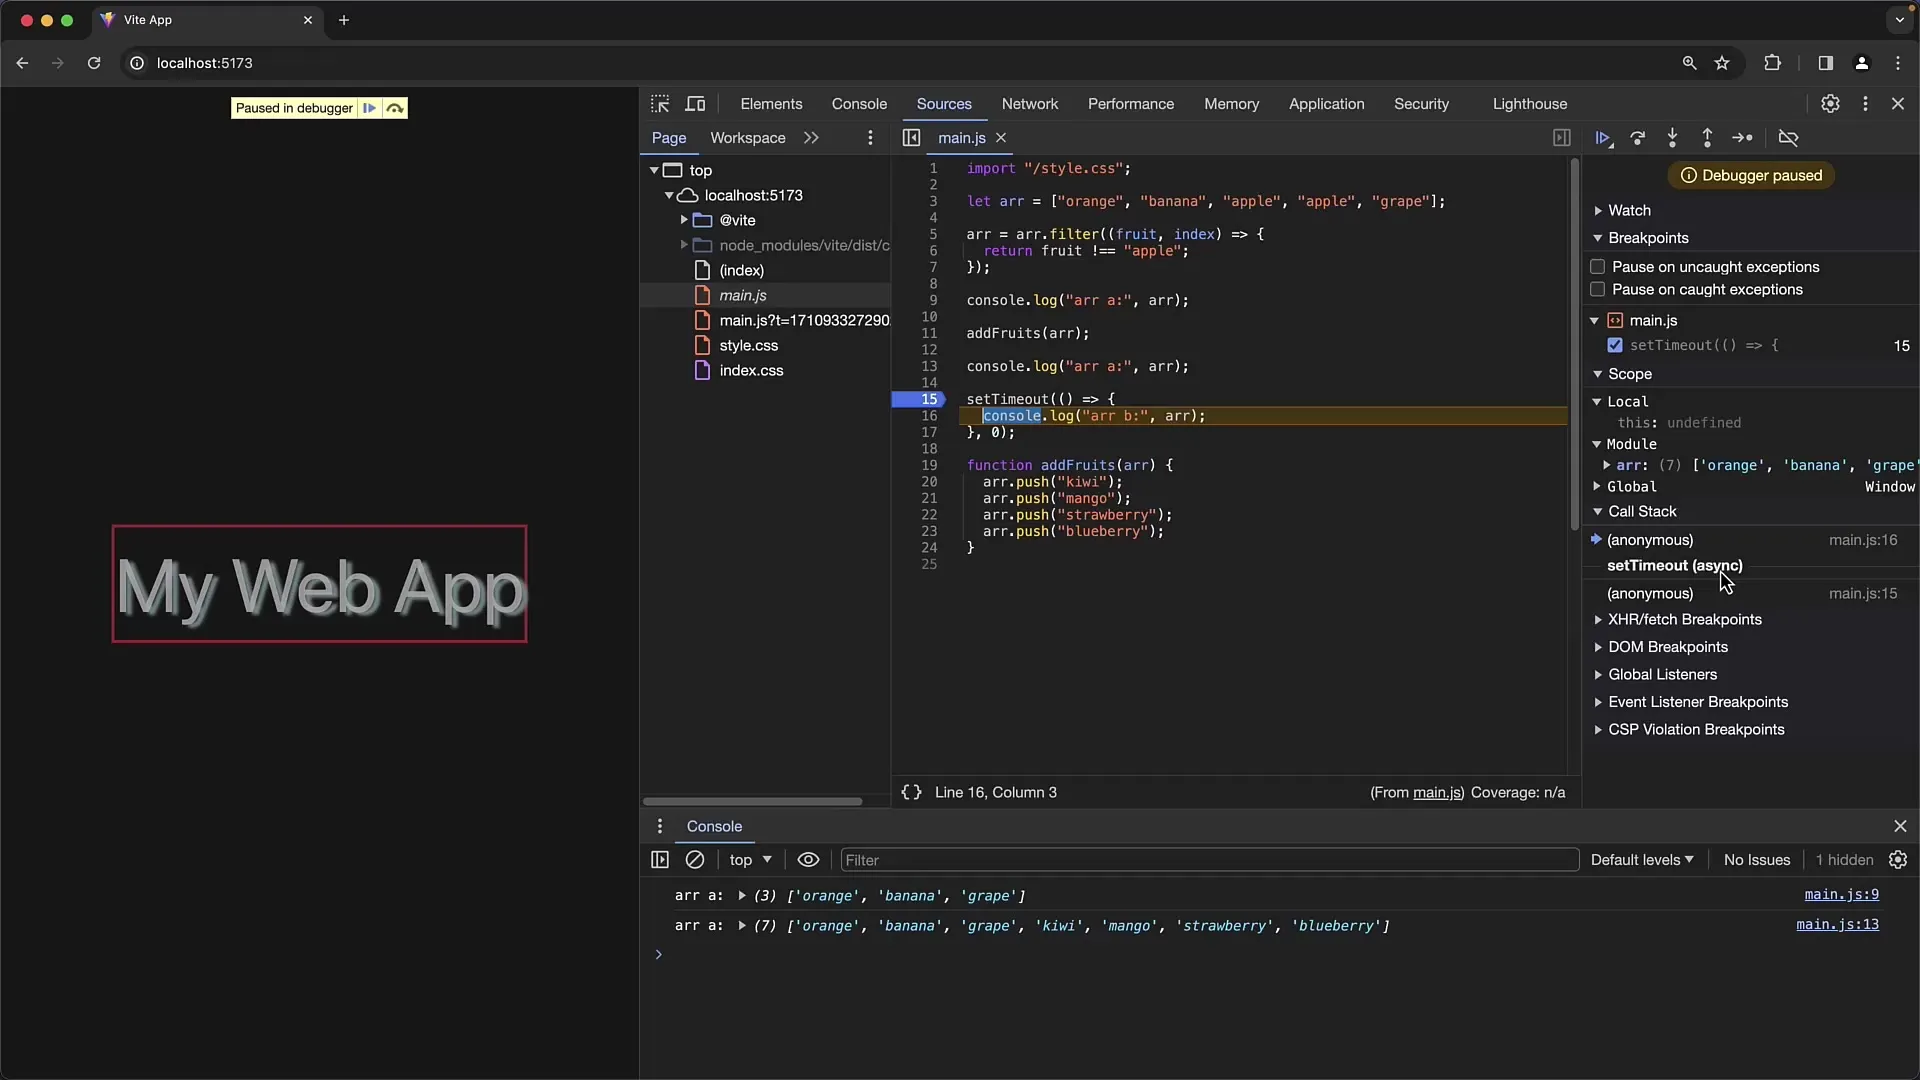
When dealing with asynchronous code, there are special considerations to make. With asynchronous calls, you can distinguish between the "Step into" (F11) key to dive into the function and "Step over" (F9) to skip the execution.
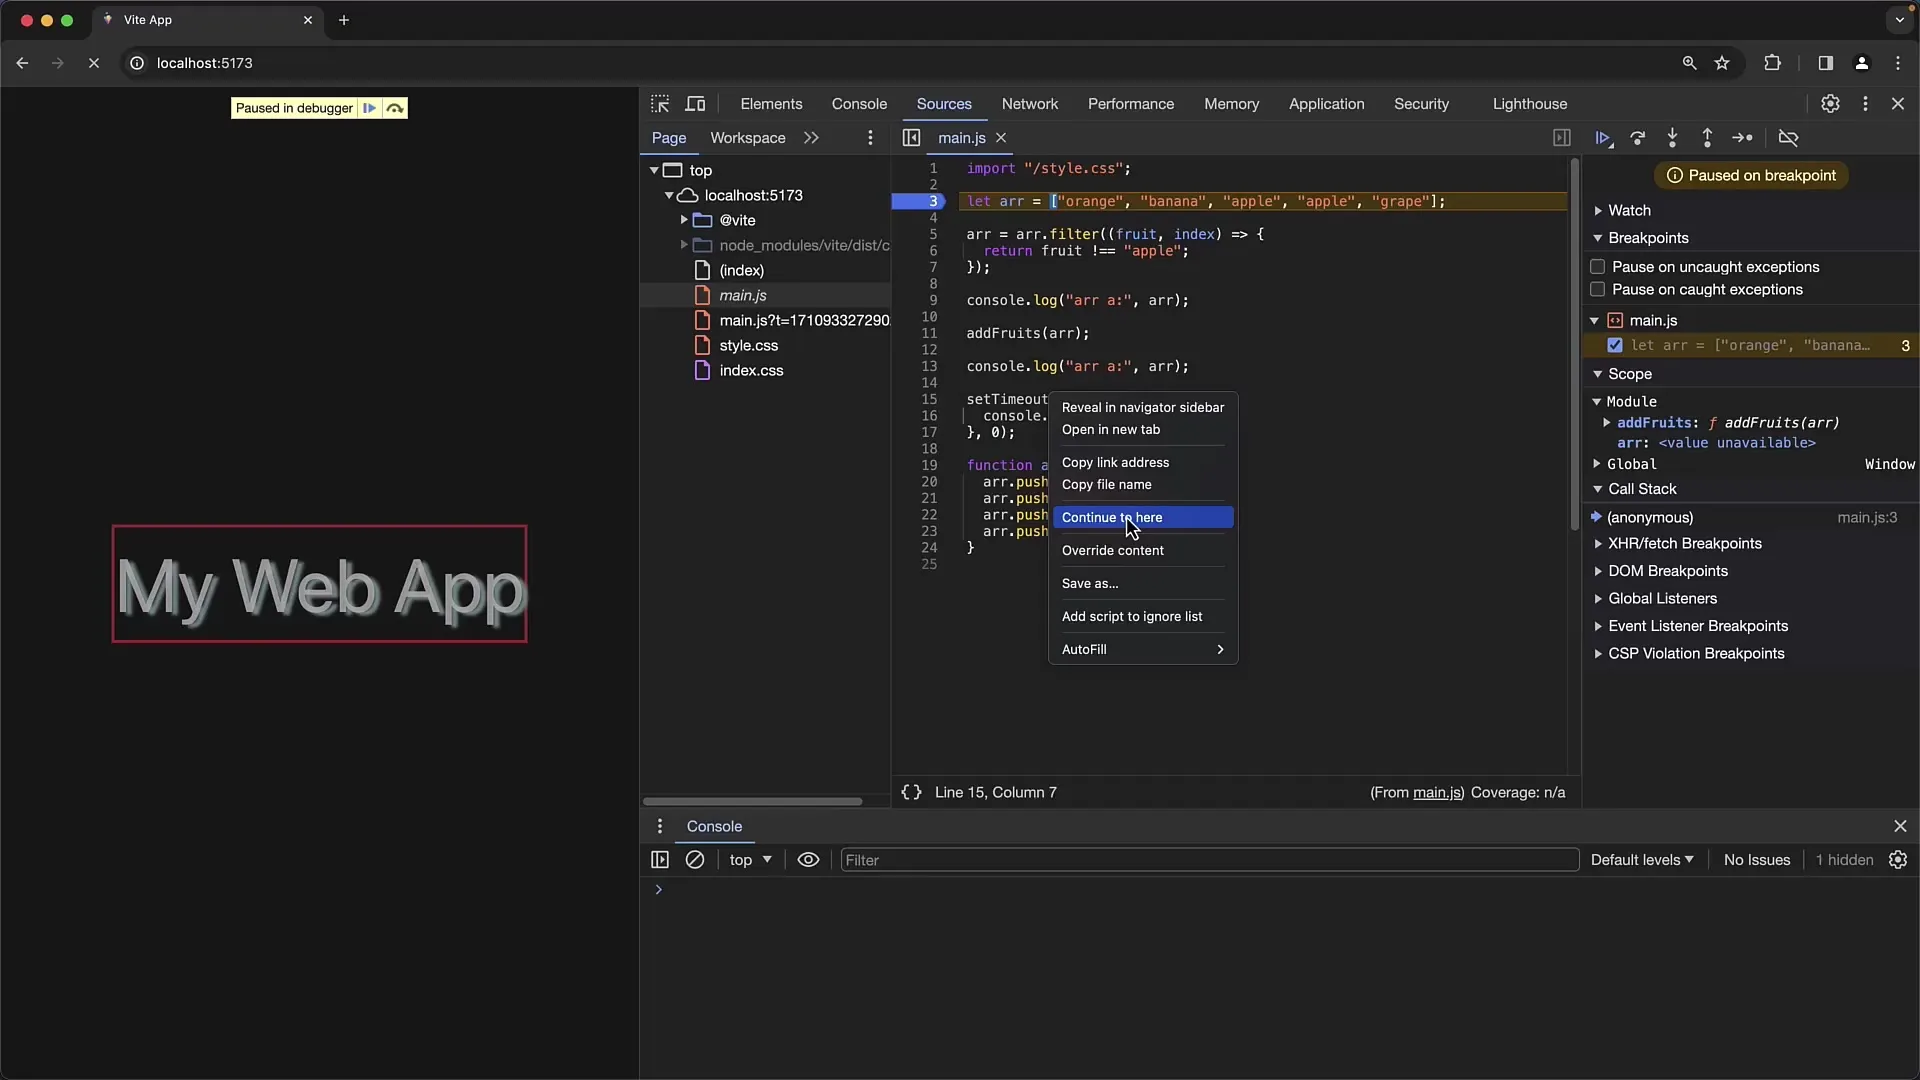
To make the debugging process even more efficient, you can also set temporary breakpoints. Right-click on a line of code and select "Continue to here." The program will run up to that point without continuous stops on other lines.
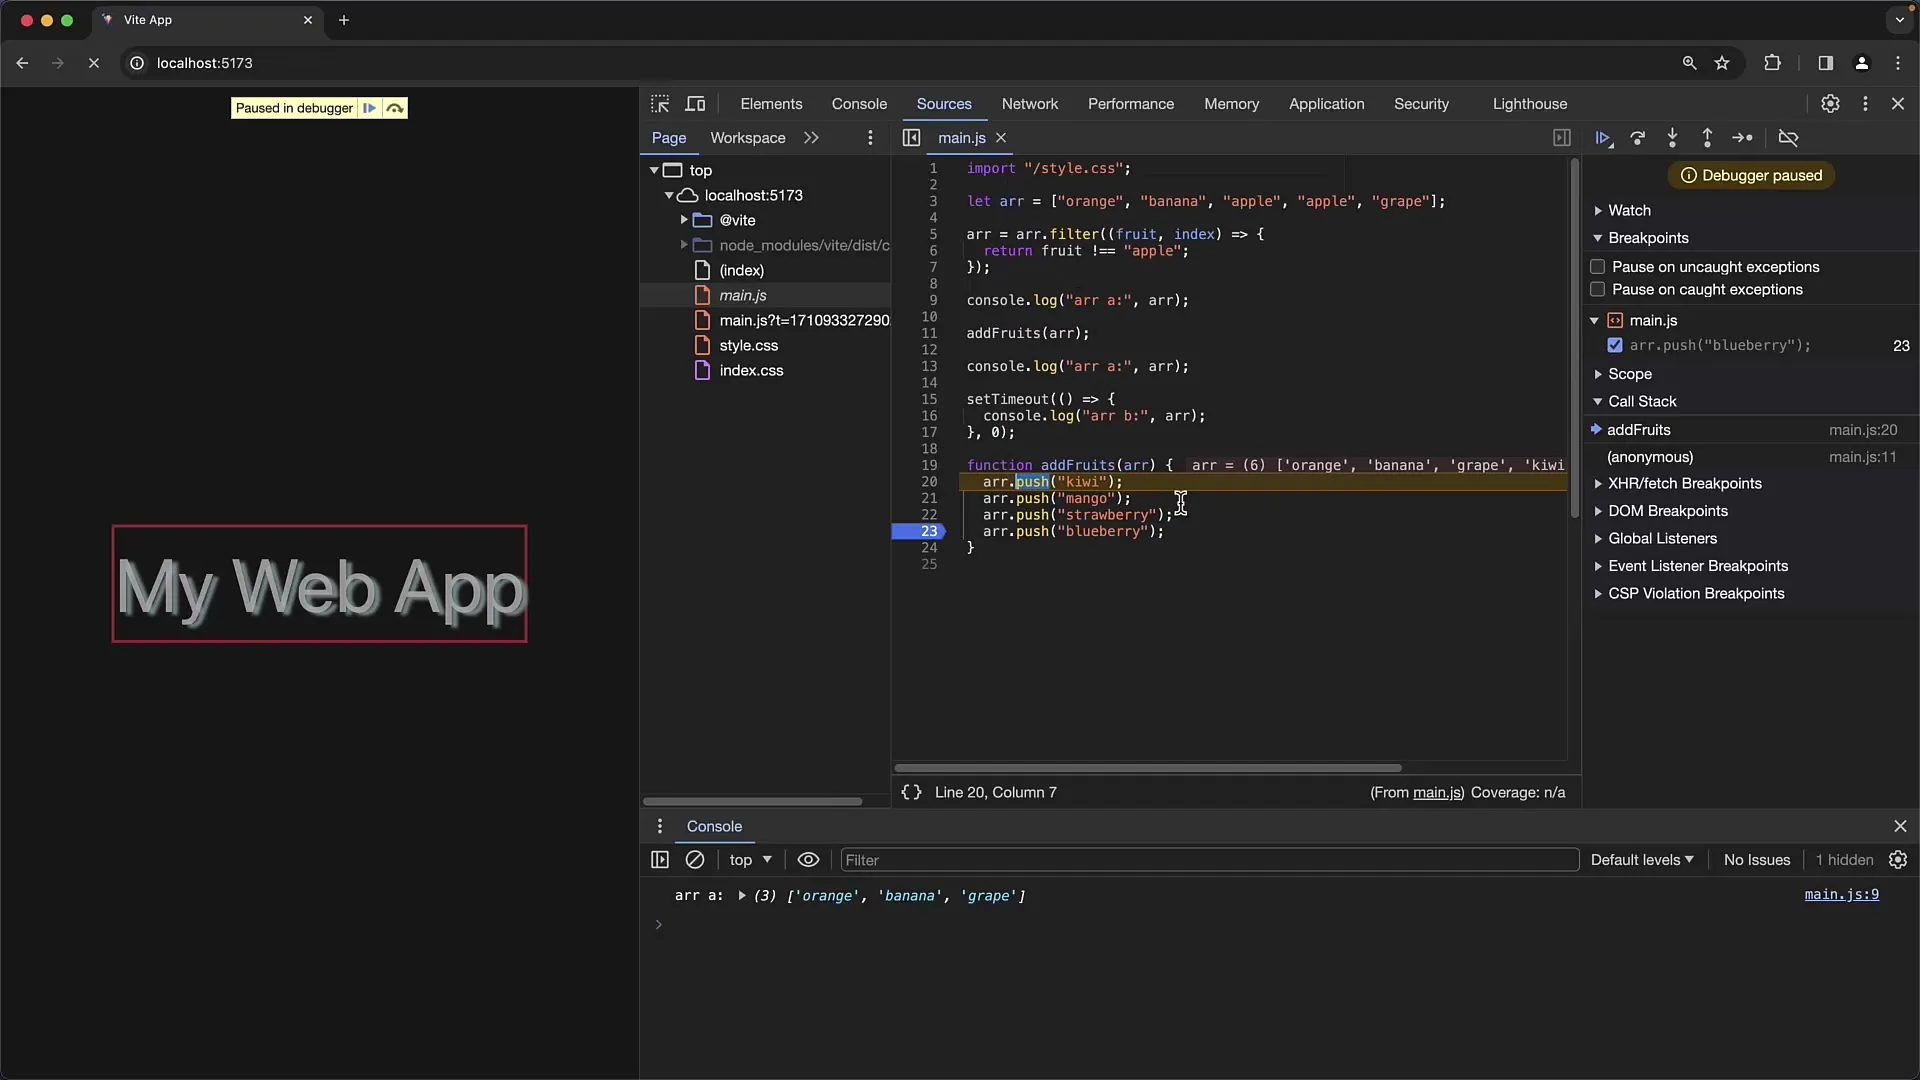
Another useful tool within the Developer Tools is the ability to reset the execution of a function. By pressing the "Restart Frame" button, you jump back to the beginning of the function without resetting the variables. This function is particularly useful when you want to repeatedly test the behavior of a function under certain conditions.
All these tricks and shortcuts ultimately make debugging a much faster process. Whenever you feel like your debugging is not progressing, check out the possibilities offered by the Developer Tools. As you go through the steps, make sure to familiarize yourself with the shortcuts to further enhance your efficiency.
Summary
In this guide, you have learned how to use the Chrome Developer Tools optimally to navigate through the source code and master complex debugging situations. The use of shortcuts and specific functions allows you to have deeper control over the debugging process, whether you are working with synchronous or asynchronous code.
Frequently Asked Questions
How can I quickly find a file in Chrome Developer Tools?Use the keyboard shortcut "Ctrl P" on Windows or "Command P" on Mac and enter part of the filename.
What is the difference between F11 and F9 in debugging?F11 steps into a function, while F9 skips it and goes directly to the next code block.
How do I set temporary breakpoints?Right-click in the code and choose "Continue to here" to run the program up to that point.
What happens with "Restart Frame"?The execution jumps to the beginning of the function without resetting the current variables.
Can I debug without using breakpoints?Yes, it is possible by using the continue functions or controlling program transitions with the described shortcuts.
