In this tutorial, you will learn about the different ways in which you can customize and improve log outputs in the Chrome Developer Tools. In particular, we focus on grouping and styling outputs to increase clarity and highlight important information. The development of web-based software often requires precise debugging tools, and understanding these methods can significantly enhance your efficiency as a developer.
Main Insights
- Using functions to clean up and group console outputs.
- Ways to apply CSS styling within log outputs.
- Working with different log levels and their visually emphasized representations.
Step-by-Step Guide
Cleaning up the Console
First, it is useful to clean the console of previous outputs to start with a clean display. This can be done in two ways: by calling the .clear() method or by using the clear function from window.
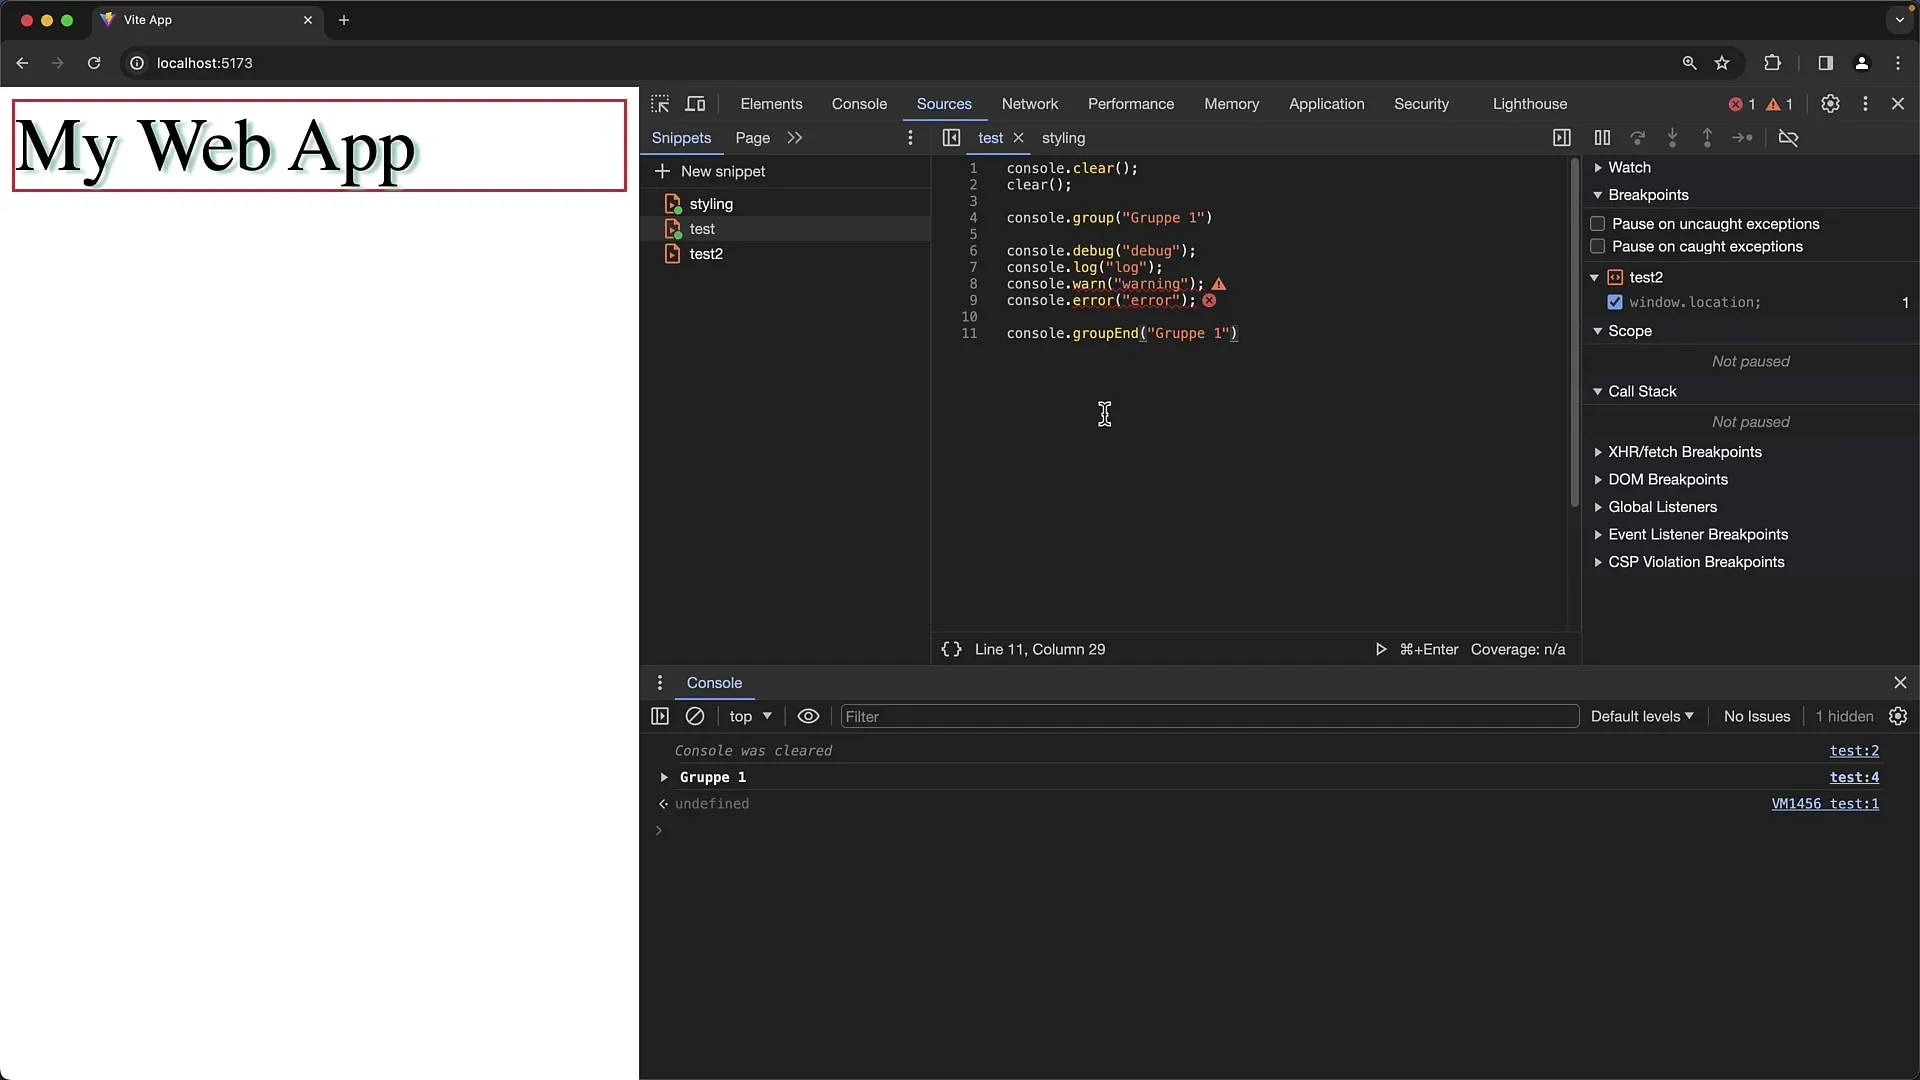
This method removes all content from the console, allowing you to begin your tests from an empty state. You can also use the "Clear Console" button directly in the console, which has the same effect but without the notification "Console was cleared".
Grouping in the Console
The next useful function is creating groups with the console.group() method. With this function, you can display outputs in a grouped form that allows you to expand and collapse them as needed.
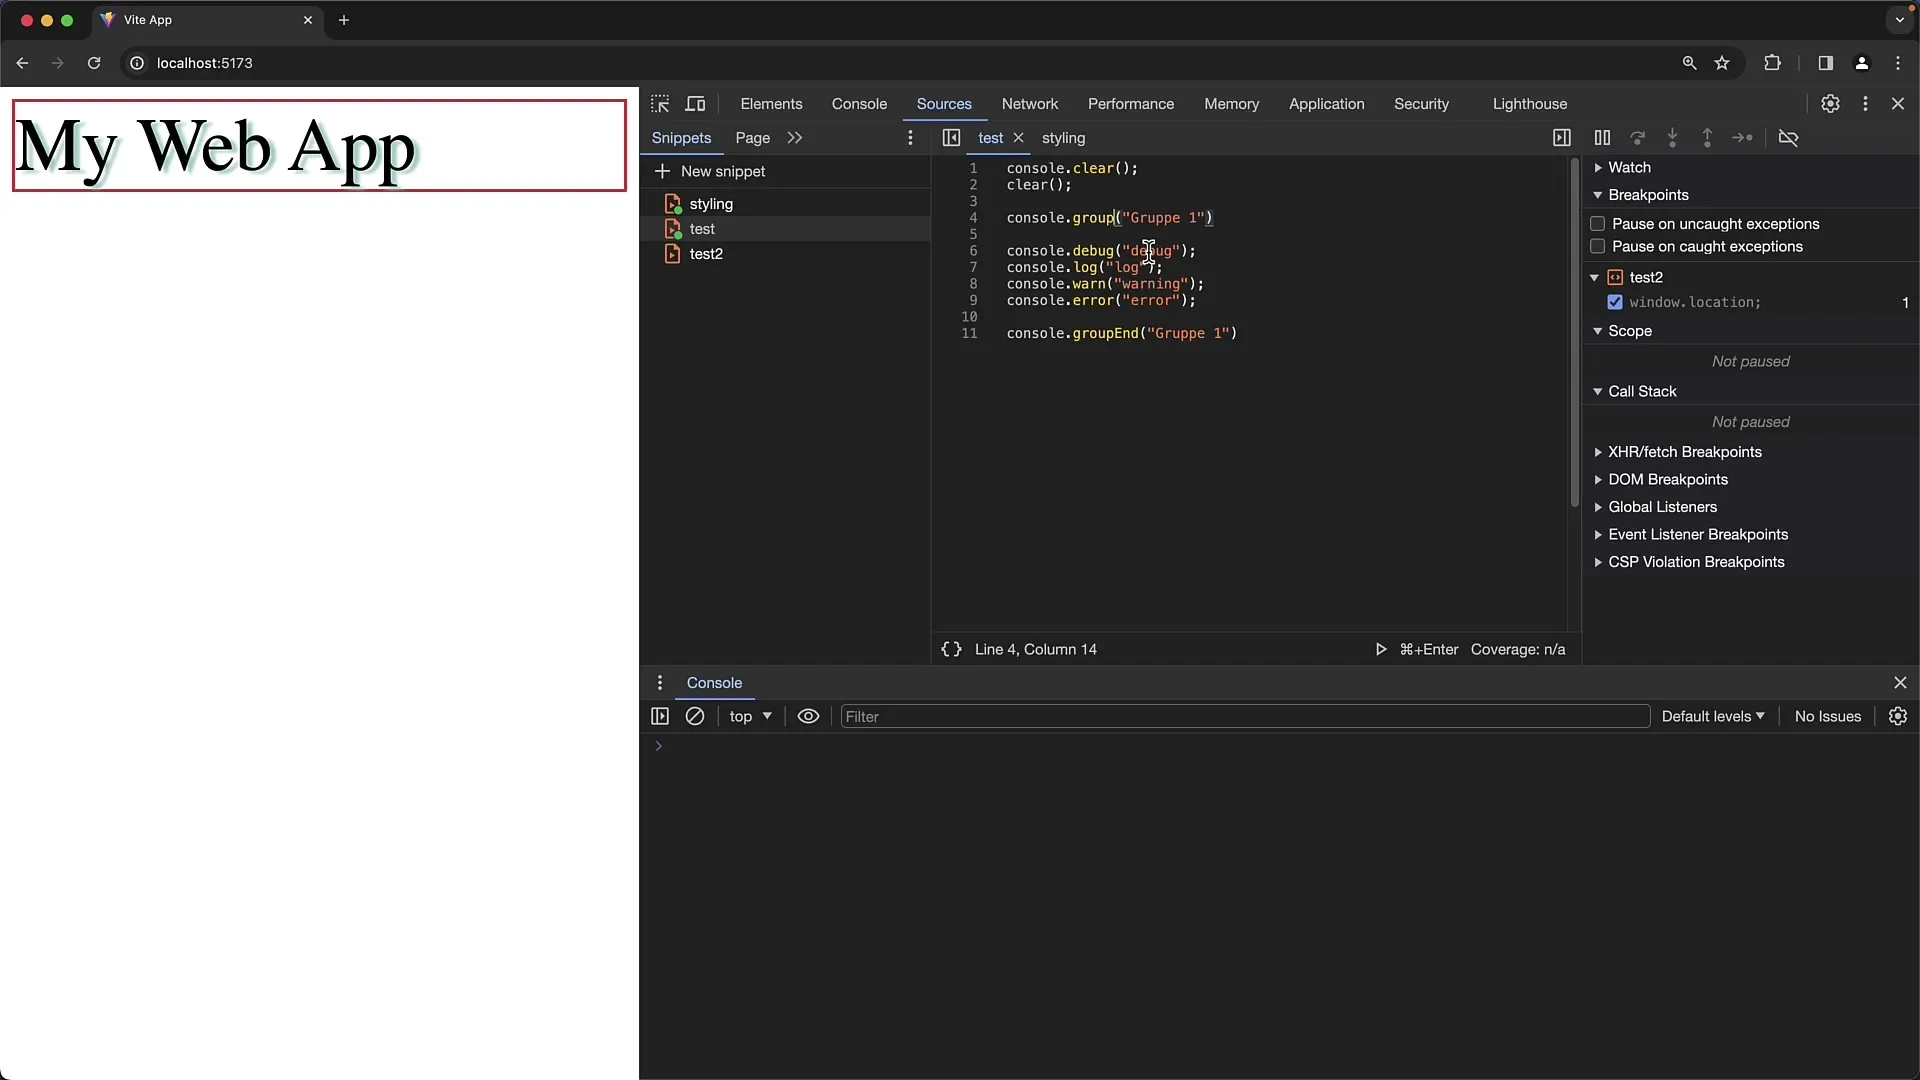
If you want the content of a group to be collapsed by default, you can use console.groupCollapsed(). Then, close the group with console.groupEnd(), which enhances clarity.
By nesting groups, you can create more complex structures. This means you can create groups within groups to create an even more precise hierarchy.
Log Outputs and Their Levels
Another important aspect is managing log levels. Chrome provides various methods for outputting log messages: console.log(), console.warn(), console.error(), and console.debug().
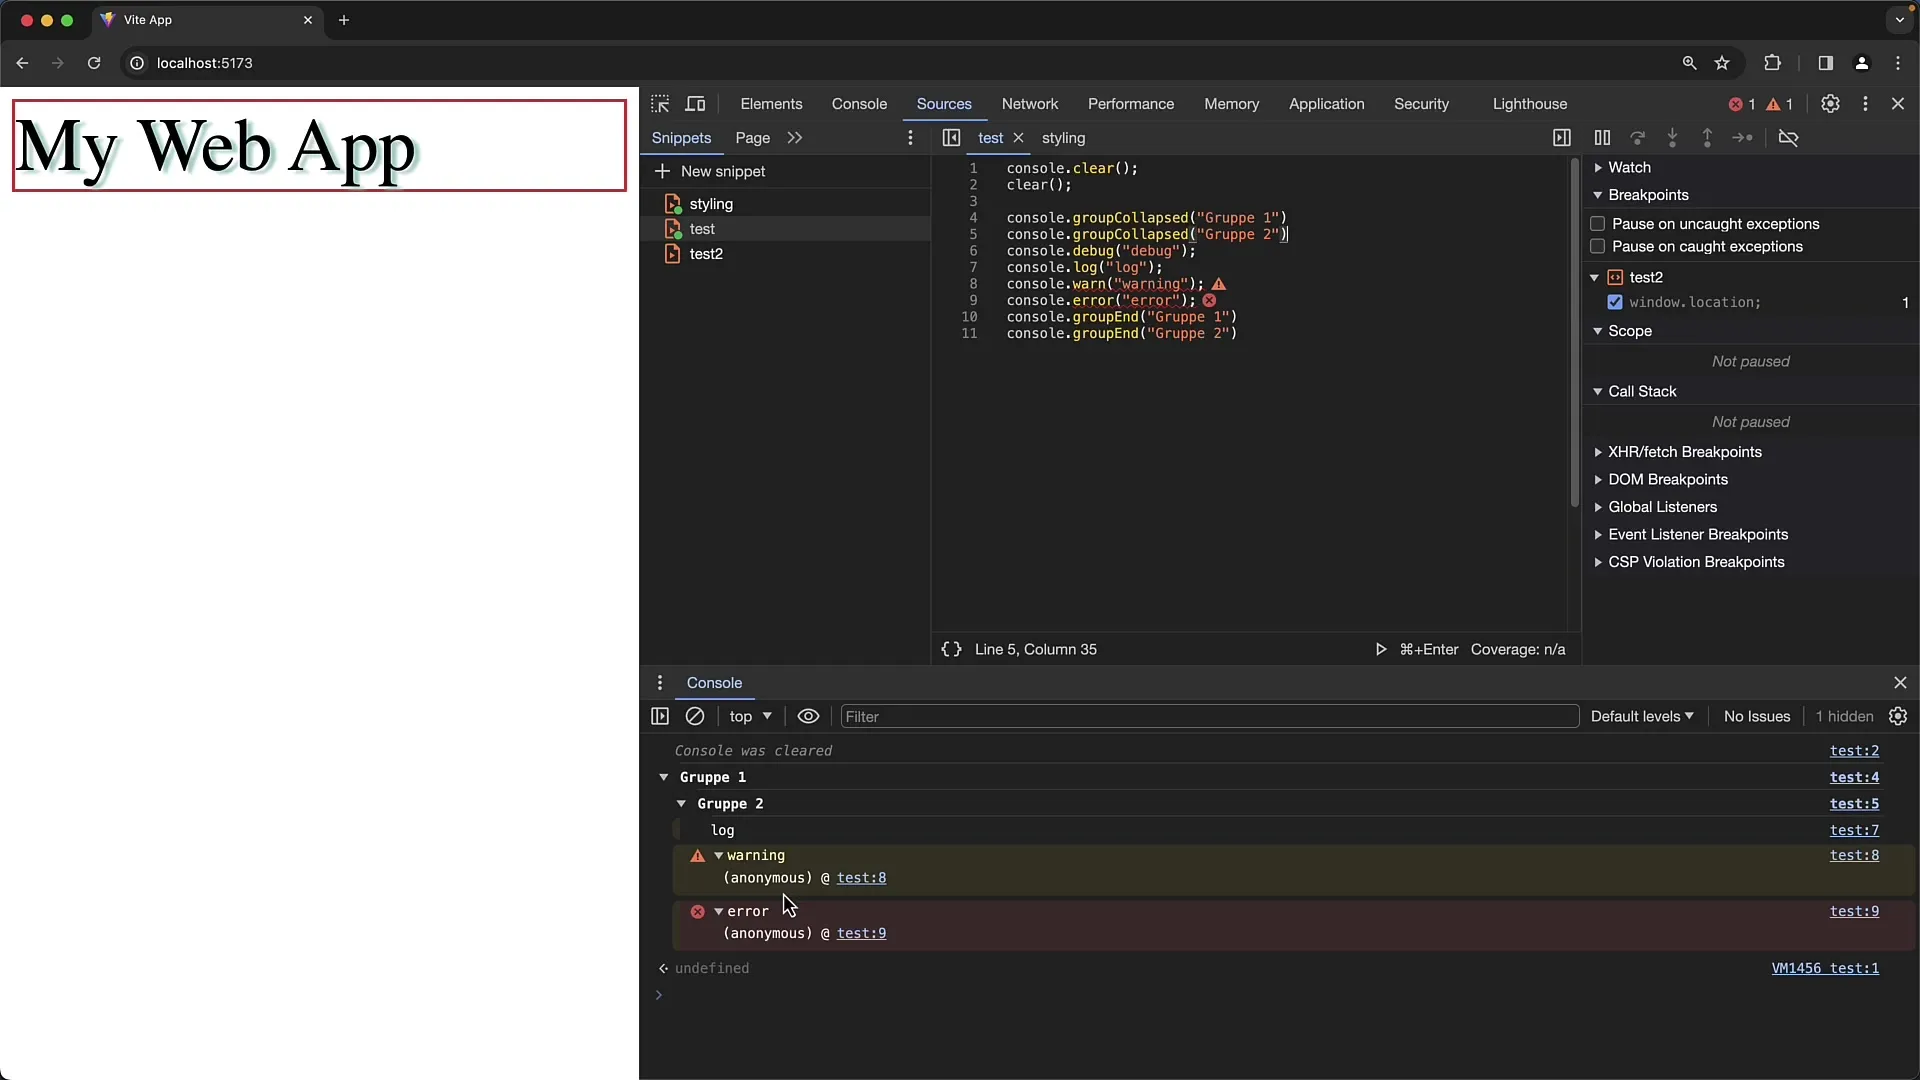
Each of these methods has specific visual representations that help users quickly distinguish between different types of messages. For example, an error is displayed with a red background, and warnings are highlighted in yellow.
It is important to note that certain log levels may be hidden in the console's filter settings. Make sure you have checked the corresponding checkboxes in the filter list if you want to see all types of log outputs.
Styling Log Outputs
You can even style log messages using CSS-like syntax within the outputs. An example of this is using %c before your log message, followed by the style rules.
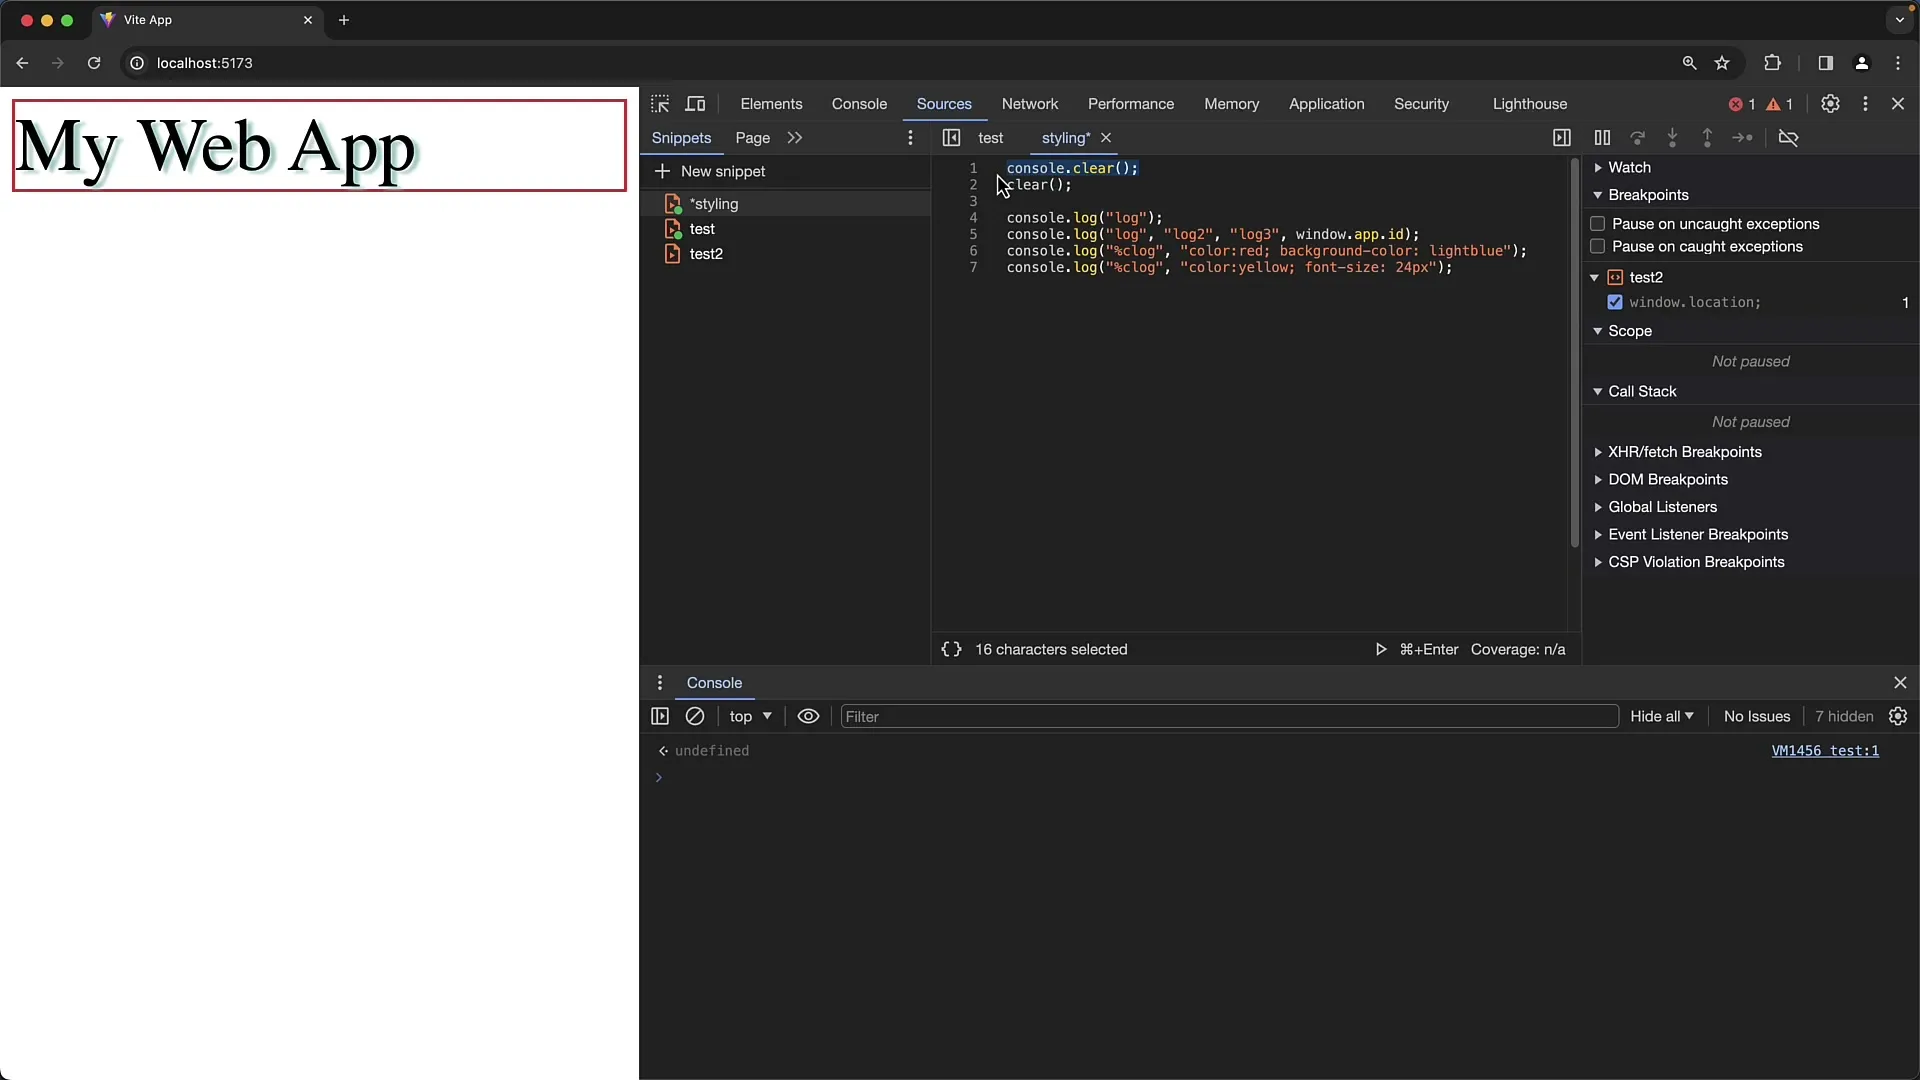
Here, for example, you can adjust the font color and background or even change the font size to highlight important outputs.
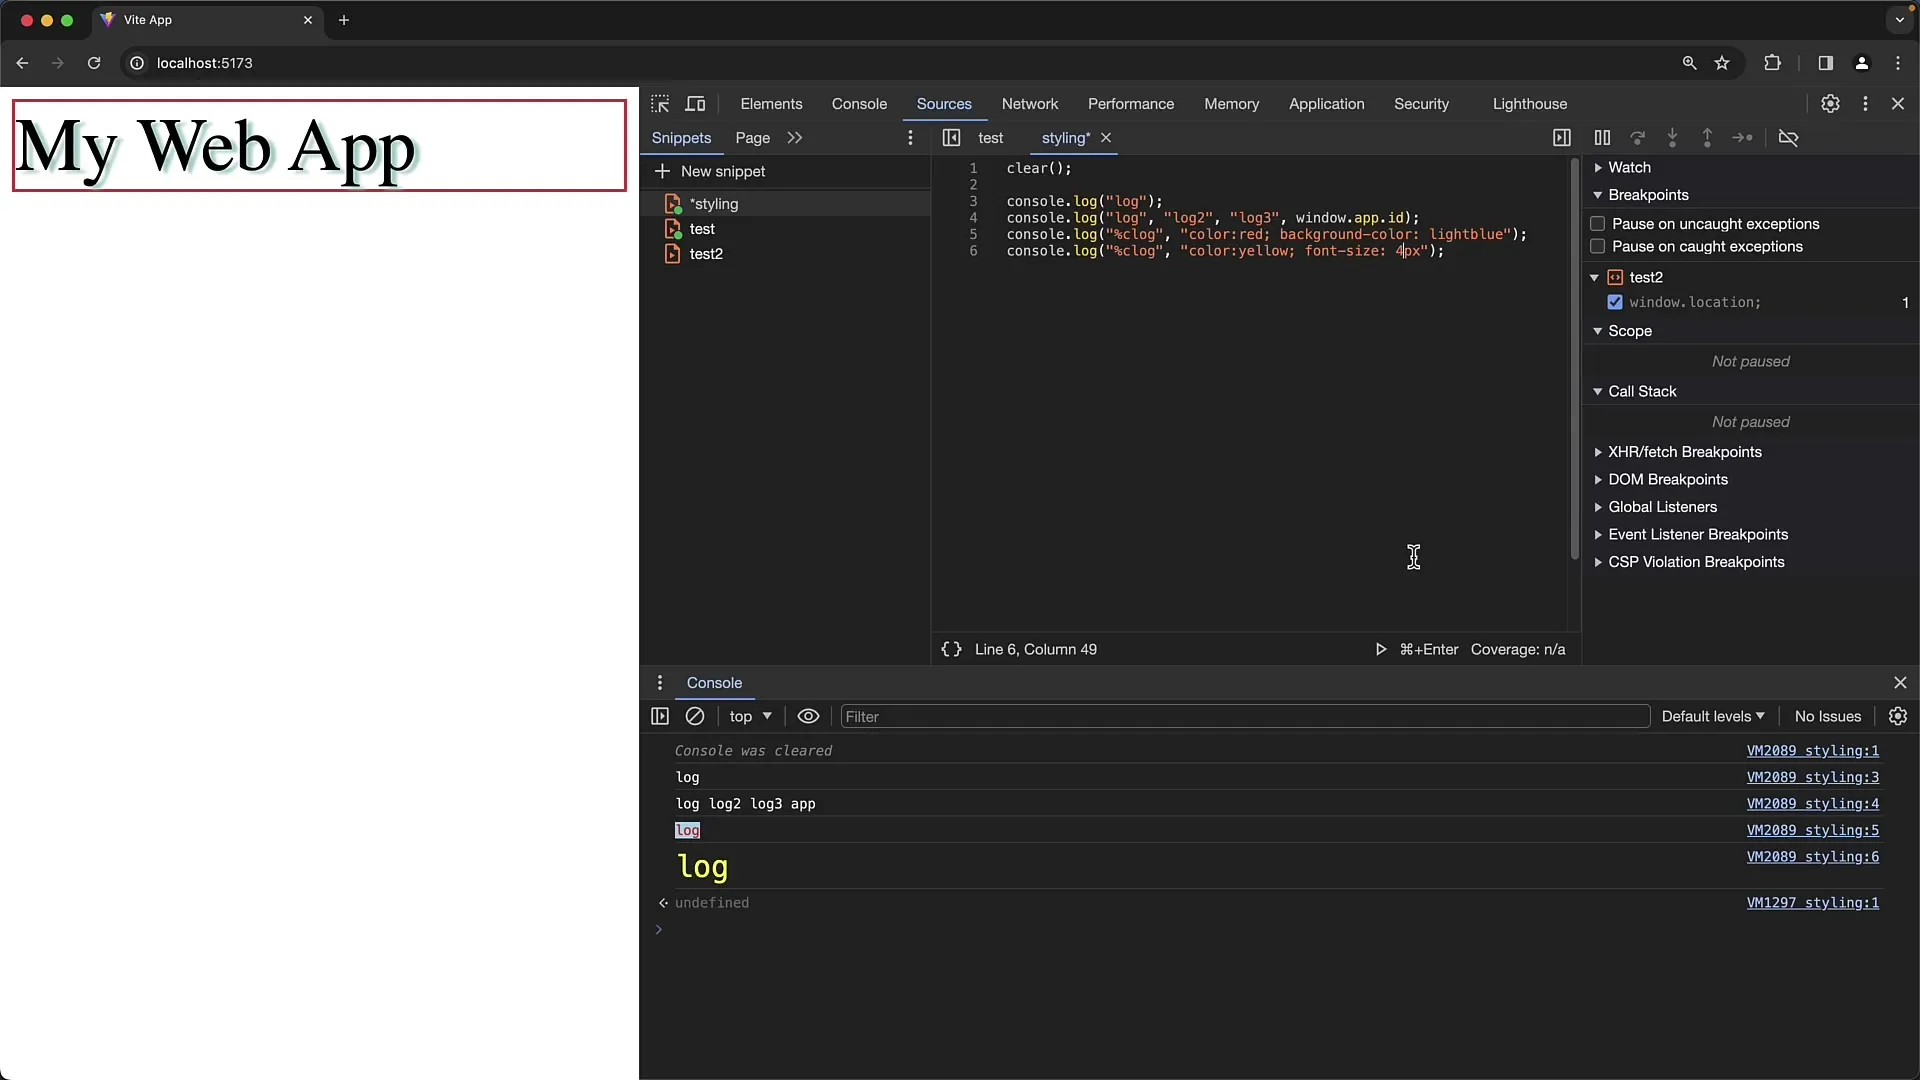
An interesting application of this function is creating warning messages to alert users to be cautious about what they input.
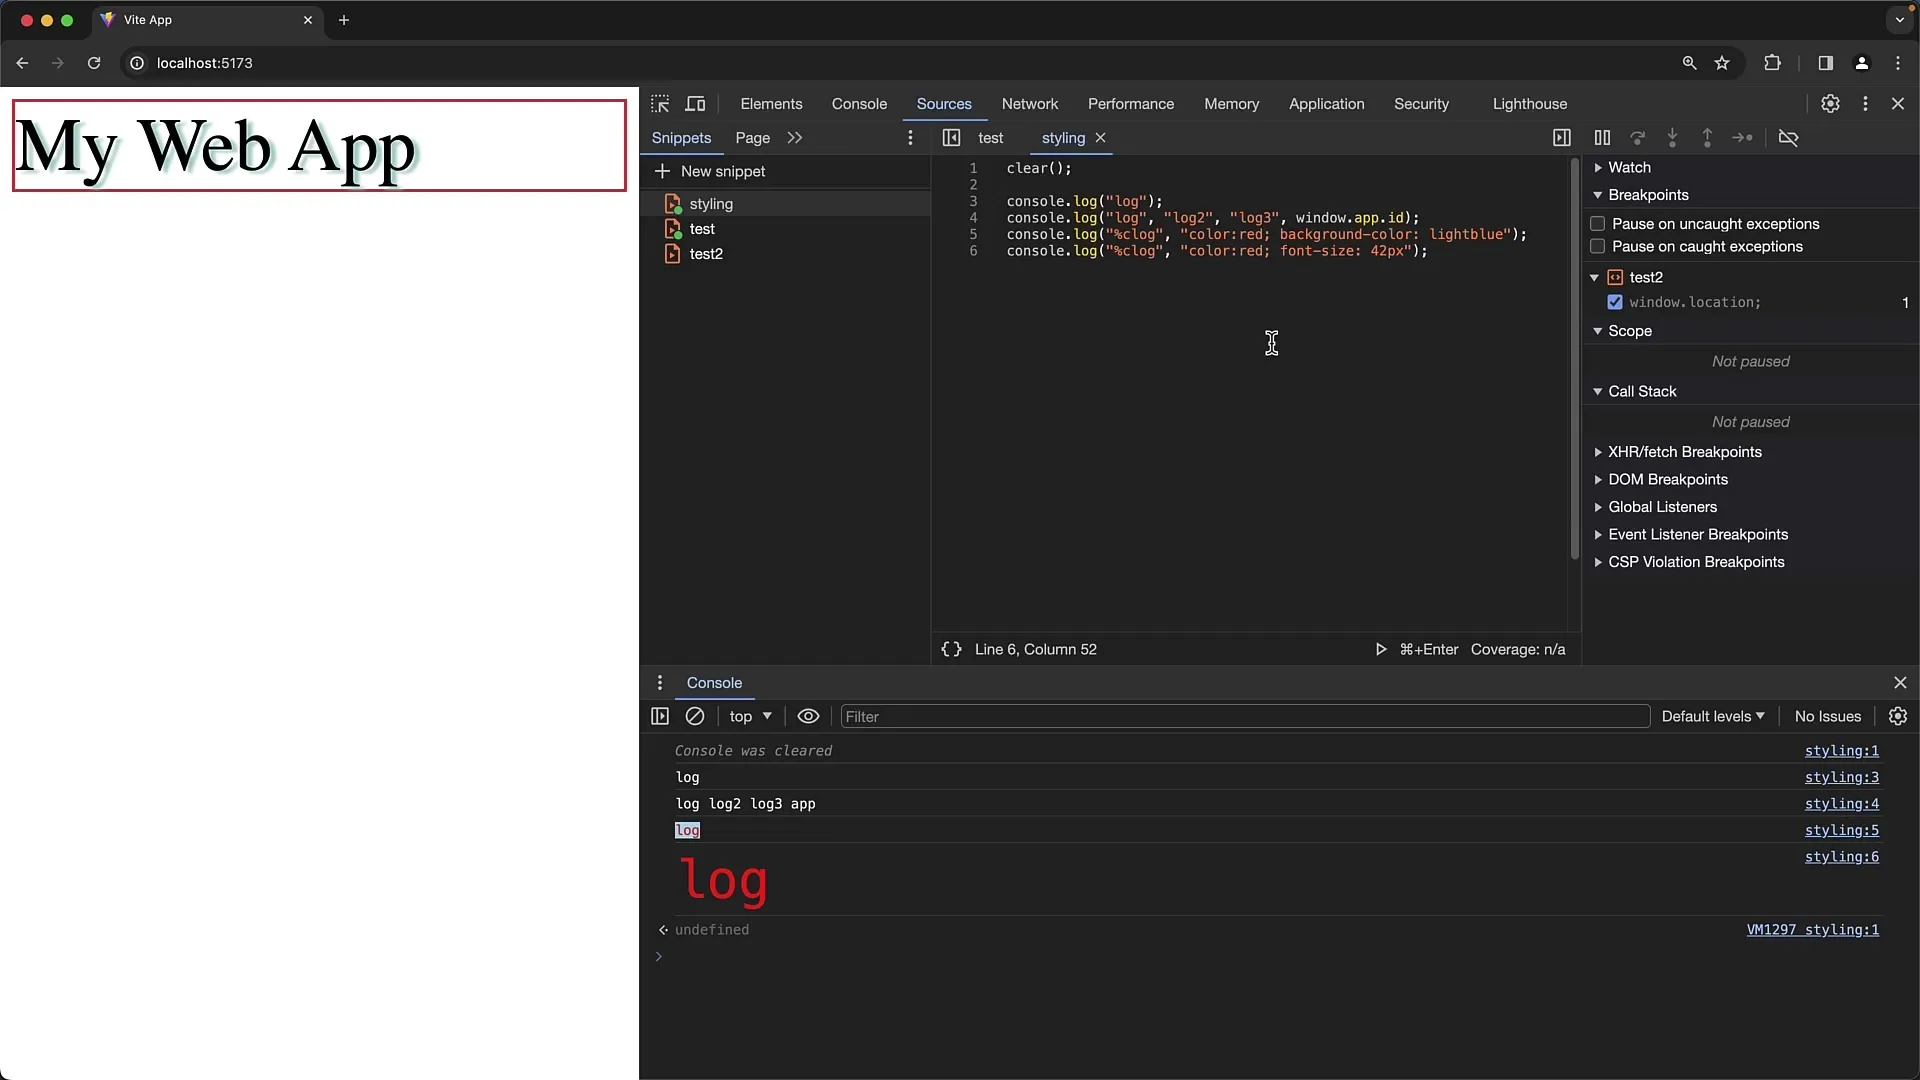
Styling is a powerful method to visually highlight information. Test out different CSS properties to achieve the desired result and ensure your log outputs are both attractive and informative.
Combining Groups and Styling
Another innovative approach is to combine the grouping of outputs with emotional appeal through styling. For example, you can create groups and emphasize the headings of these groups through styling to create a clearer picture of the respective sections.
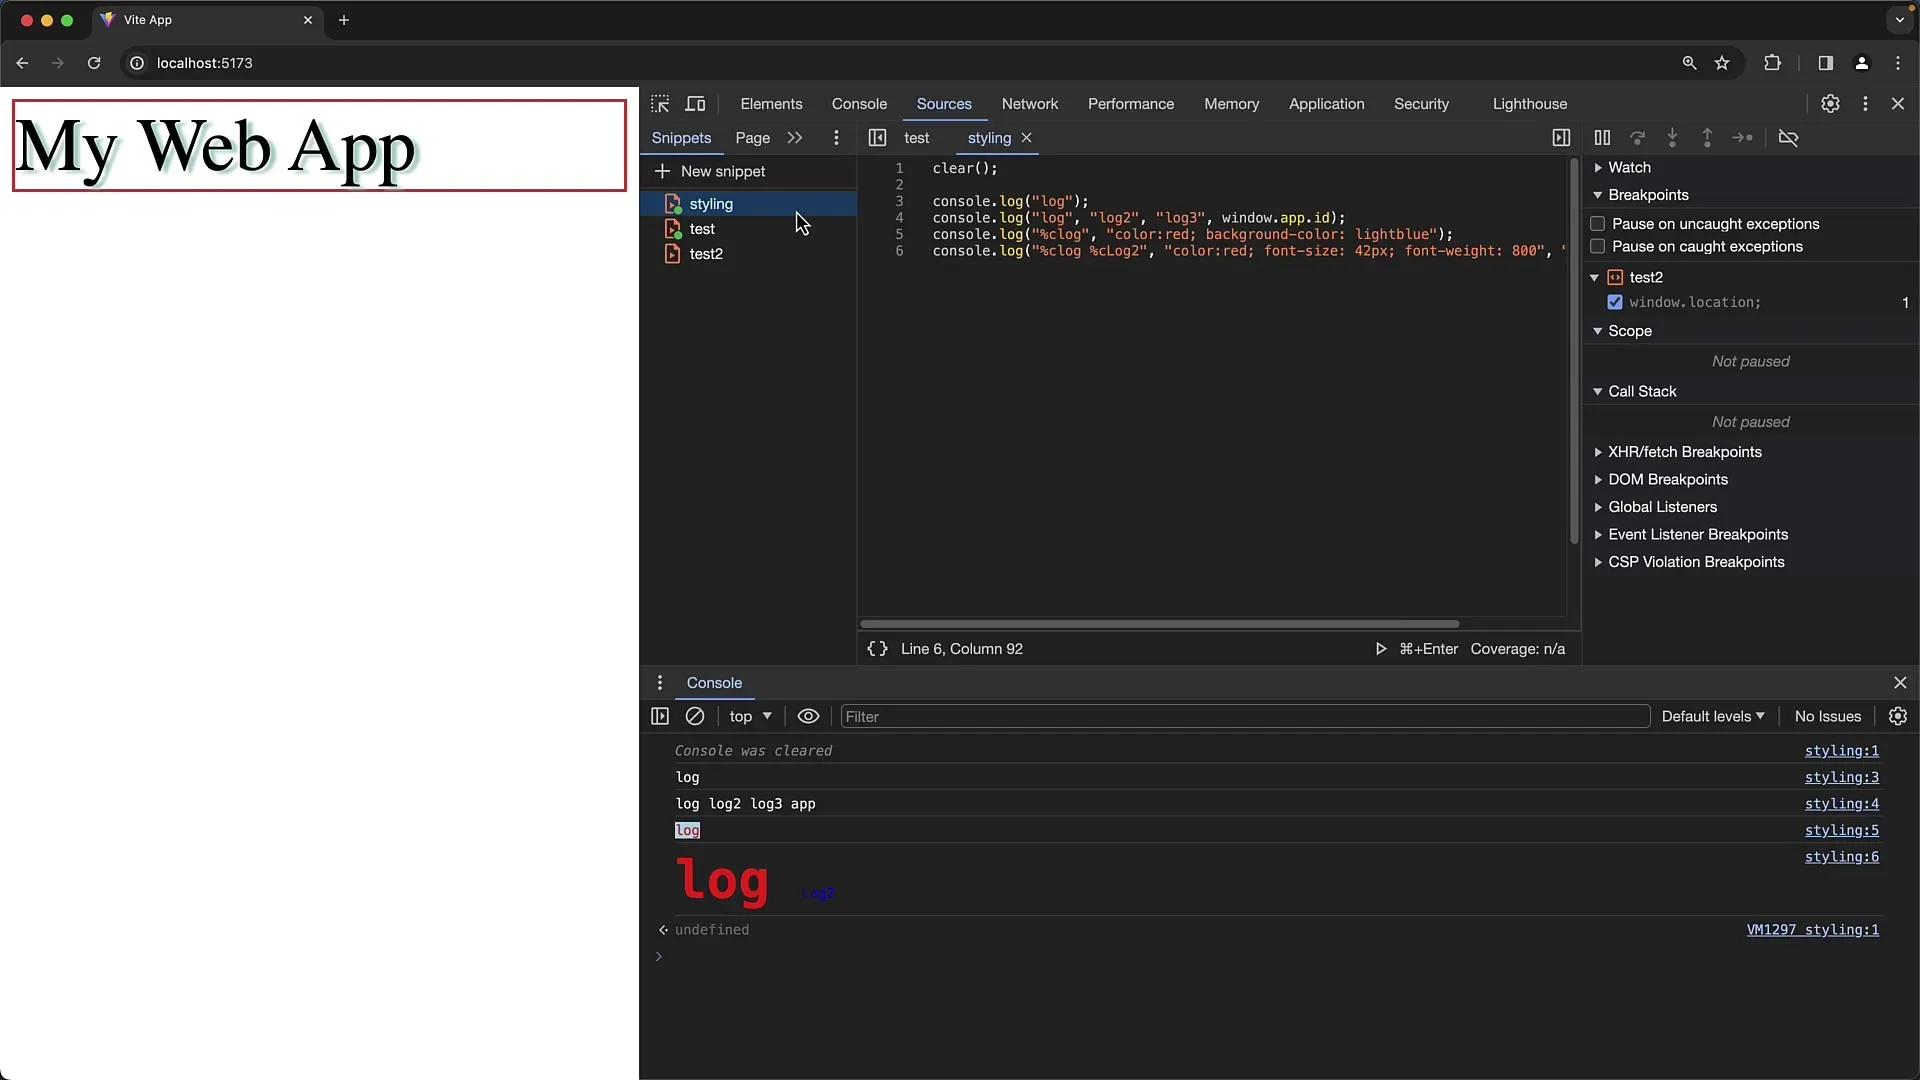
Use these options to design complex logs in a way that is both clear and intuitive to read, without drifting into excessive complexity.
Summary
In this guide, you have learned how to customize console outputs in Google Chrome to improve both readability and user-friendliness. Using functions to group and style will help you quickly identify important information and communicate clearly. With these tools, you will maintain control over your log output and optimize your development processes.
Frequently Asked Questions
What is the difference between console.group() and console.groupCollapsed()?console.group() displays the group by default expanded, while console.groupCollapsed() displays the group by default collapsed.
How can I use CSS styling in console outputs?You can use the %c format followed by style rules to style the output.
What log levels are available in Chrome Developer Tools?There are different log levels: console.log(), console.info(), console.warn(), console.error(), and console.debug().
Can I create groups within groups?Yes, you can create groups within groups to create hierarchical structures in your log outputs.
Why can't I see all log messages?Sometimes, certain log levels are hidden in the console's filter settings. Make sure the corresponding checkboxes are checked.


