In this tutorial, I will show you how to effectively use the network tools of Google Chrome to analyze network requests and responses. The network analyses help you understand the loading times of web pages, identify data transfer issues, and improve the performance of your applications. This is particularly useful for developers who want to understand and optimize the functionality of their websites.
Key insights
- Disable the cache for a realistic analysis of requests.
- Use the header information from requests and responses to understand the communication between client and server.
- Monitor the chronological sequence of requests in the waterfall diagram.
- Filter and sort requests to quickly find relevant information.
- Use the console for troubleshooting and monitoring communication via WebSockets.
Step-by-step guide
First, open the Chrome Developer Tools. You can do this by right-clicking on the page and selecting "Inspect" or by using the shortcut F12 (Windows) or Command + Option + I (Mac).
In the Network tab, check the box "Disable Cache." This is important because it ignores the browser cache, causing the browser to reload all files from the server. This ensures that you receive the latest files and facilitates analysis.
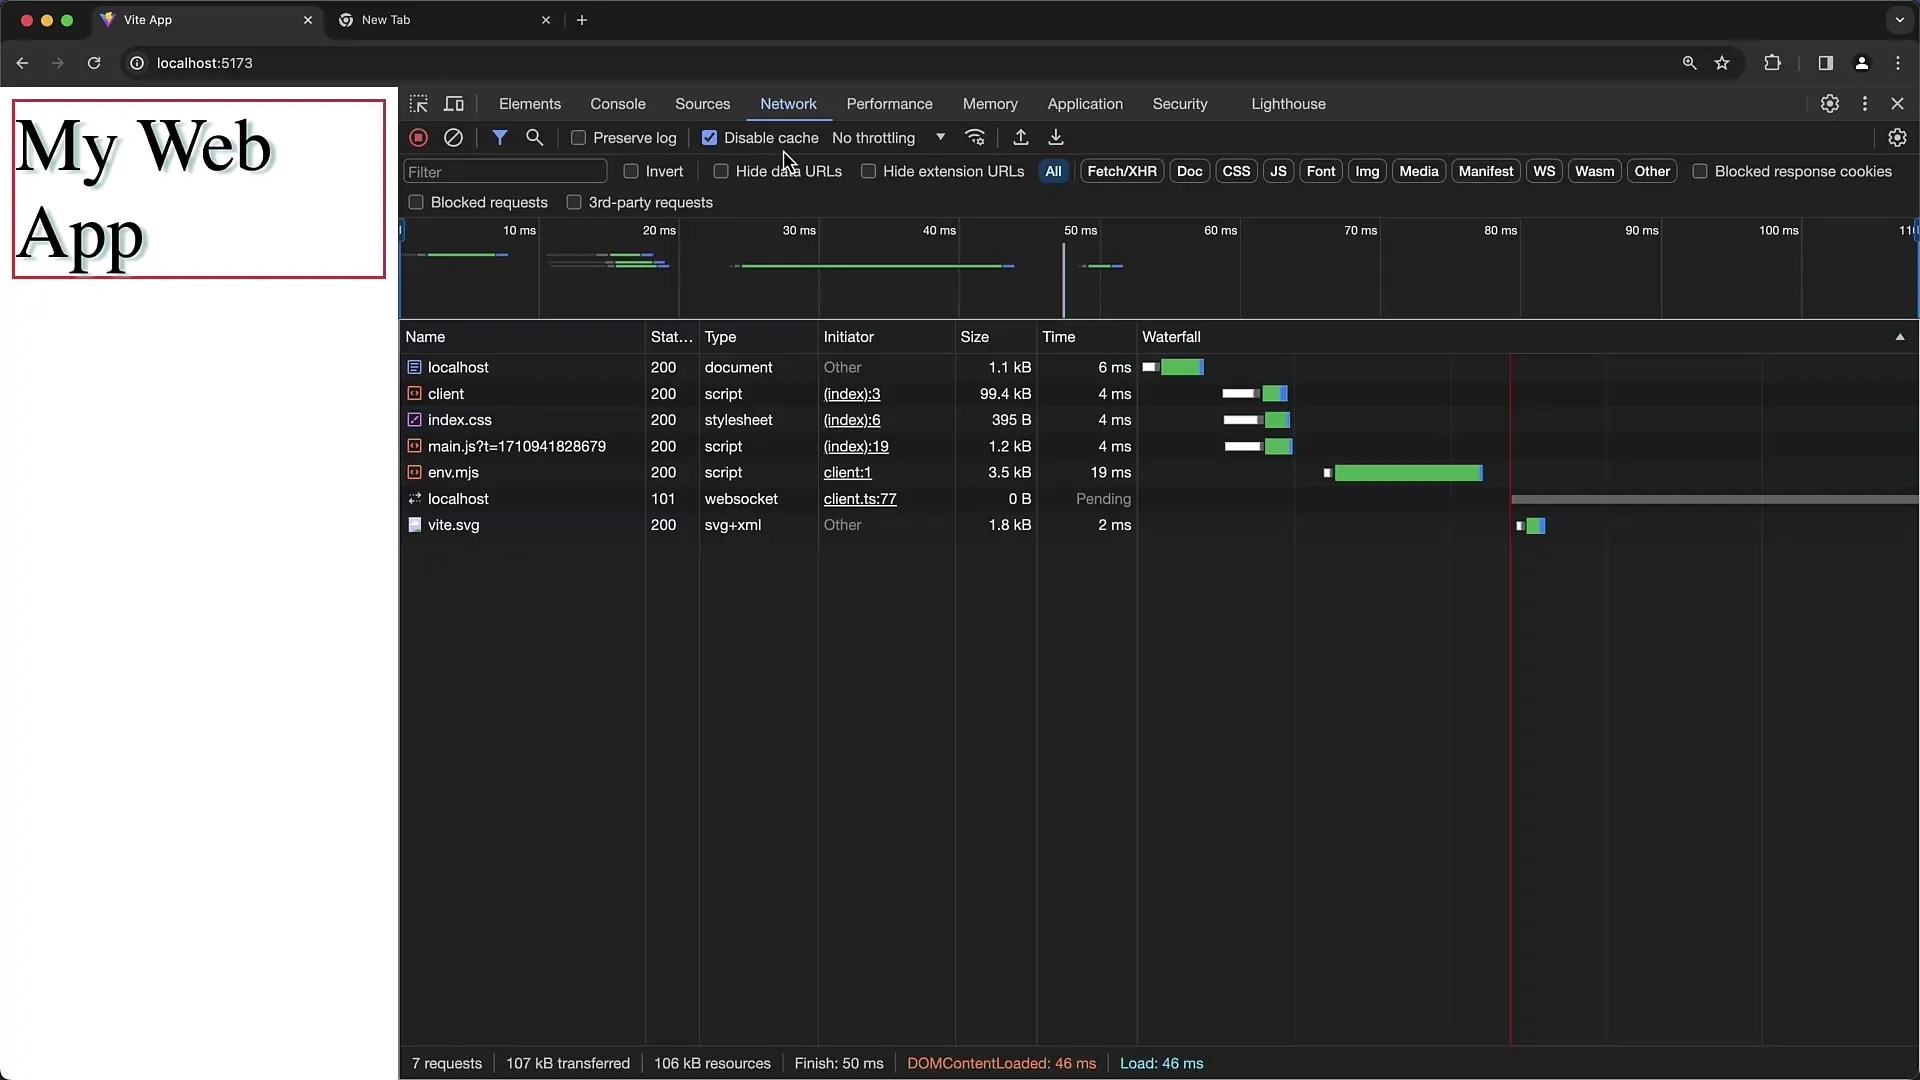
Reload the page. You can do this by pressing F5 or using “Ctrl + R” (Windows) or “Command + R” (Mac). After reloading, you will see a list of requests made by the page.
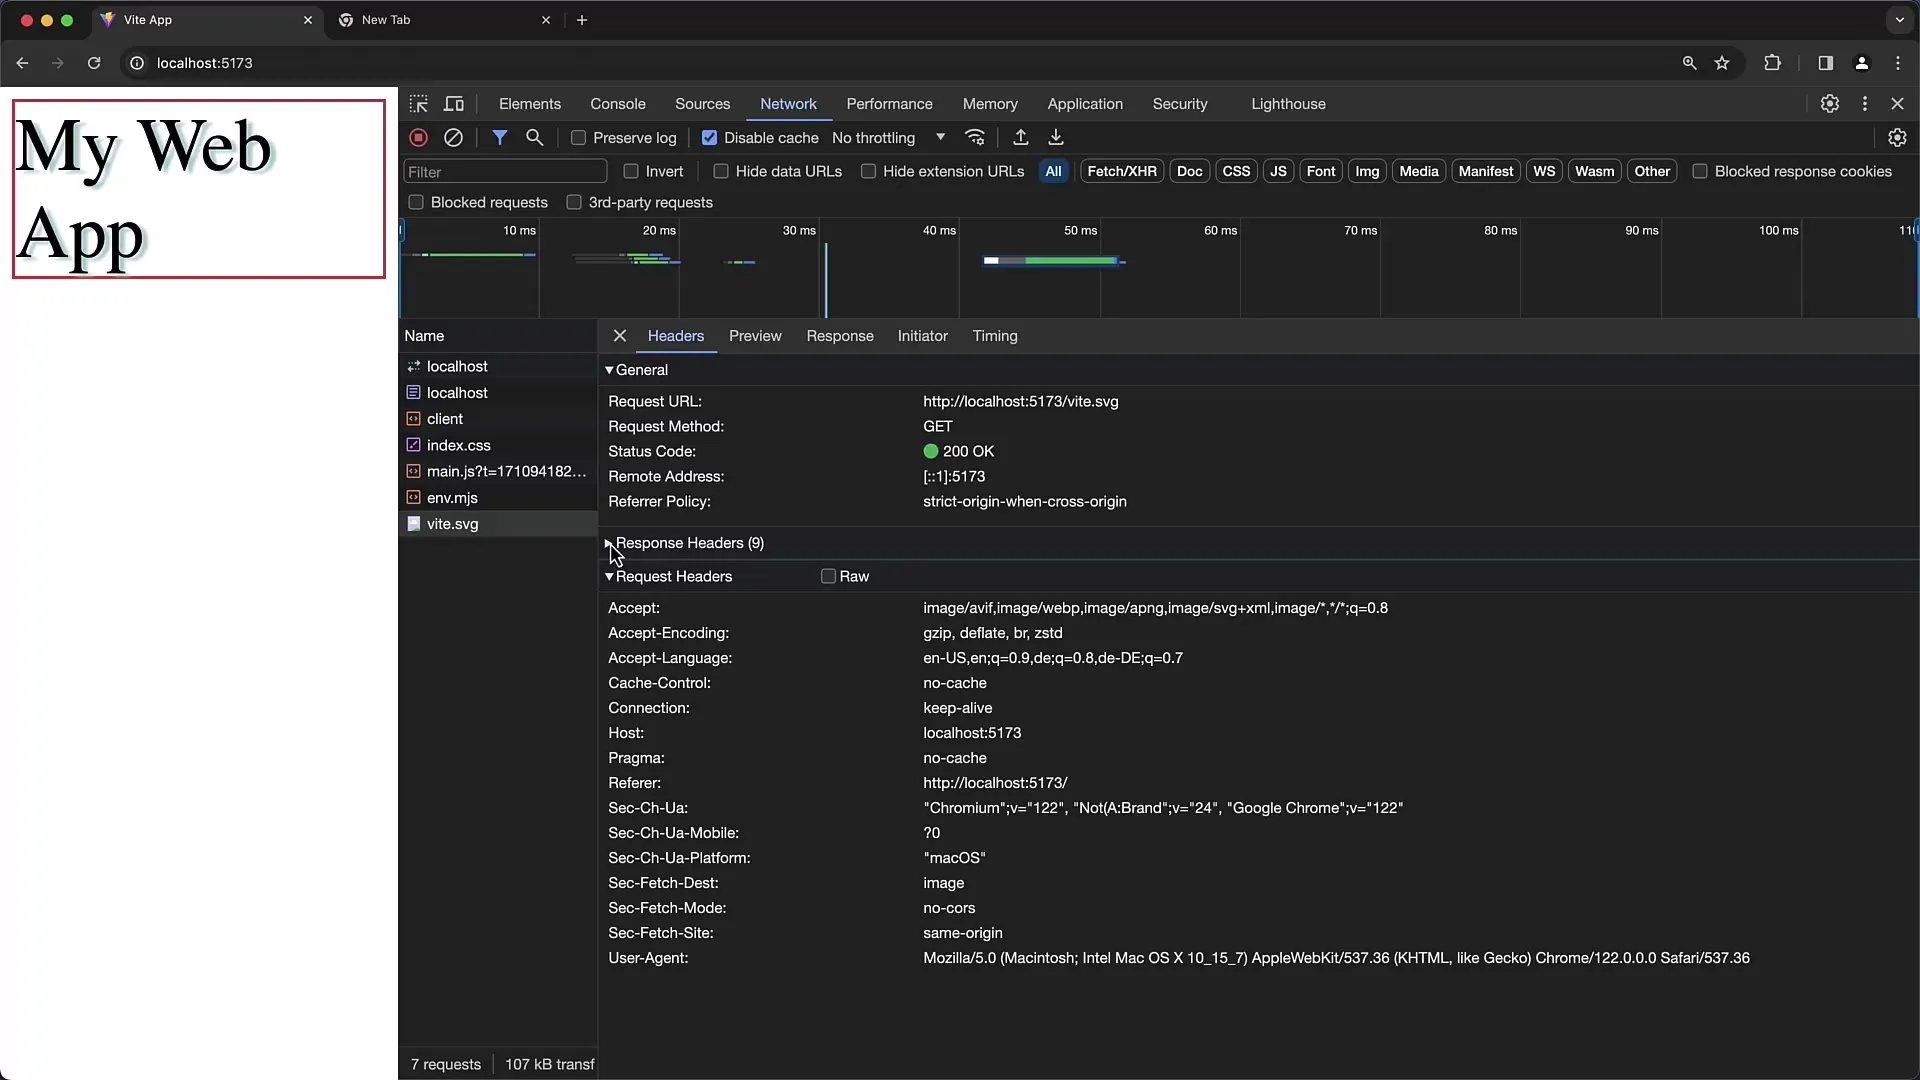
By clicking on an entry in the list, you can view the details. The request headers are particularly important because they contain information about the sent data. You can switch between the raw form and a formatted view.
The same applies to the response headers. After the server processes the request, it sends back the response. Here too, you can view the header information to understand how the communication transpired.
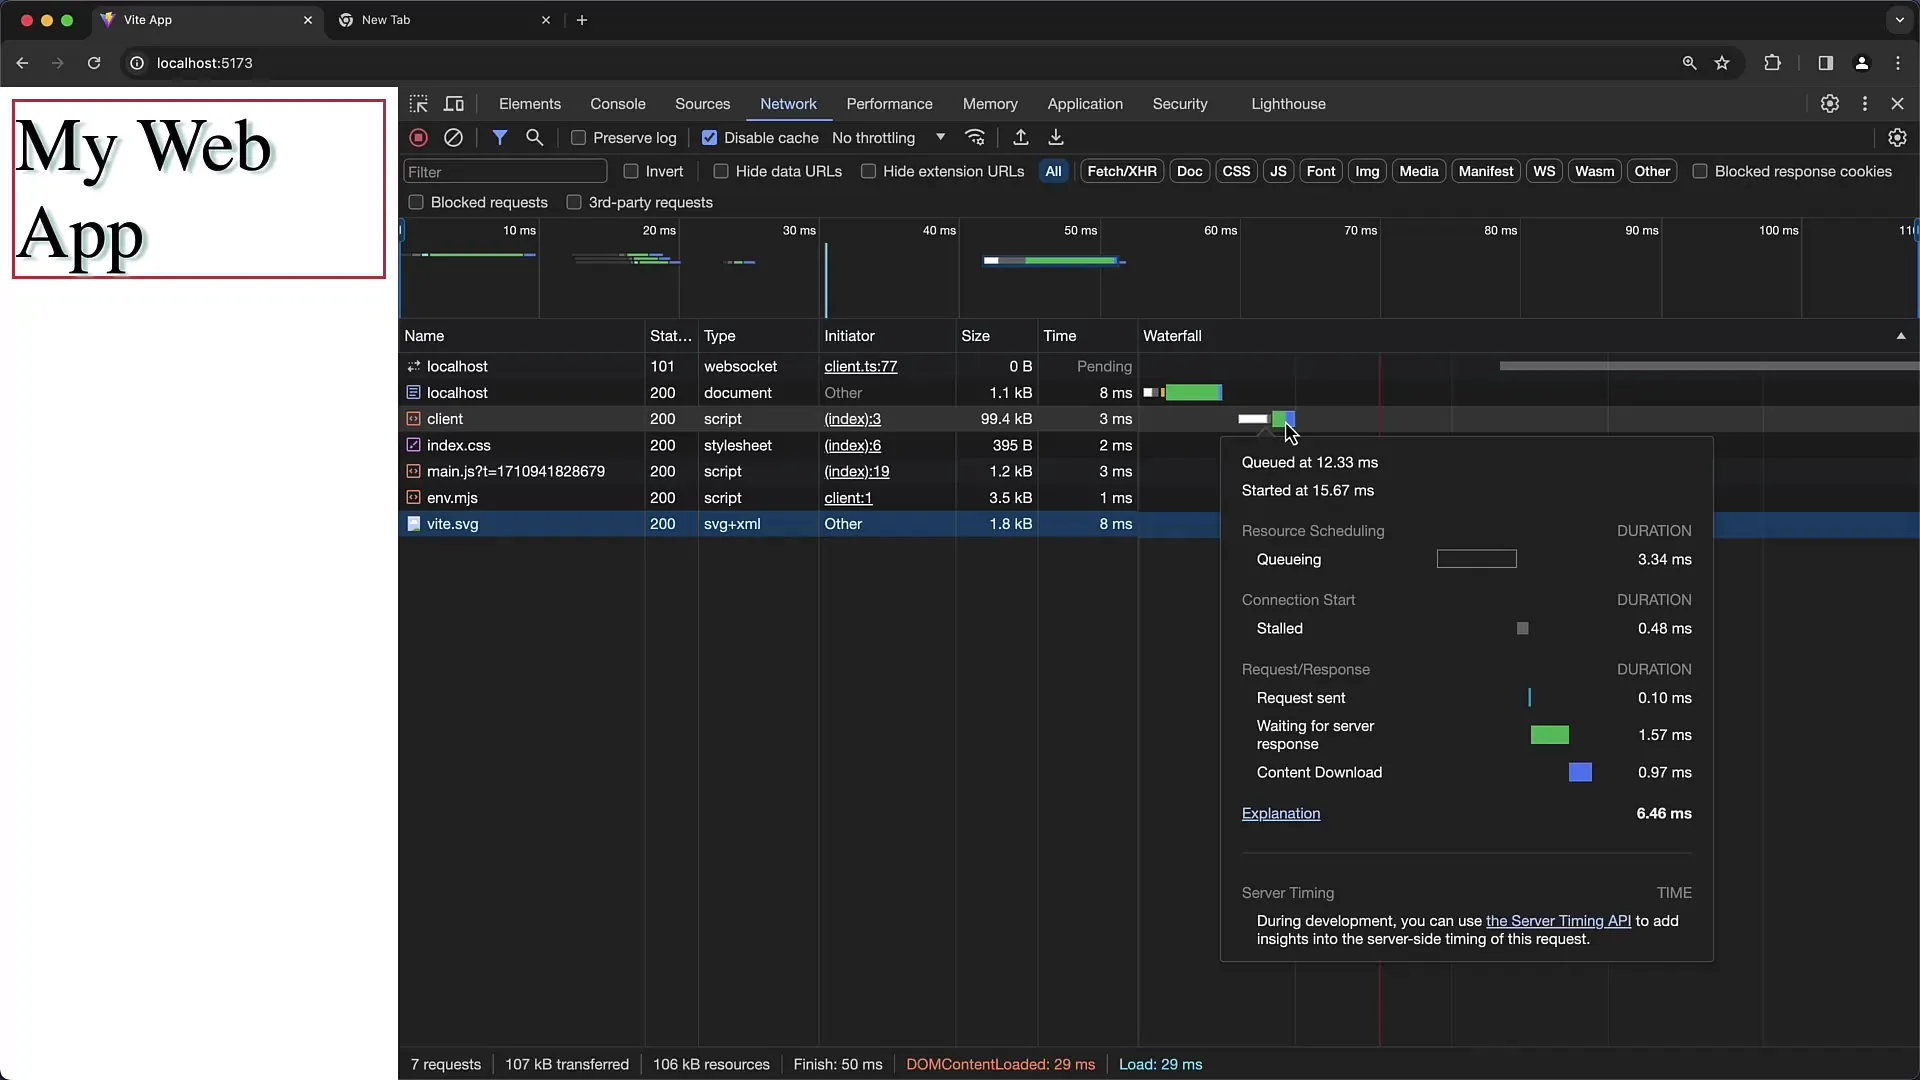
The waterfall diagram is an important tool to see the duration and sequence of requests. The bars indicate when a request started and when it was completed. Click on the "Waterfall" column to visually represent the chronological sequence.
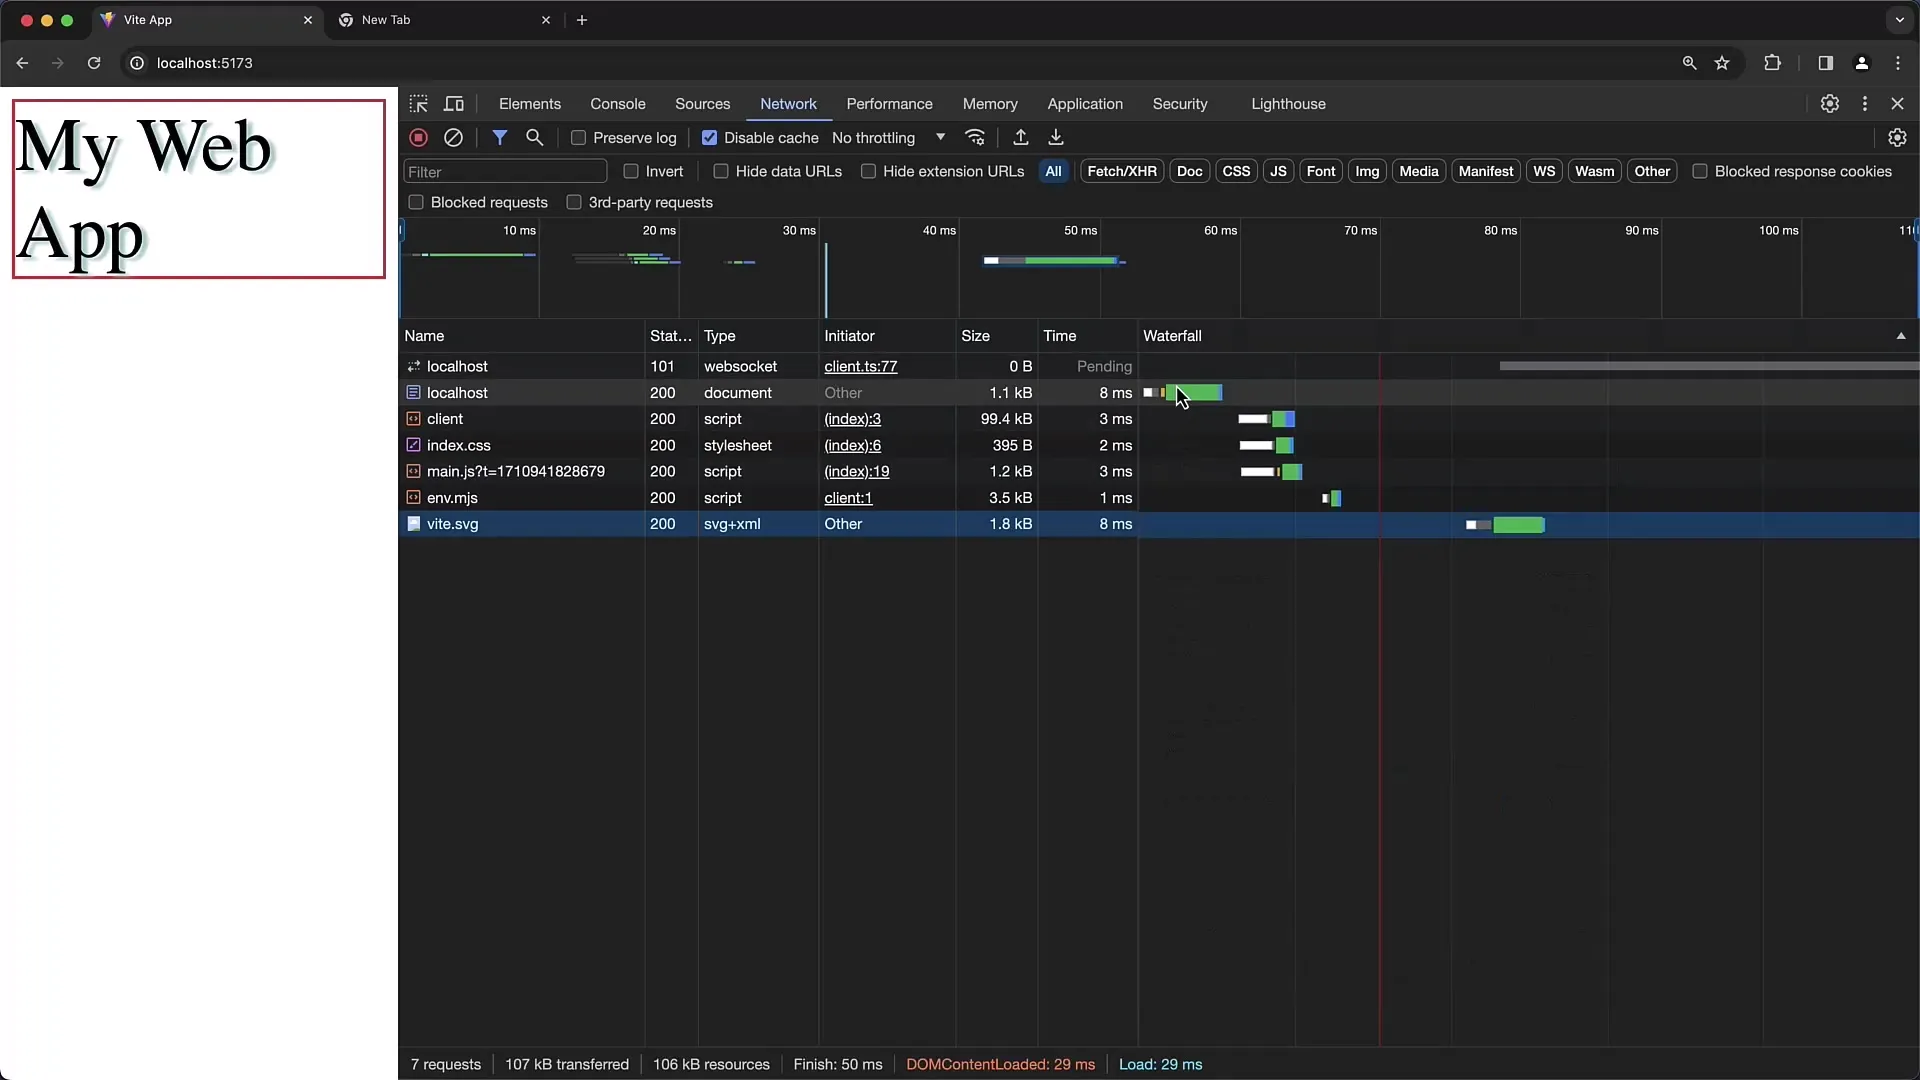
When analyzing loading times, it's helpful to know the exact time used for each request. For example, the loading time for the index HTML file may be significantly faster than for external scripts or CSS files. You can identify all of this in the waterfall view.
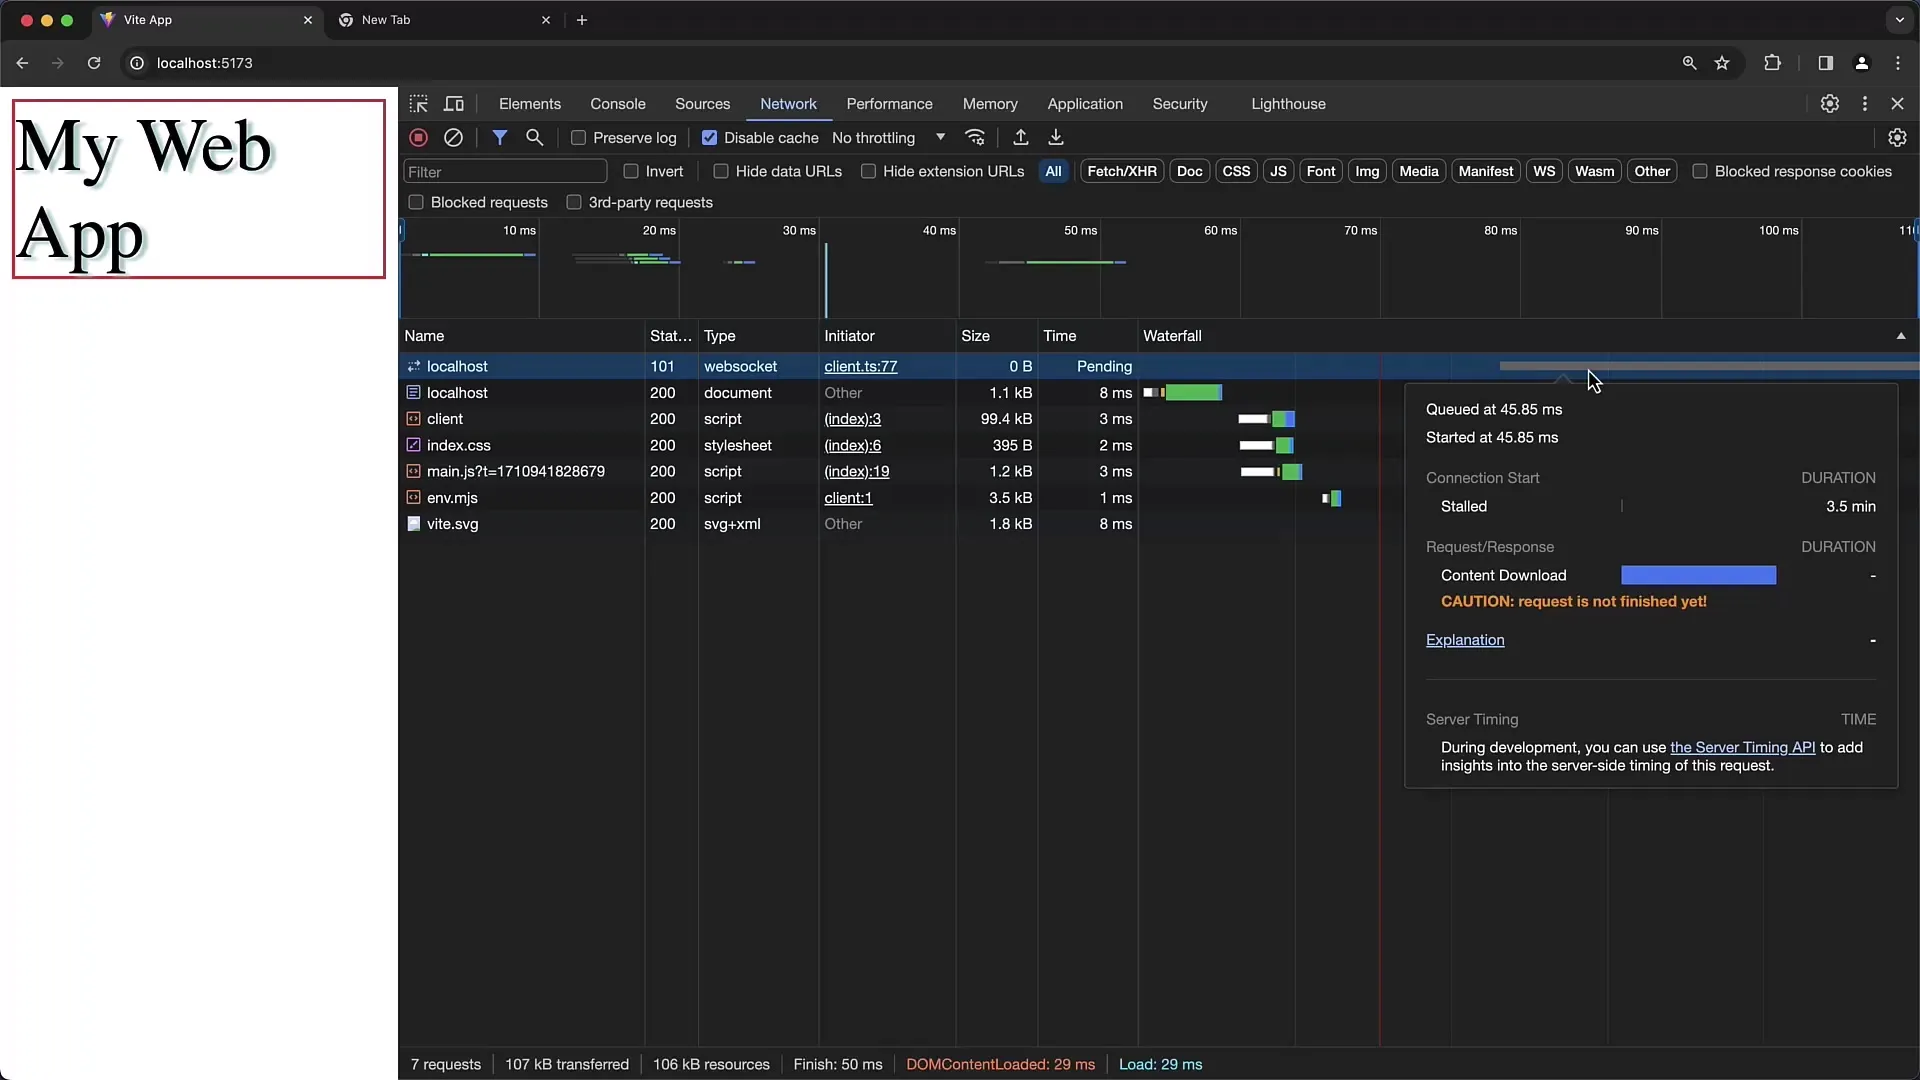
WebSocket connections are an important point to consider. These connections often remain open and are therefore not marked as completed in the waterfall diagram. It's important to understand that WebSockets are used for real-time communication and may not always load or terminate normally.
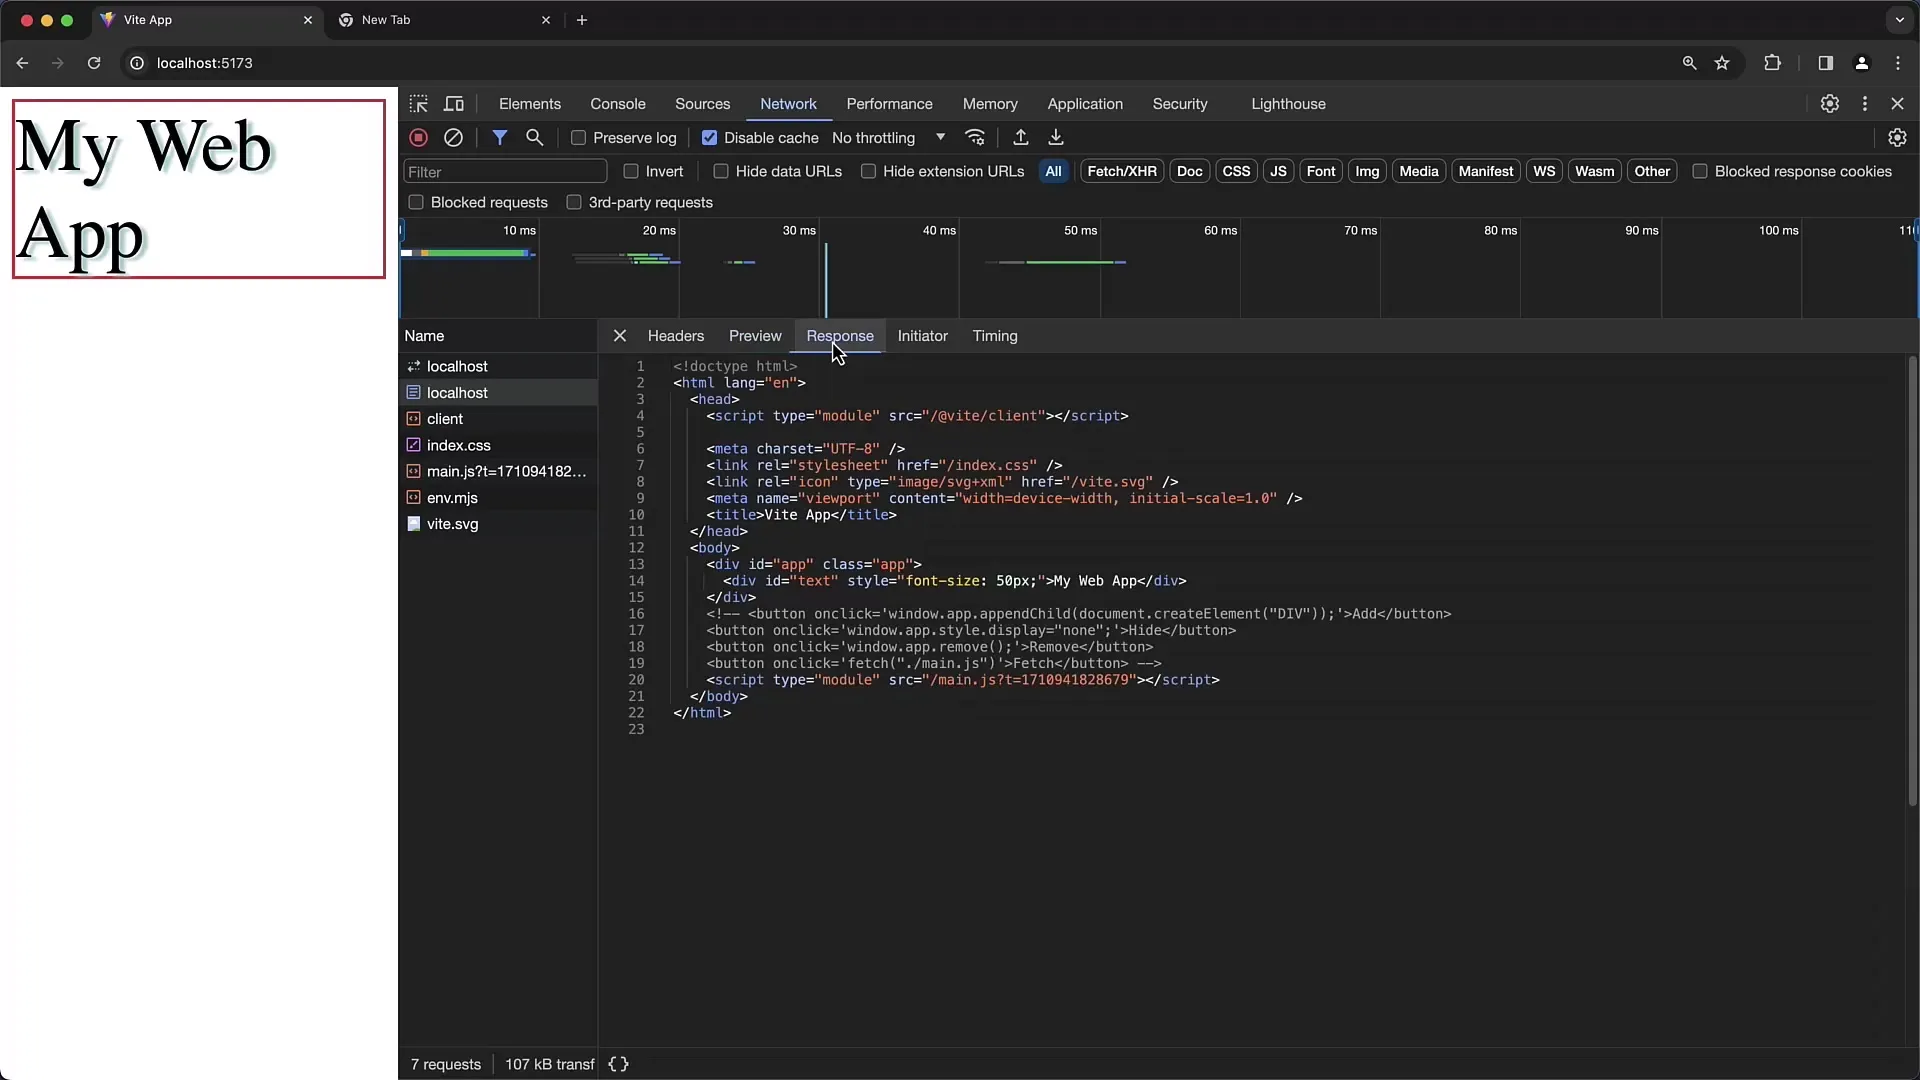
When you click on a request, you'll also see a preview of the response. For an HTML request, for example, you can view the rendered HTML preview. This is particularly useful when you want to analyze which HTML content is returned by the server.
In the "Initiator" tab, you can trace which scripts or files triggered the request. This gives you an idea of how the overall structure of your website functions and how elements interact with each other.
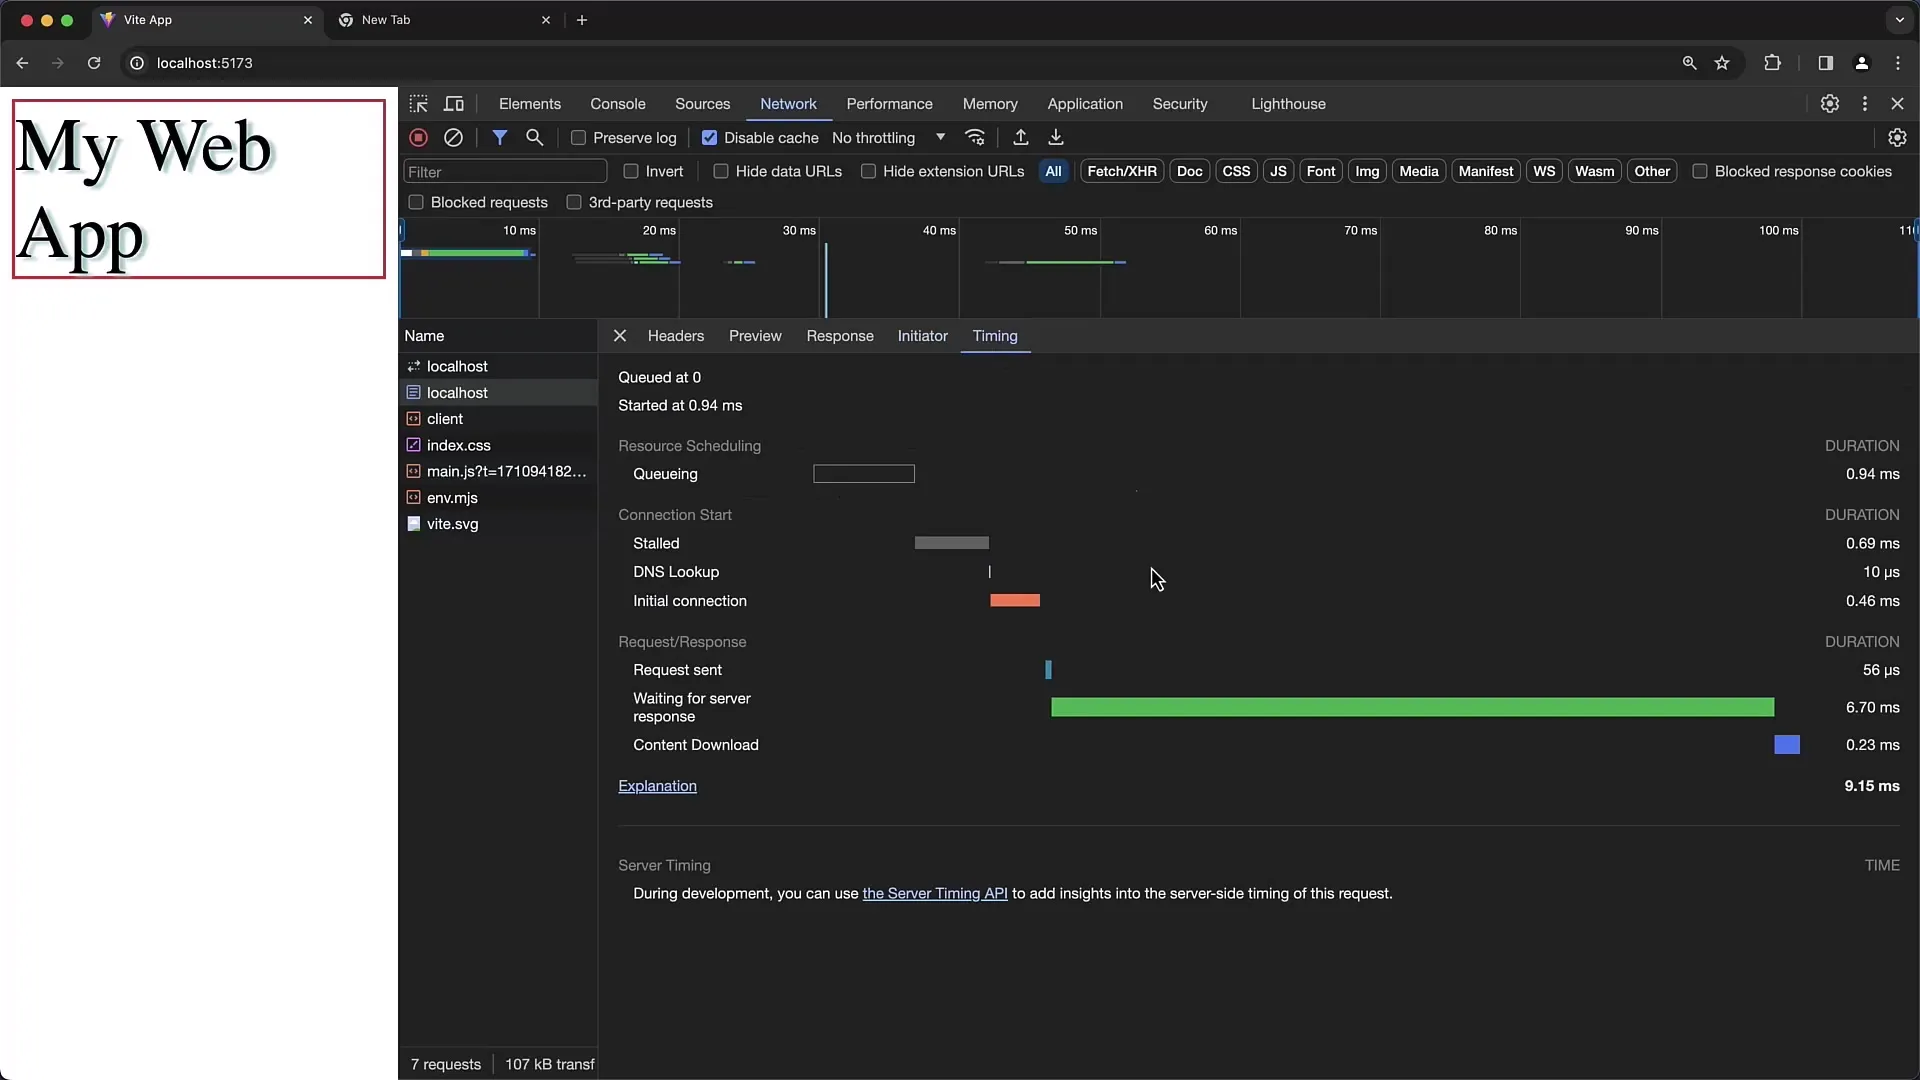
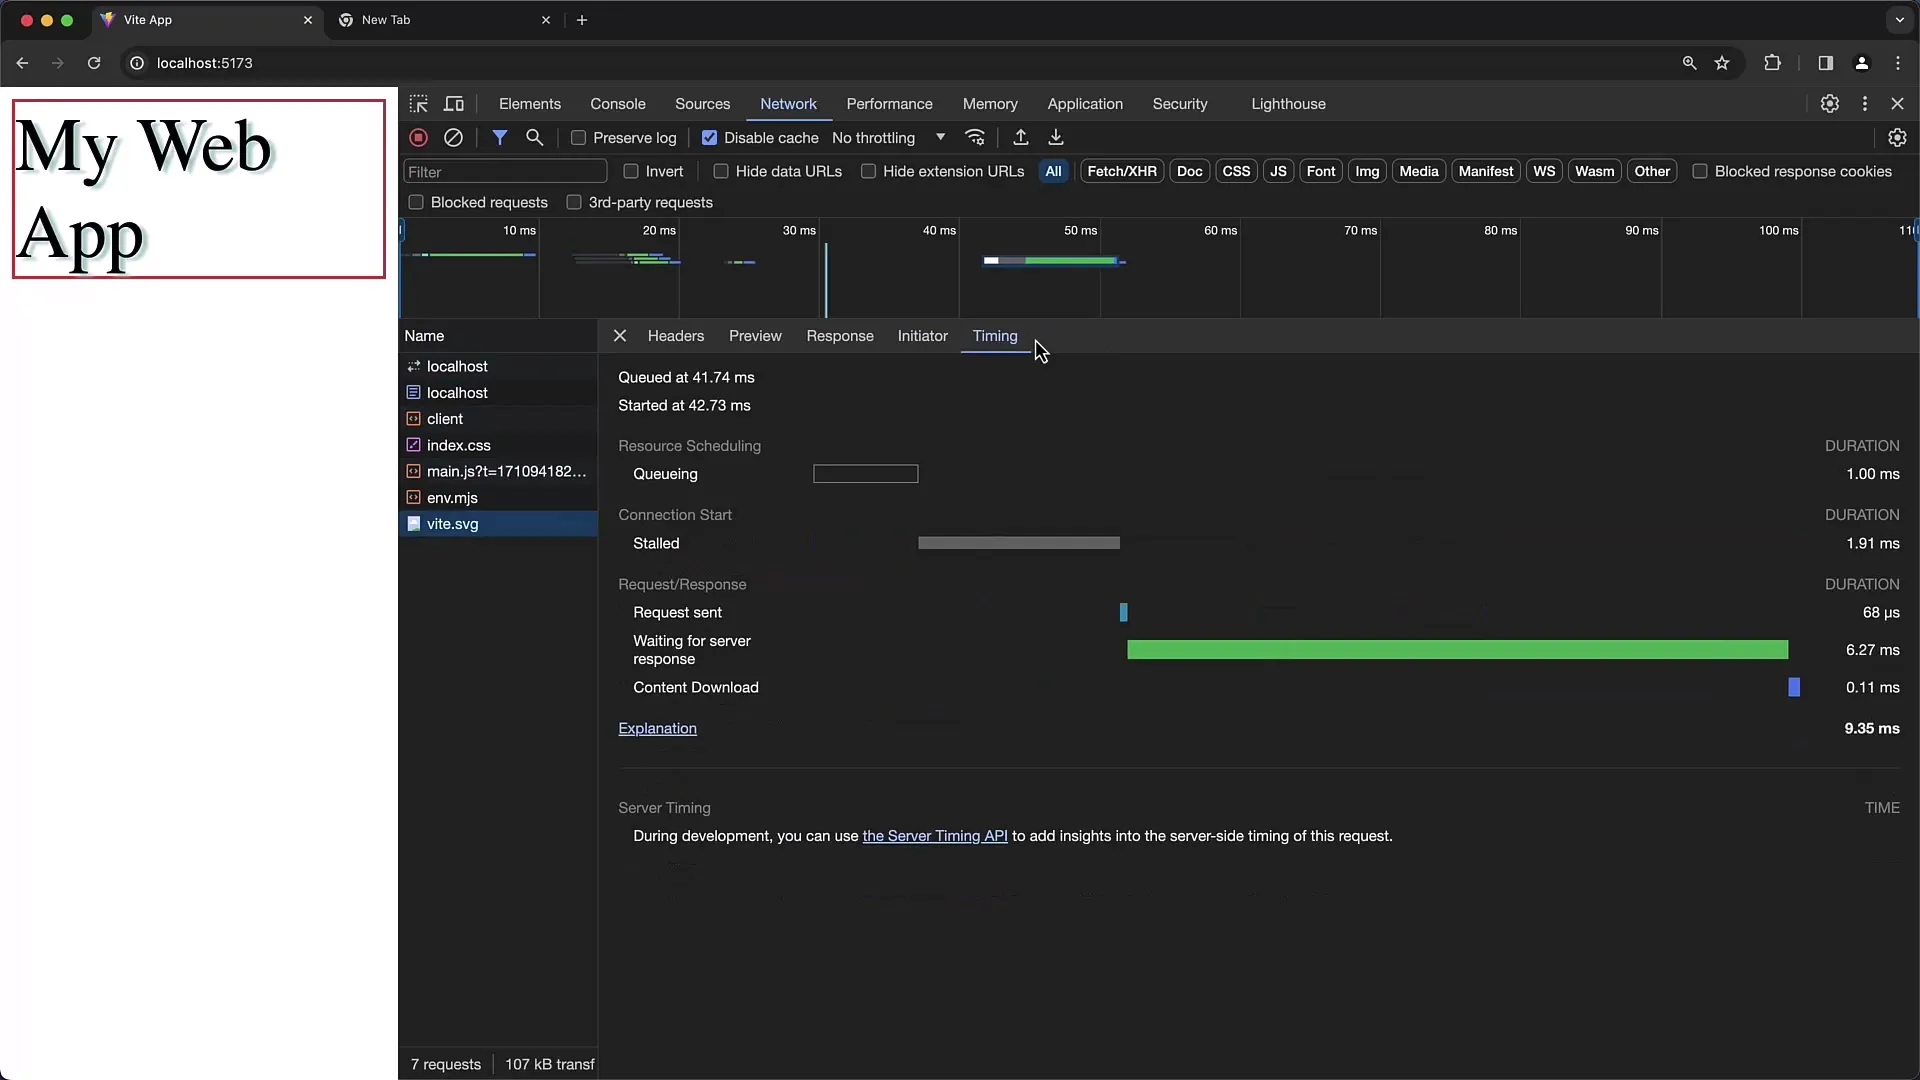
Timing is another important aspect. You can analyze which requests took longer than expected. Analyzing loading times is crucial for identifying network bottlenecks. The waterfall diagram is particularly helpful in this regard.

If you are working on a page that generates multiple requests, you can adjust the sorting of the requests to improve clarity. For example, you can sort requests by the time of creation, name, or size.
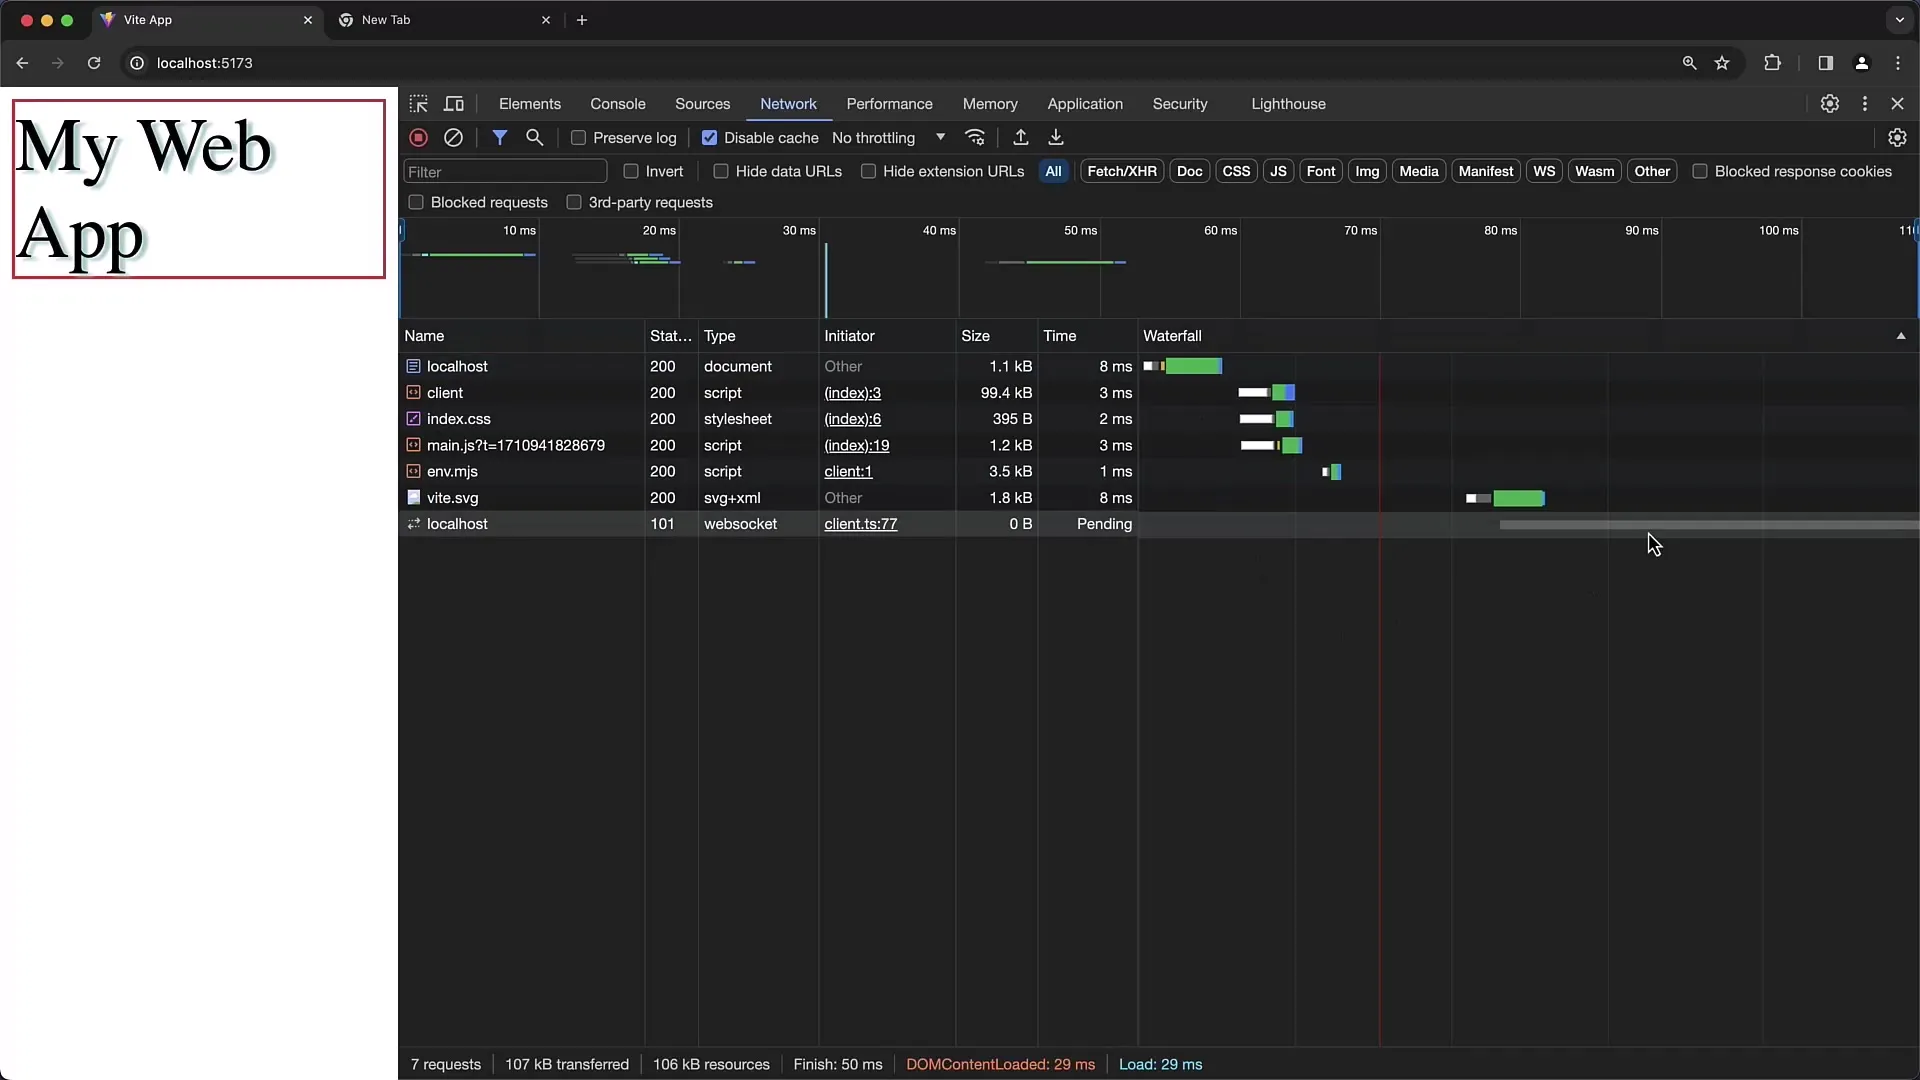
Use the filter field to quickly find specific requests. You can search for specific terms or types, such as CSS or JavaScript, to get targeted information.
By checking the "Preserve Log" checkbox, you can ensure that all requests are recorded, even when switching between pages. Without this feature, the list will reset when switching pages.
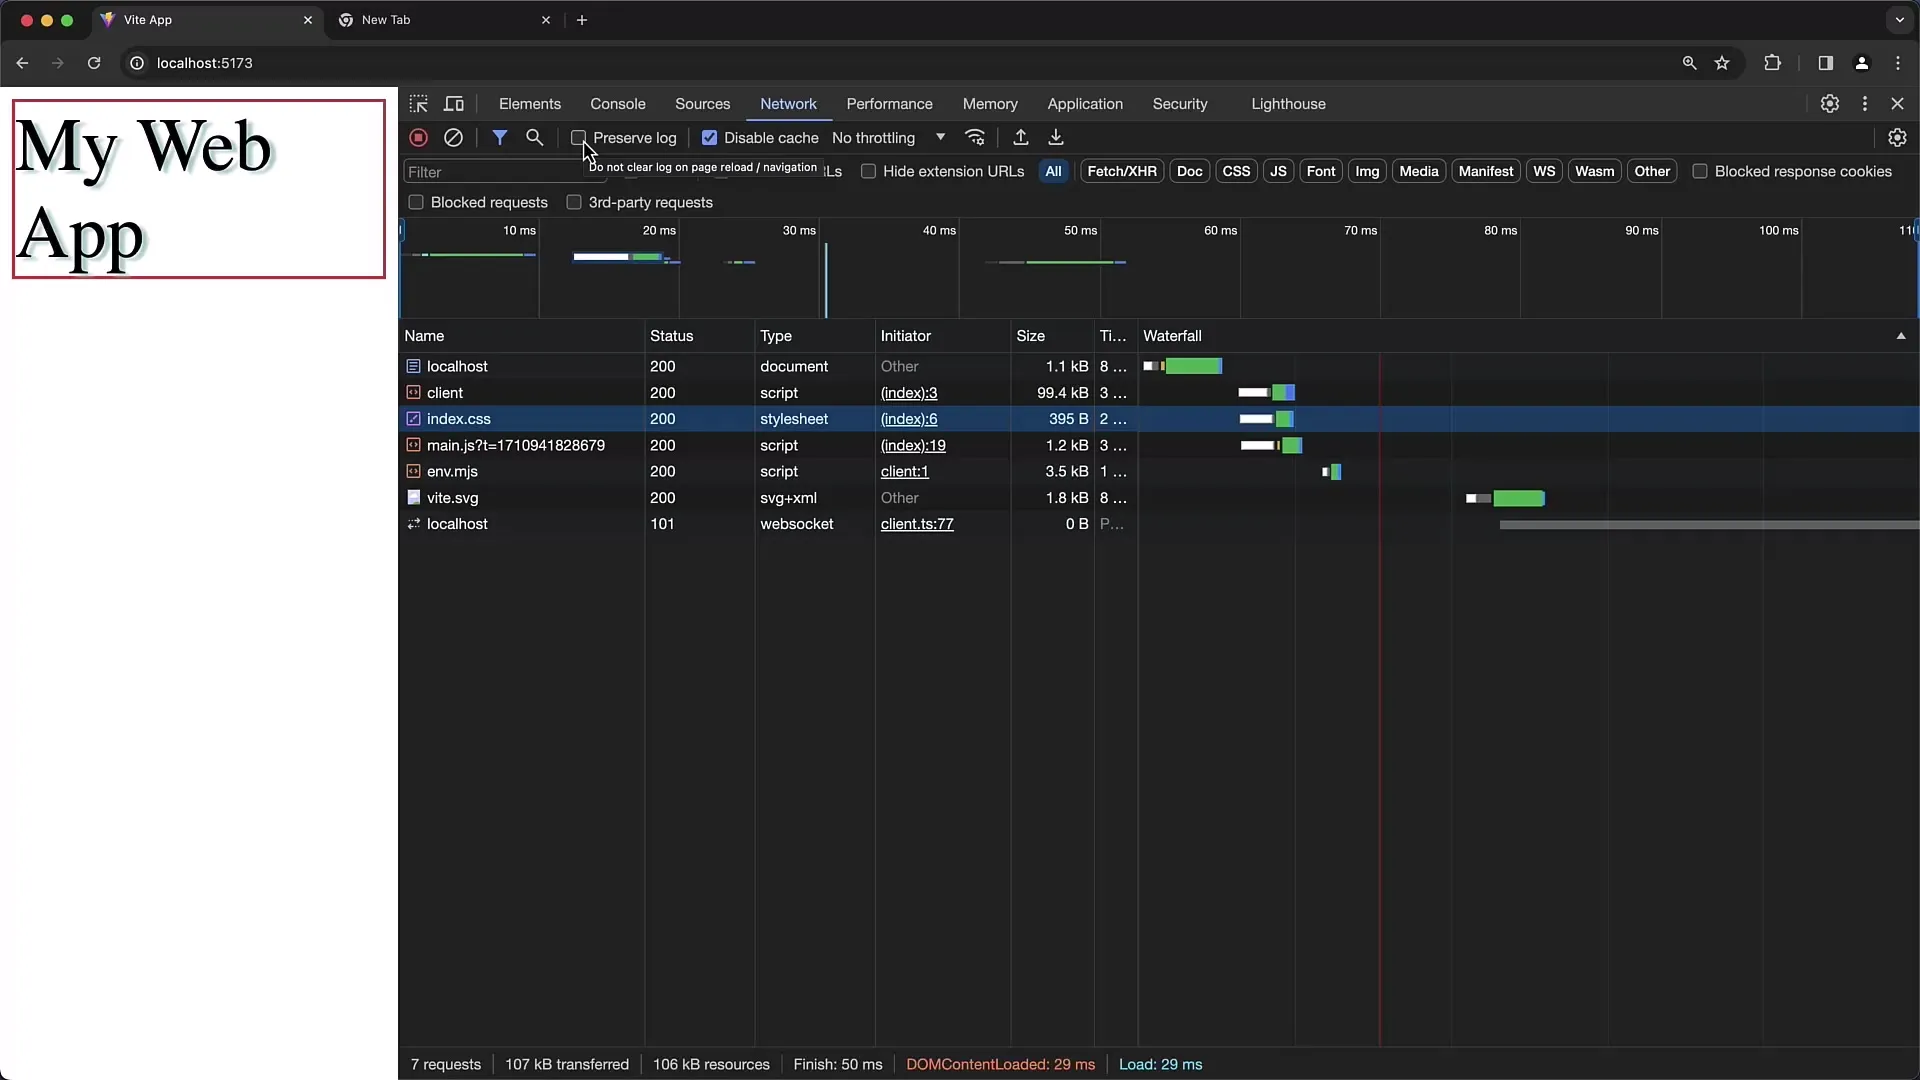
If you close the DevTools and reload the page, no new requests will be recorded until you reopen the DevTools. Therefore, it is important to start the Developer Tools beforehand to get complete data.
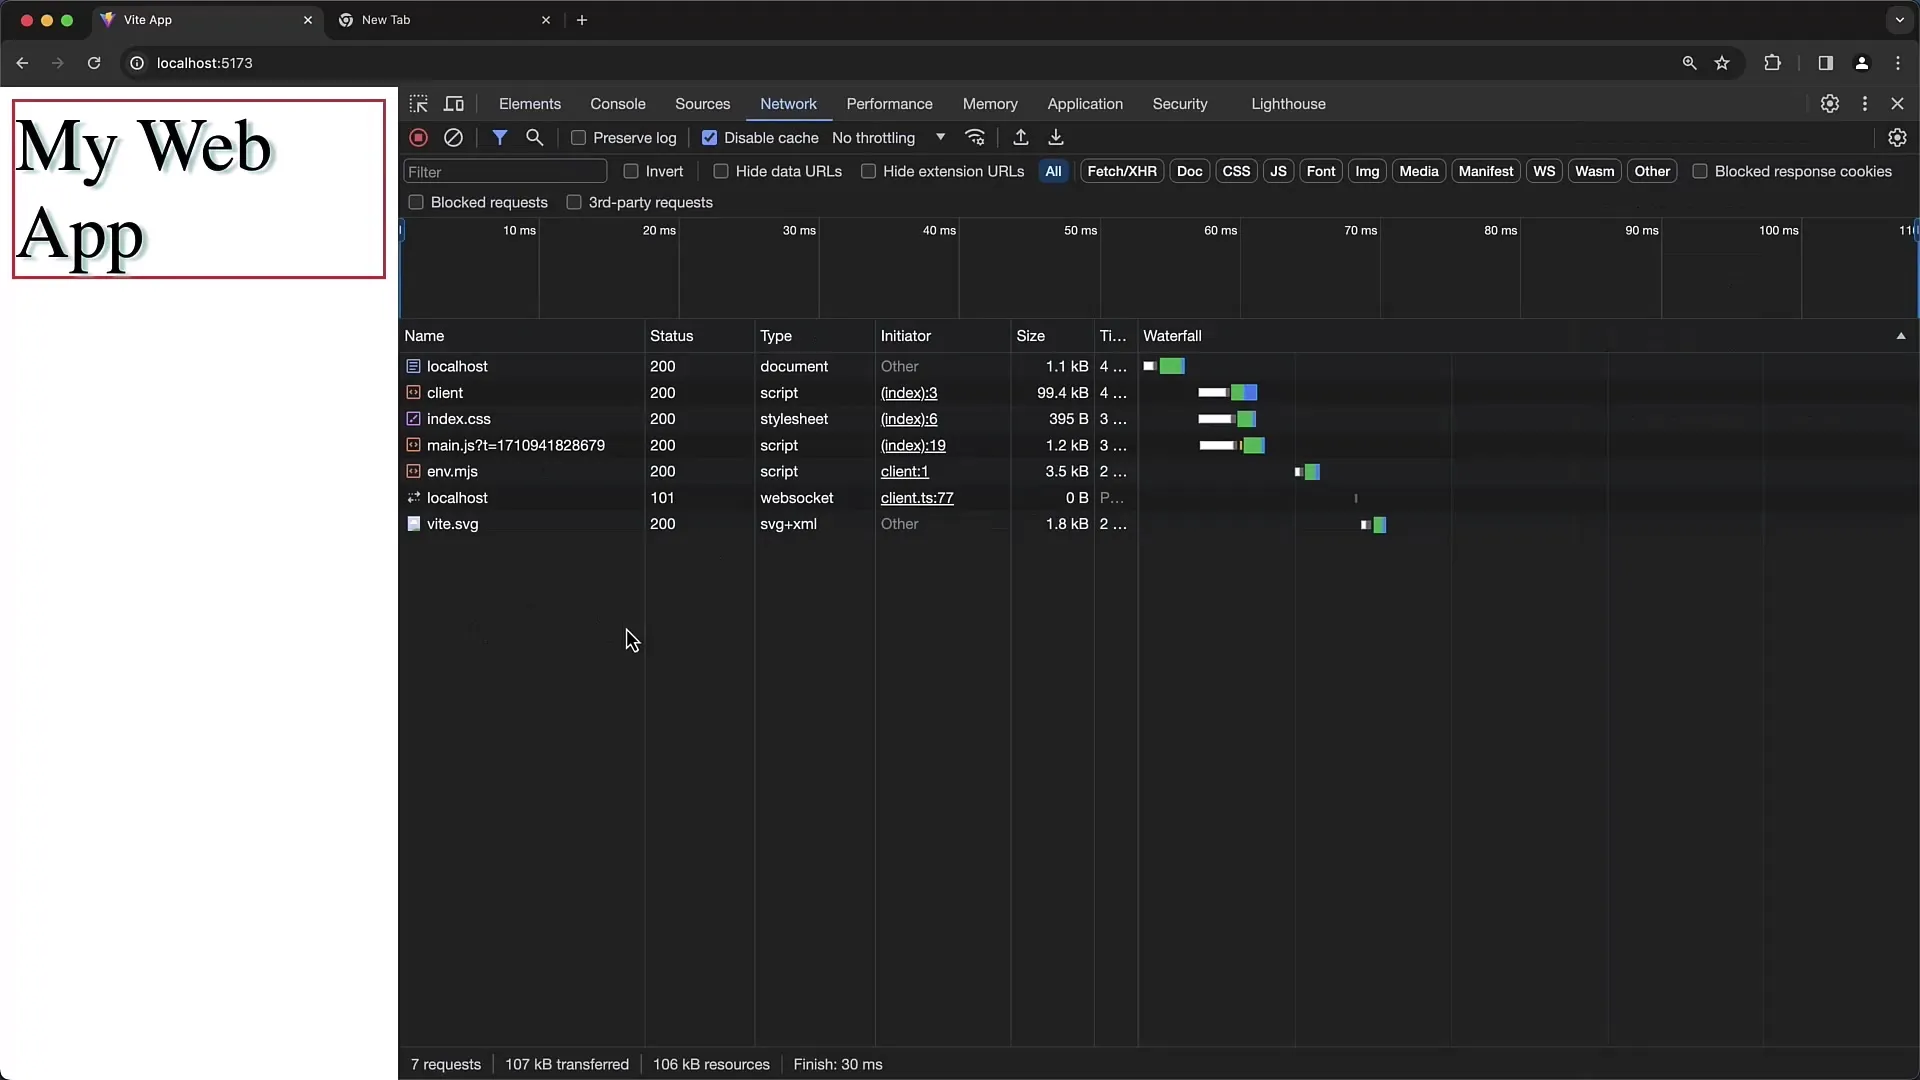
Chapter by chapter, you have now gained insight into the features of Chrome's Network tool. These capabilities are crucial to deepen your understanding on the network communication between client and server.
Summary
In this tutorial, you have learned how to use Chrome's Developer Tools to analyze network requests. You can monitor data in real-time, identify issues, and improve the performance of your websites. The Network tab provides valuable insights into interactions between your browser and the server, crucial for optimization and troubleshooting.
Frequently Asked Questions
How can I disable the cache in the Network tab?Activate the "Disable Cache" checkbox in the Network tab of Chrome Developer Tools.
How do I see the loading times of individual requests?In the waterfall diagram, you can see the start and end times of each request.
Can I filter my requests?Yes, use the filter field at the top of the Network tab to search for specific files.
What does the "Preserve Log" option do?It allows you to keep network requests when switching between pages.
How do I analyze WebSocket connections?Click on the WebSocket request in the Network tab to view history and messages.


