In this guide, you will learn how to throttle network connections, analyze HTTP headers, and preview responses with Chrome Developer Tools. These features are especially useful for testing your website's performance under different network conditions and understanding the structure of returned data. Throttling network connections allows you to simulate the user experience on mobile devices, while analyzing headers provides insights into potential issues.
Key Insights
- Throttling allows you to simulate slow network speeds to test user behavior under these conditions.
- HTTP headers provide information on how data is returned to the client.
- The preview feature in the Developer Tools allows you to easily inspect the structure of JSON data and other formats.
Step-by-Step Guide
Throttling Network Speed
To simulate slow network connections, open Chrome Developer Tools and navigate to the Network tab. There, you can choose different speeds, such as "fast 3G." This allows you to test the loading times of your website under realistic conditions.
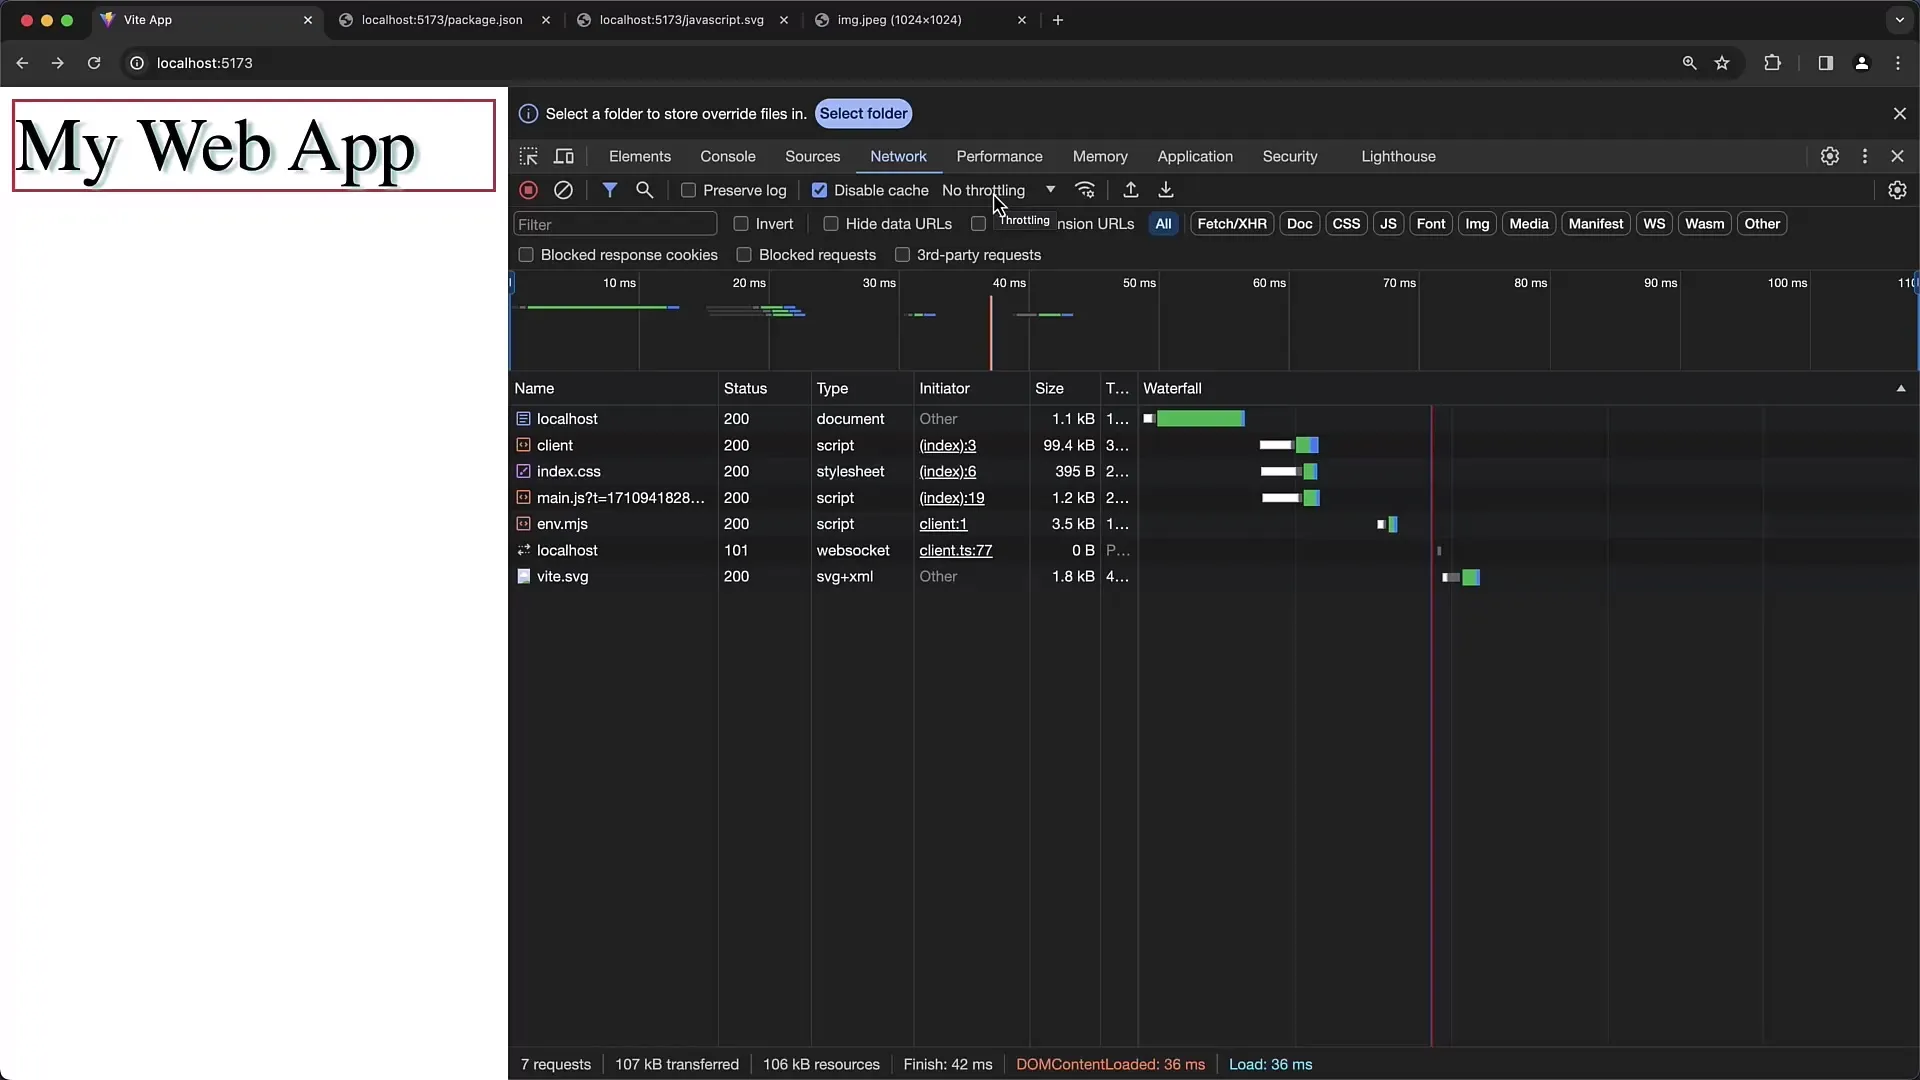
By reloading the page, you can immediately see how the performance looks at this setting. Note that the loading times are significantly slower than under normal conditions.

If you want it even slower, you can choose the "slow 3G" option. Patience is required here, as it noticeably takes longer for the content to load.
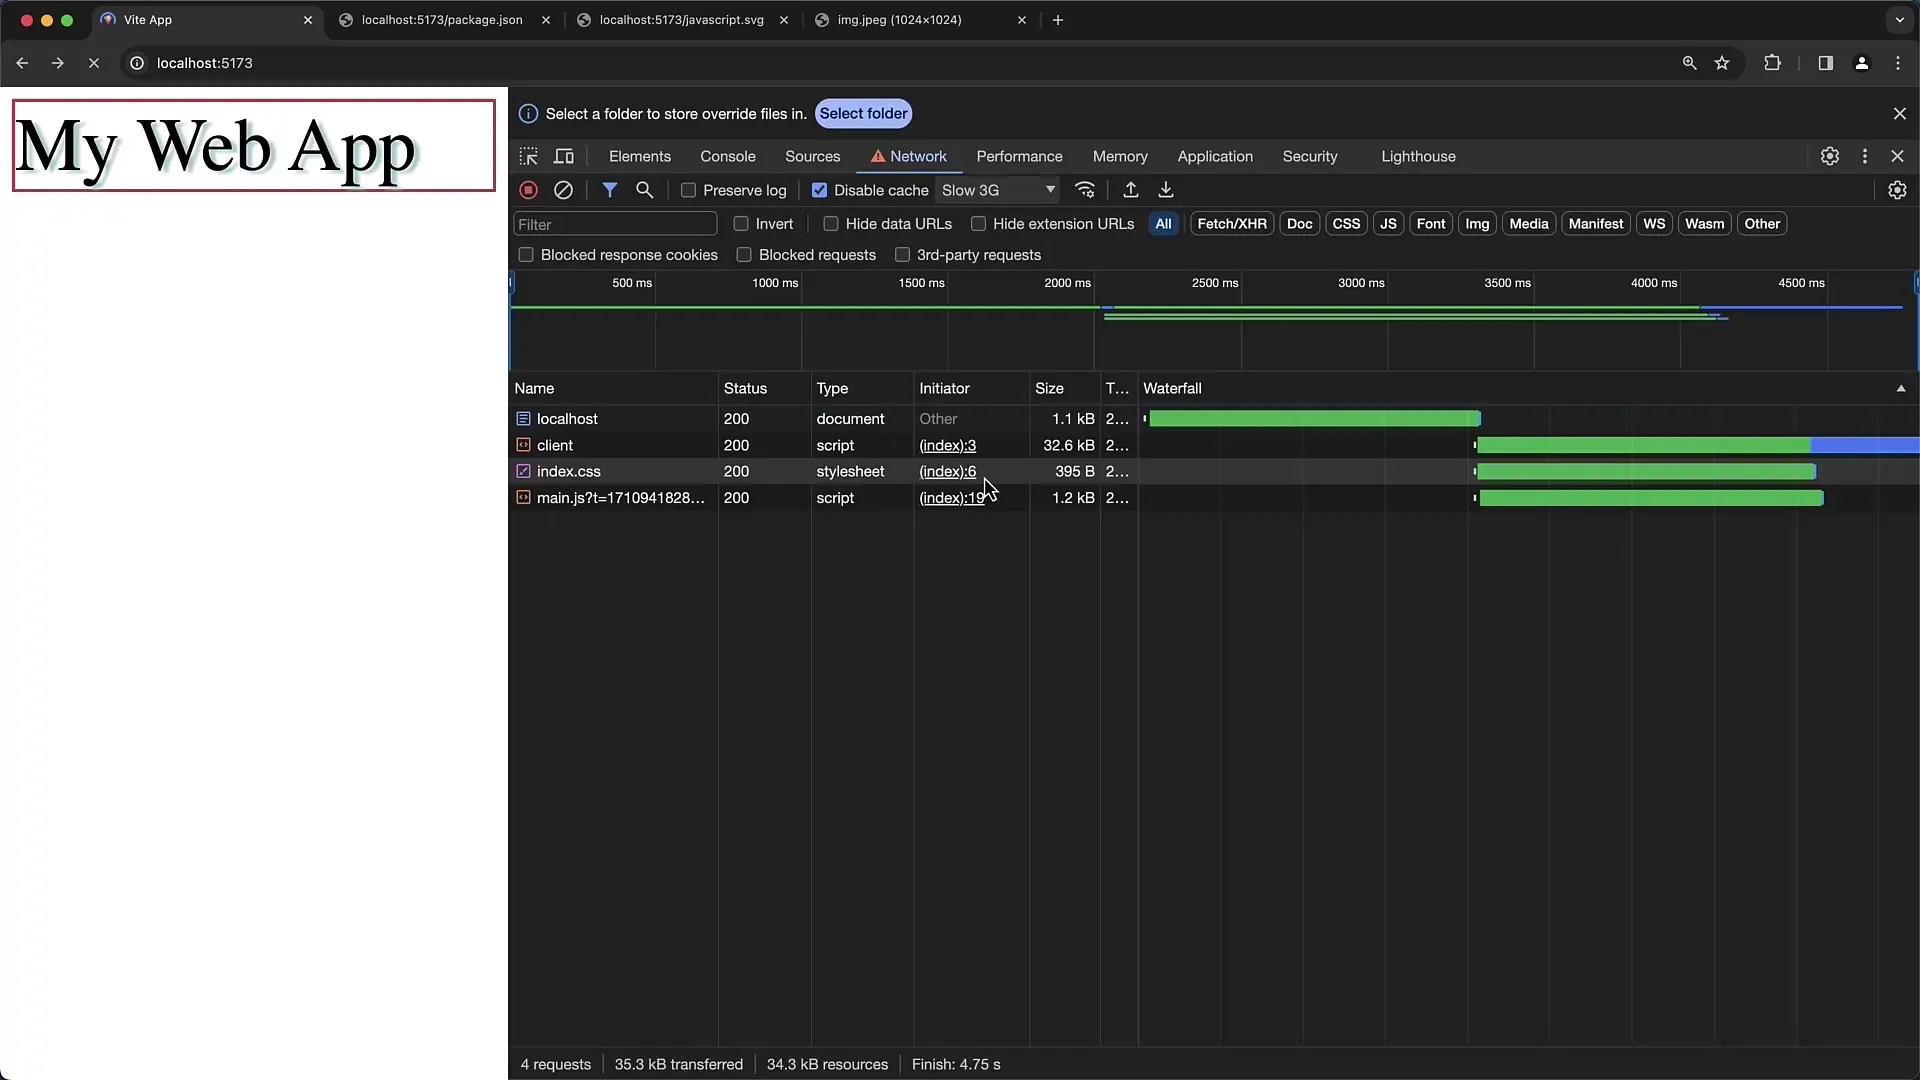
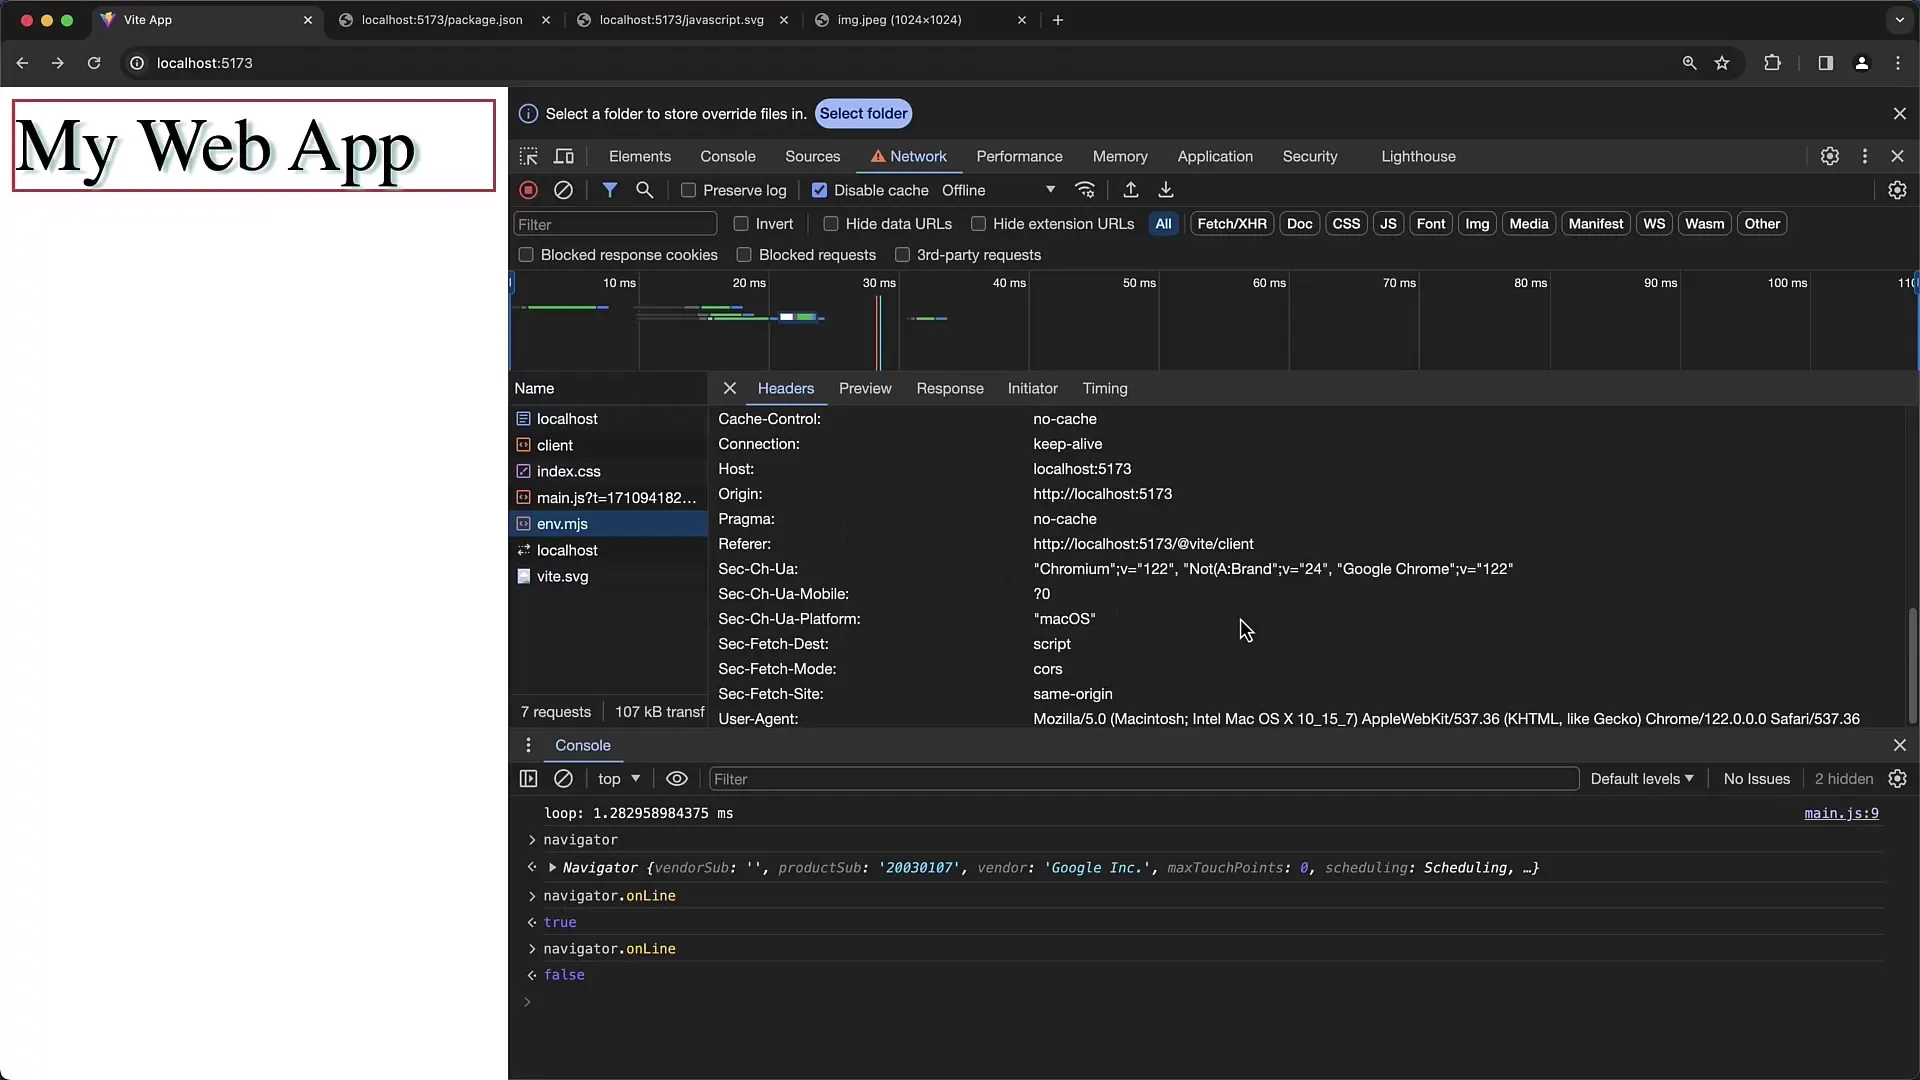
In addition, you can activate the "offline" function. This option is particularly interesting to test how your web application functions when there is no internet connection available.
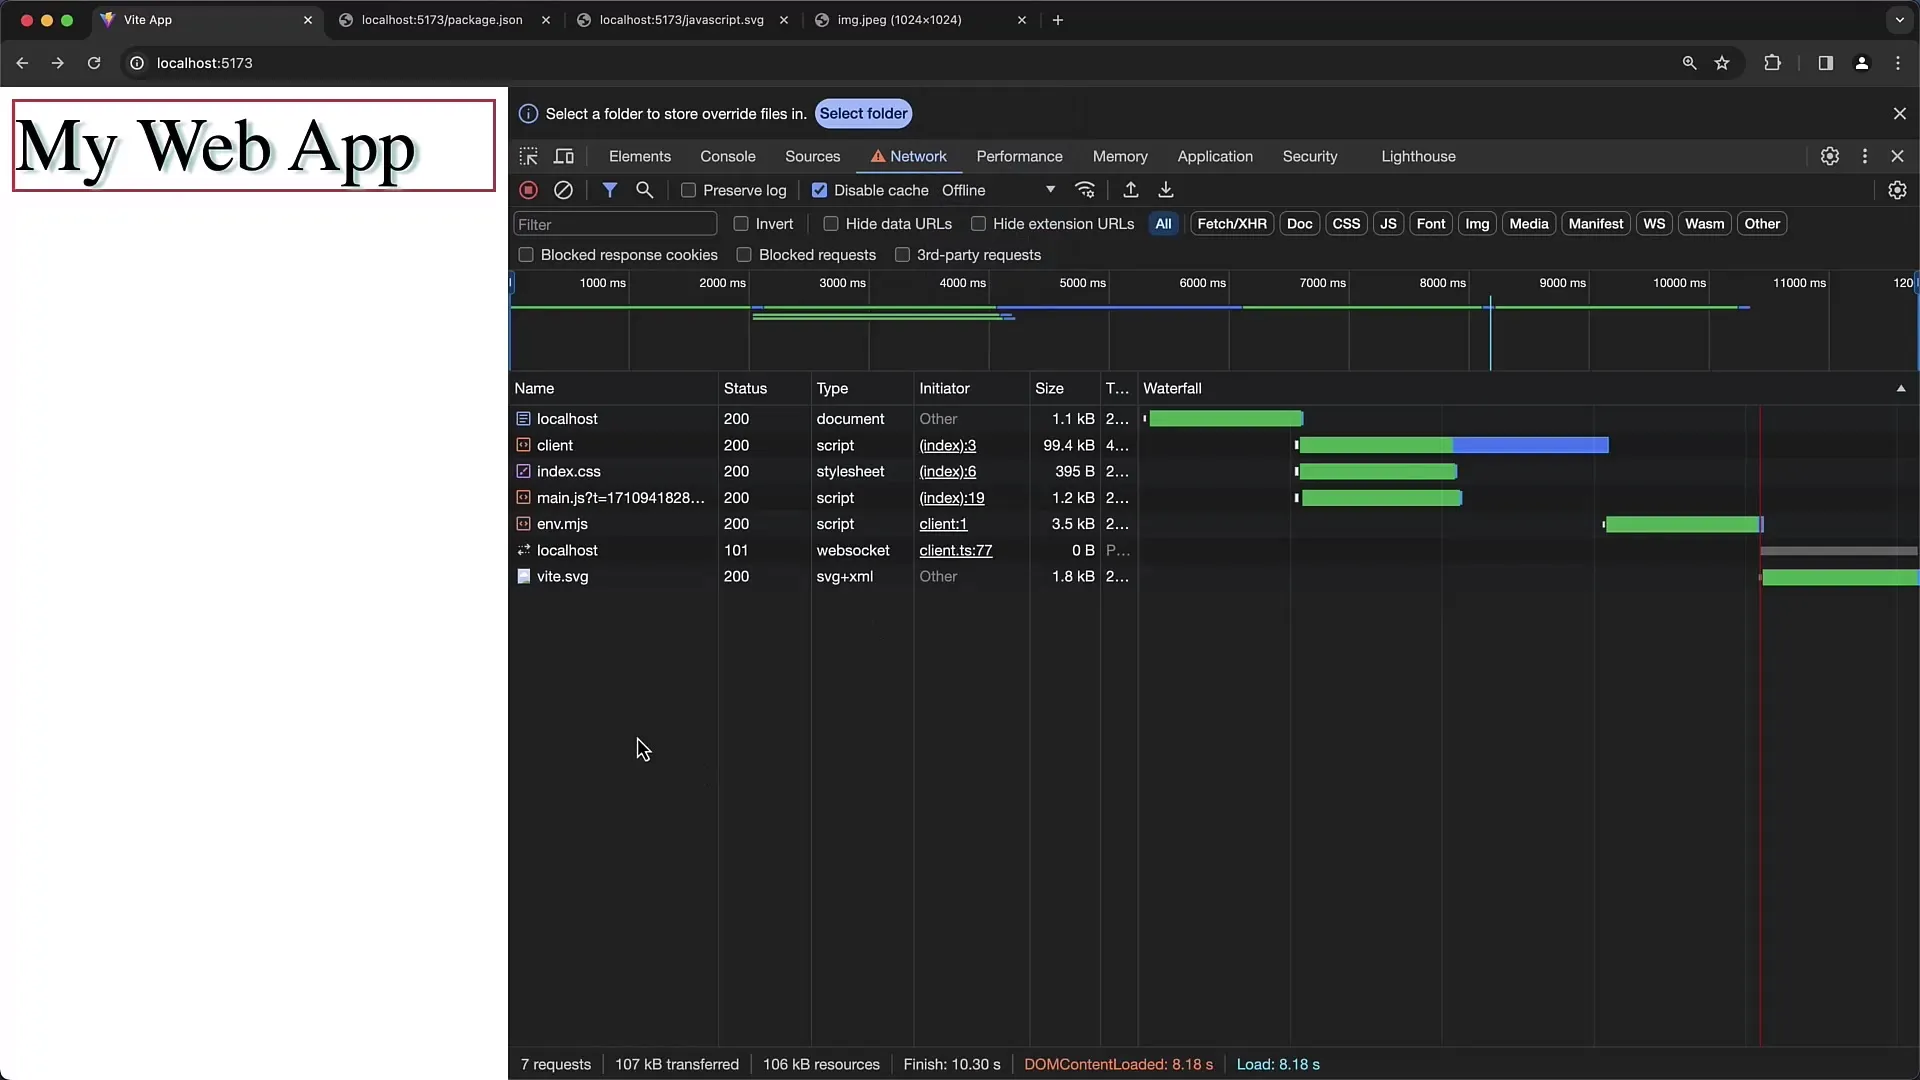
Offline Testing with Service Workers
Service workers allow websites to be available offline. If you have a page that should work offline, you can verify whether the corresponding contents are also accessible offline by activating the Offline function in the Developer Tools.

You can also check whether navigation is offline or online by looking in the "Navigator" window. This is important to ensure that your application is usable even without an internet connection.
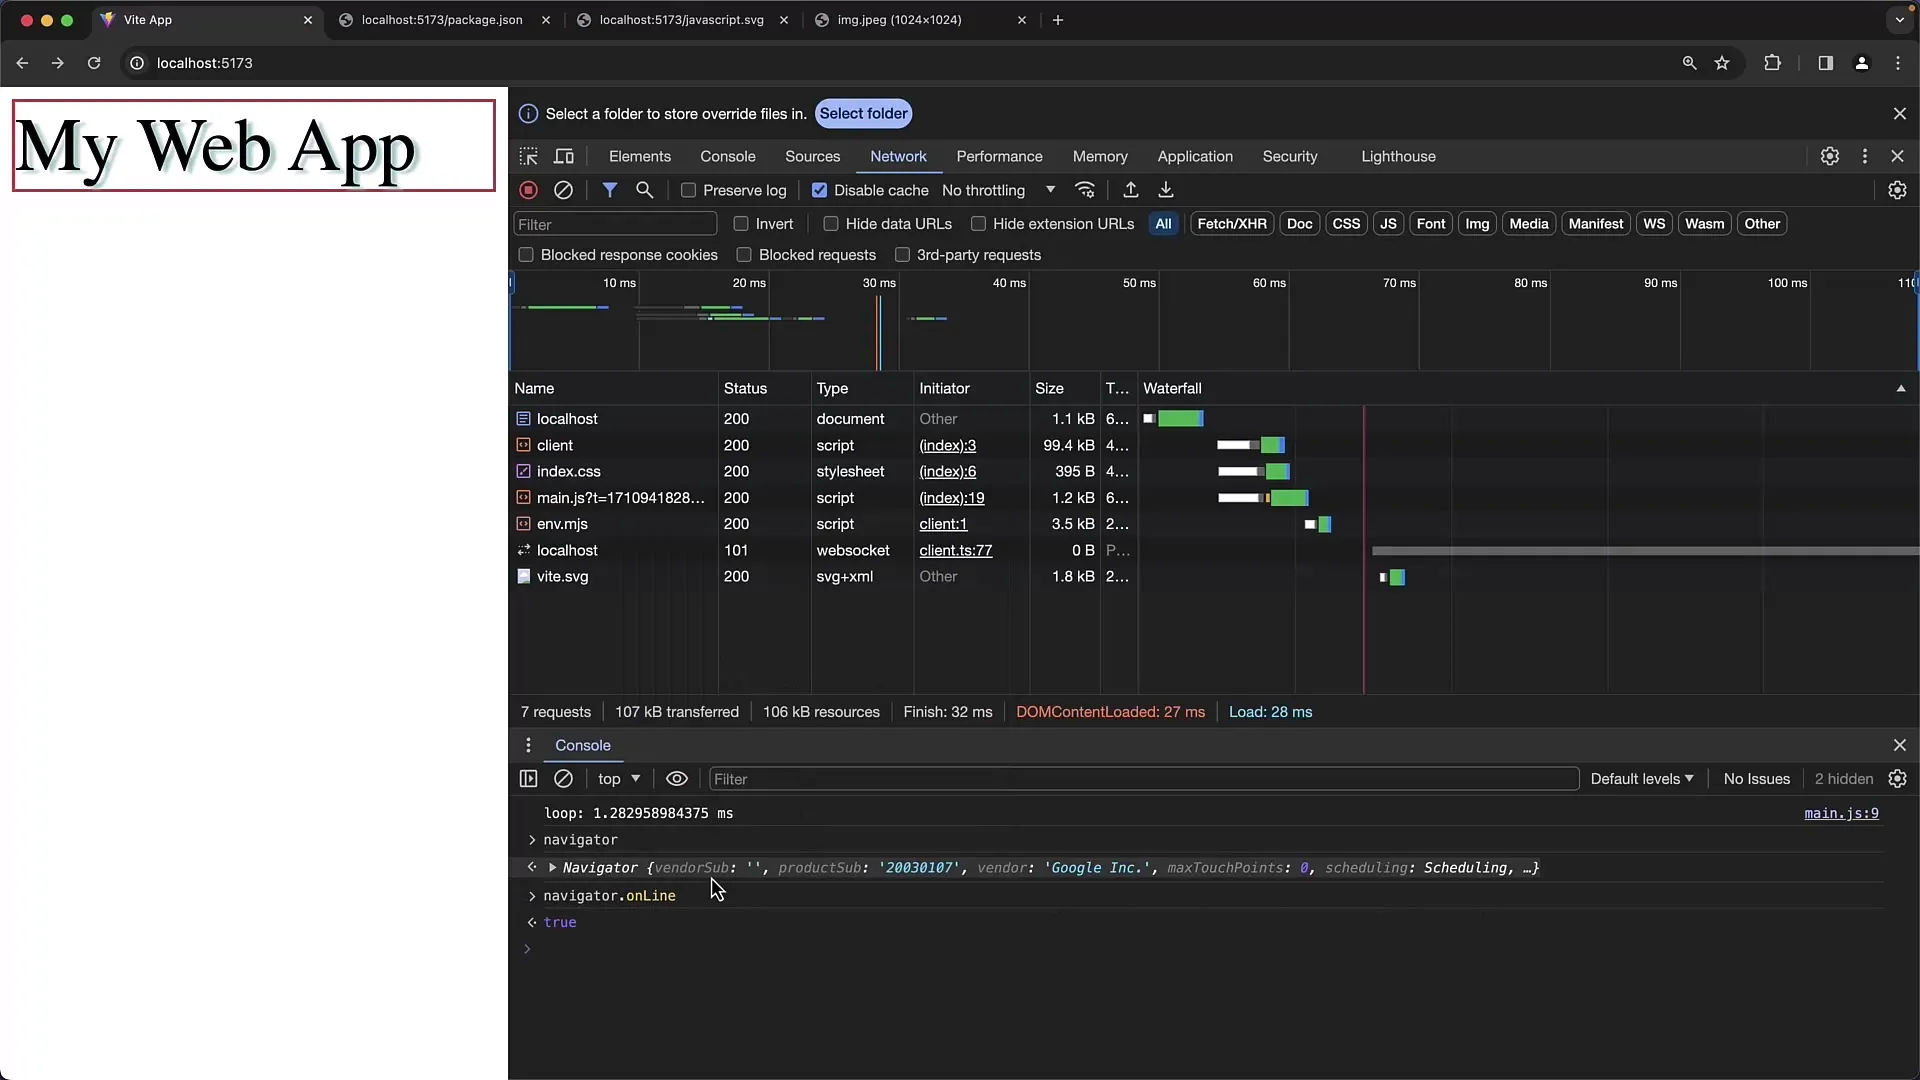
Handling Headers
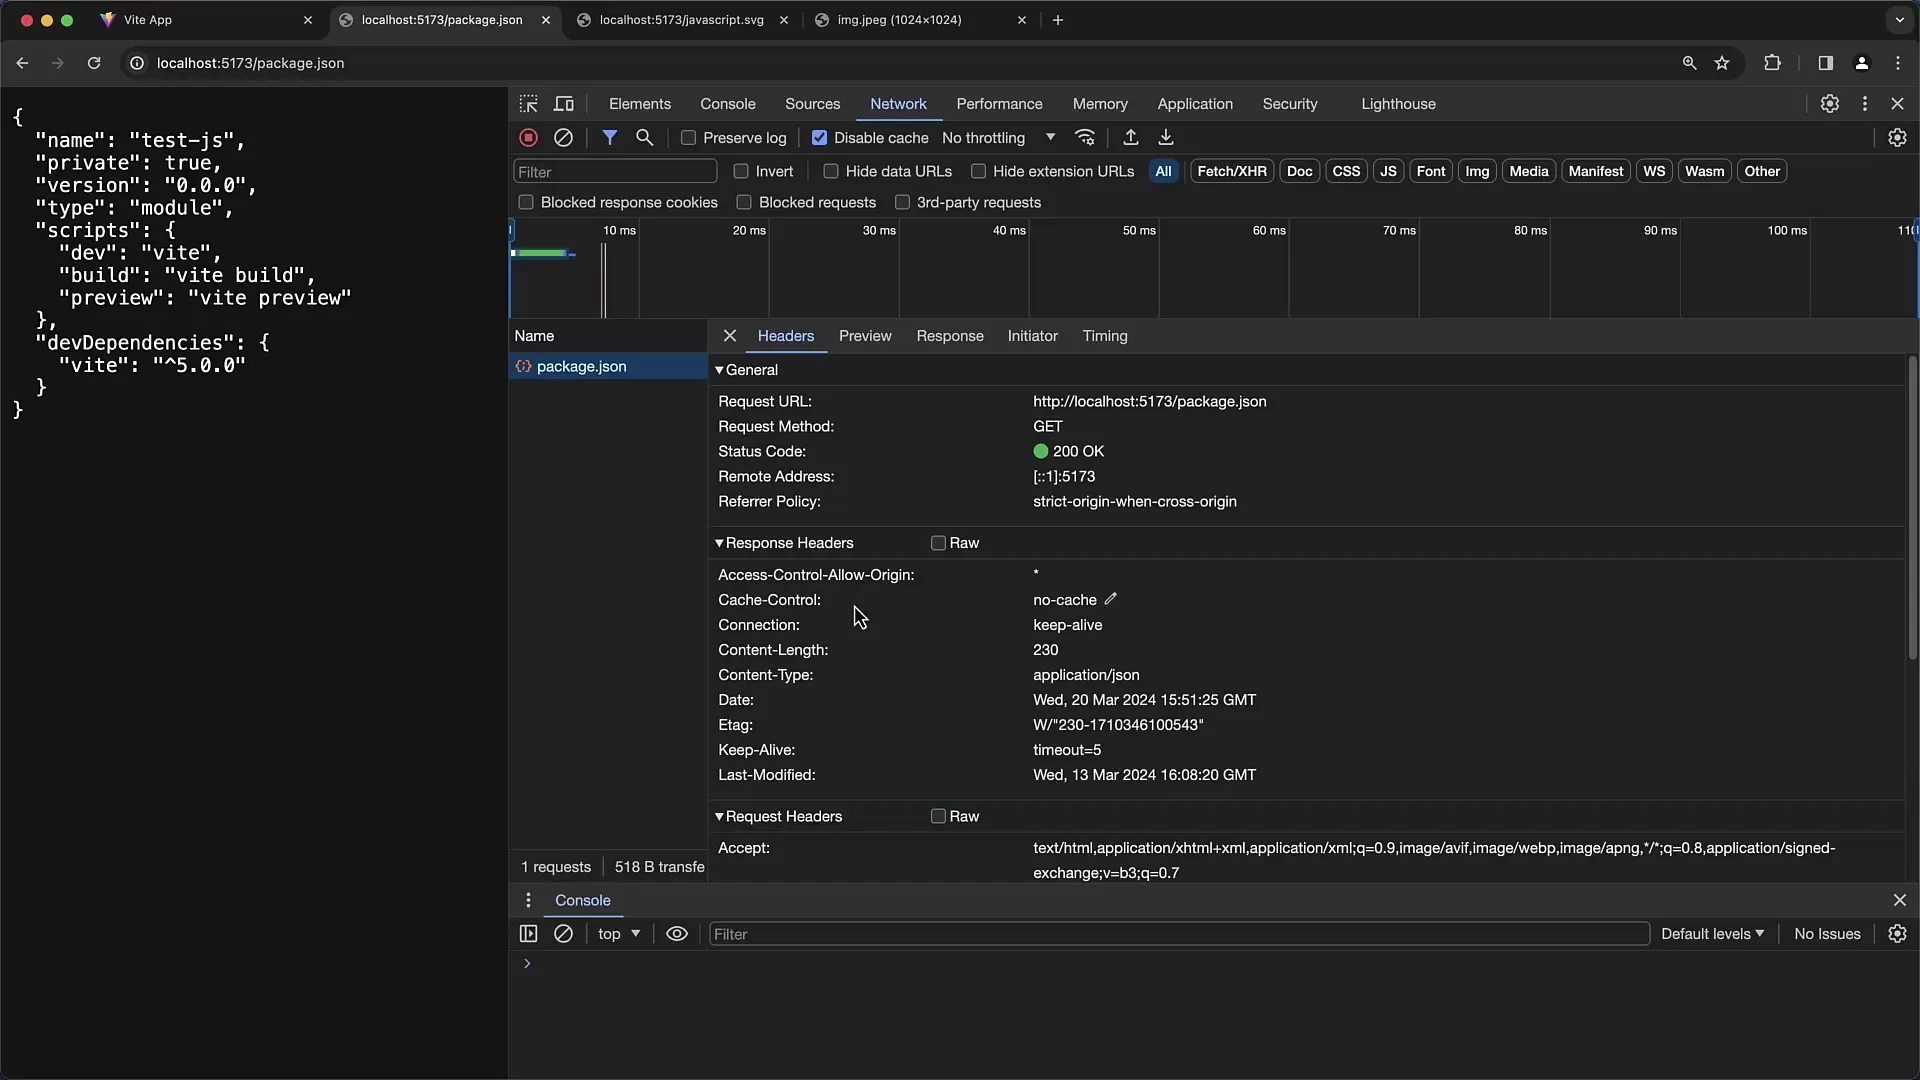
To inspect the HTTP headers, reload your website and look at the returned data. Under the Network tab, you can see details about the Response Headers, such as Content-Type and Content-Length.
Here you will also find information on whether caching is enabled for the respective file or not. This is important for optimizing the performance of your site.
Viewing JSON Data Structure
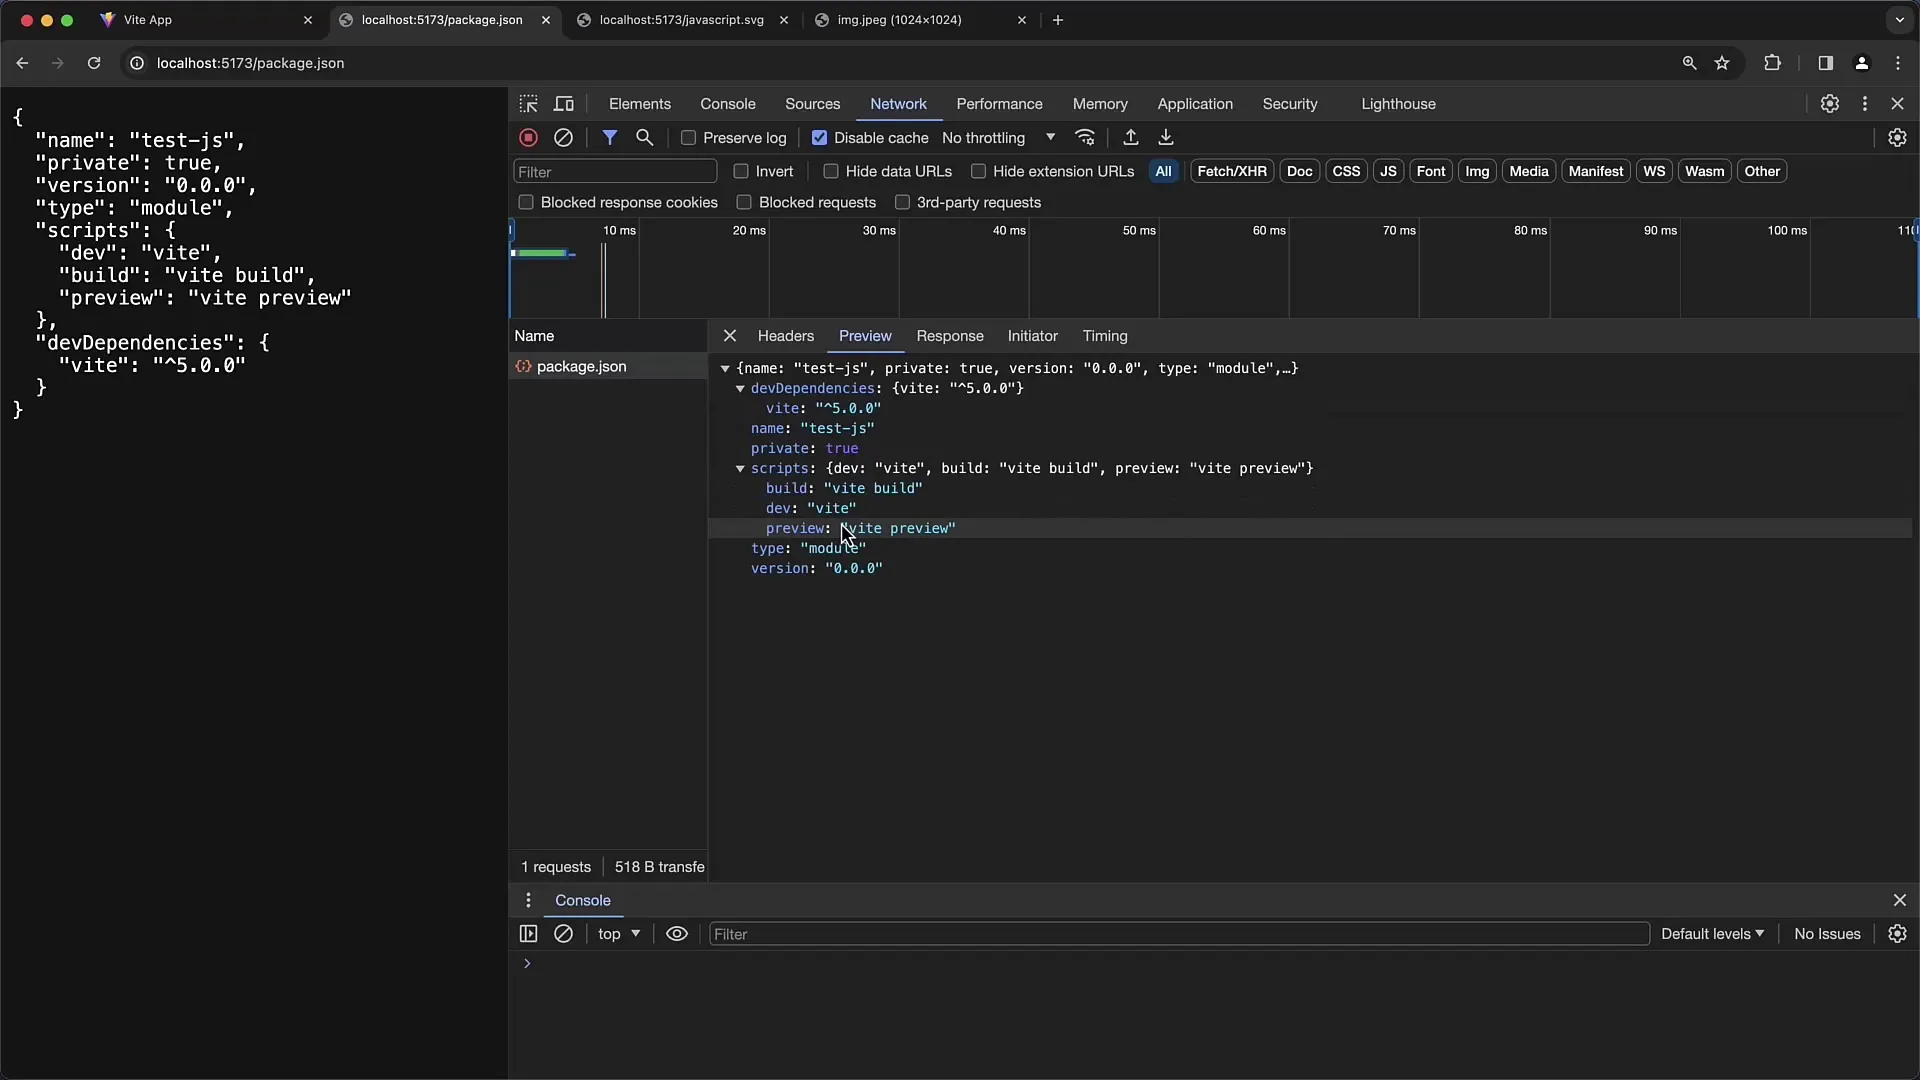
If you receive JSON data, you can easily check the preview of this data. In the Developer menu, you can expand and inspect the structure of the data. This way, you will see the data not only in raw text but also highlighted in color, improving readability.
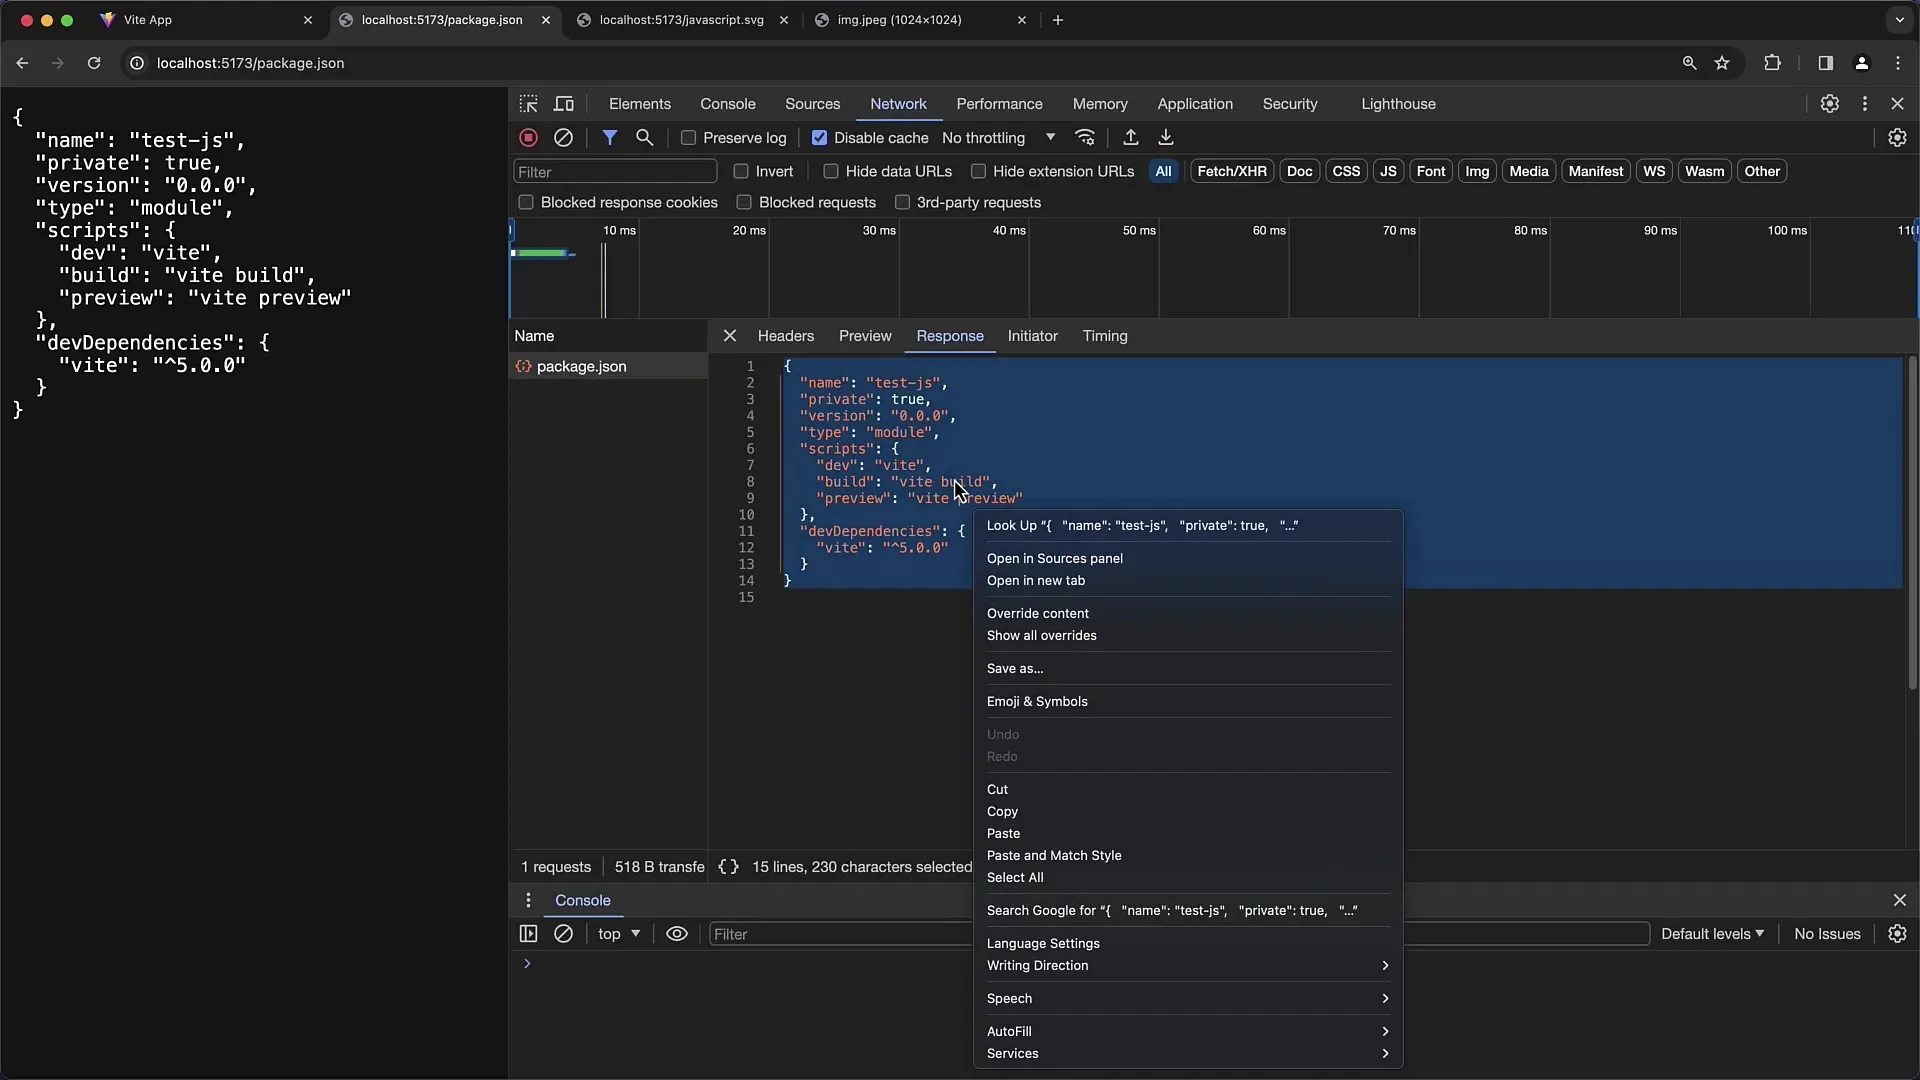
A major advantage of the preview is that you can easily copy the data to reuse it, for example, in your code editor.
Handling Images
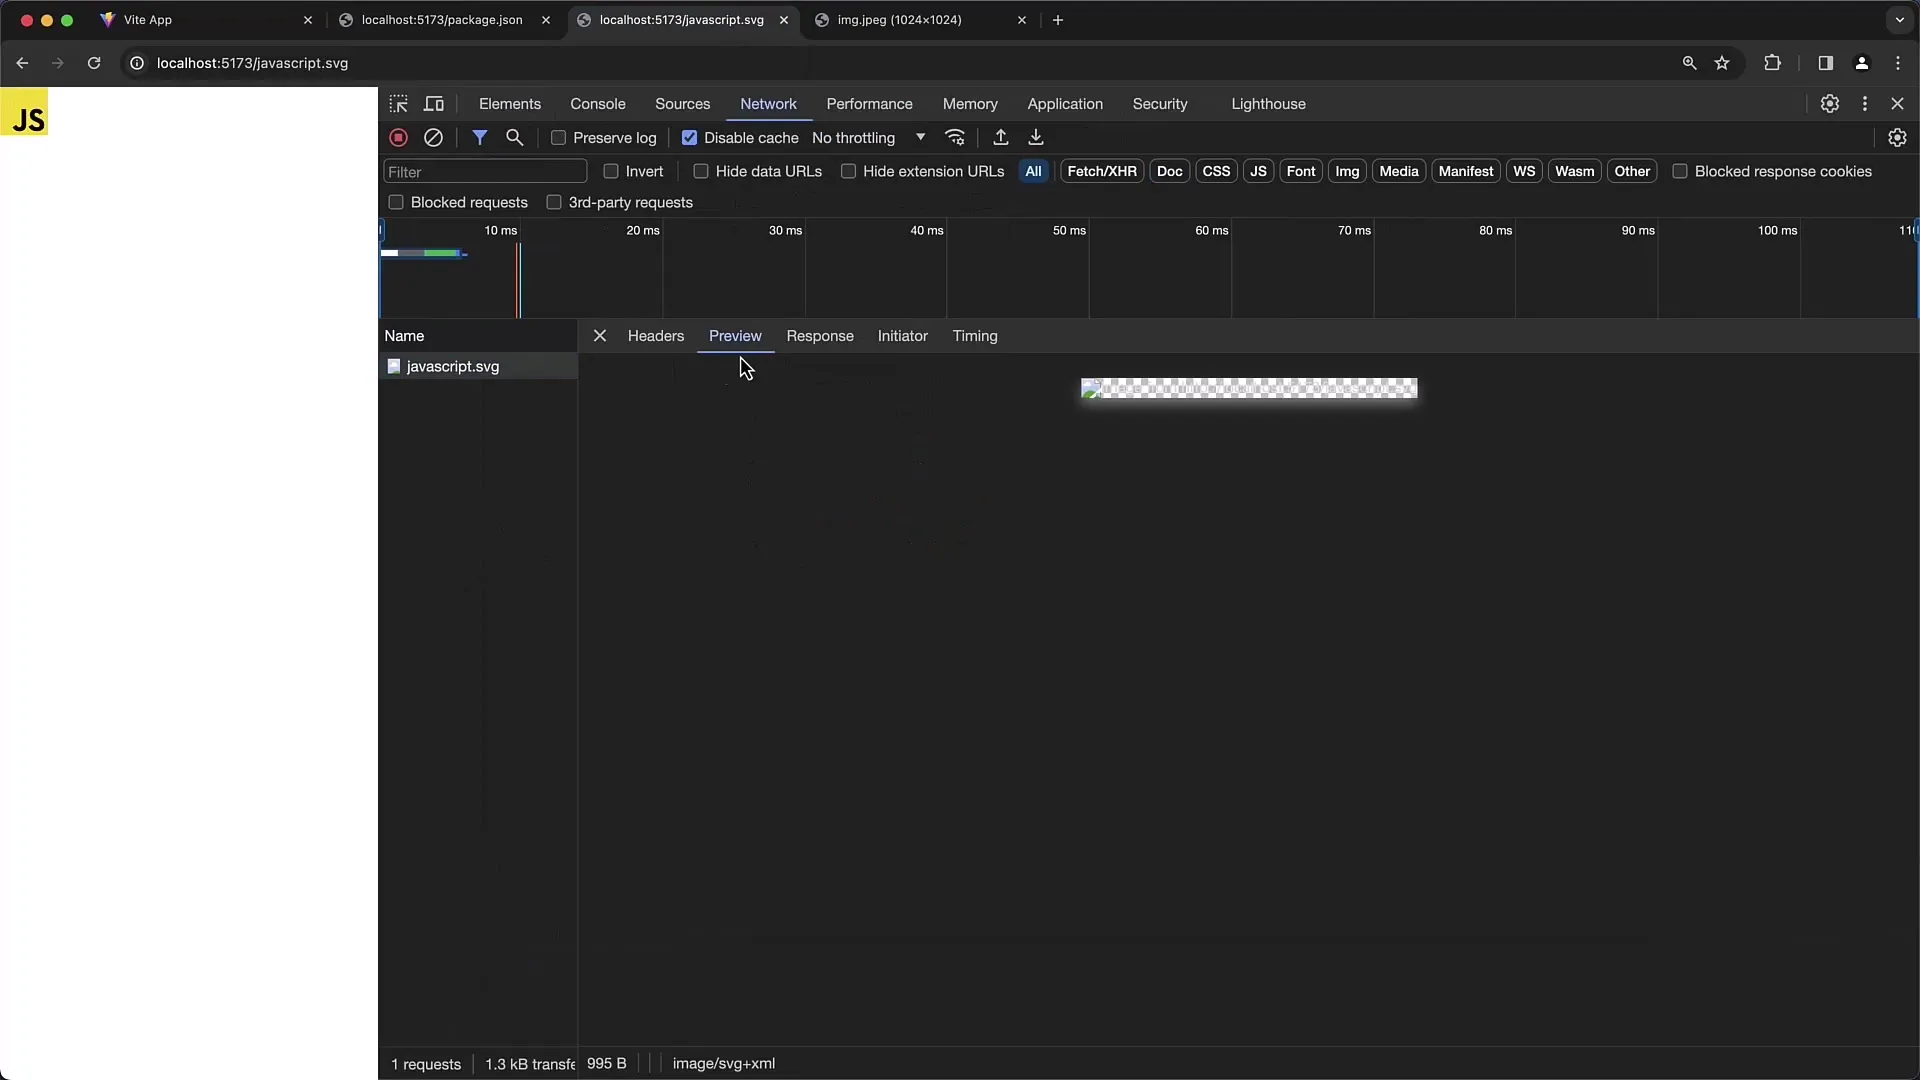
Accessing image data is also possible through the Developer Tools. For example, when viewing SVG files, you can see them under the "Preview" tab.
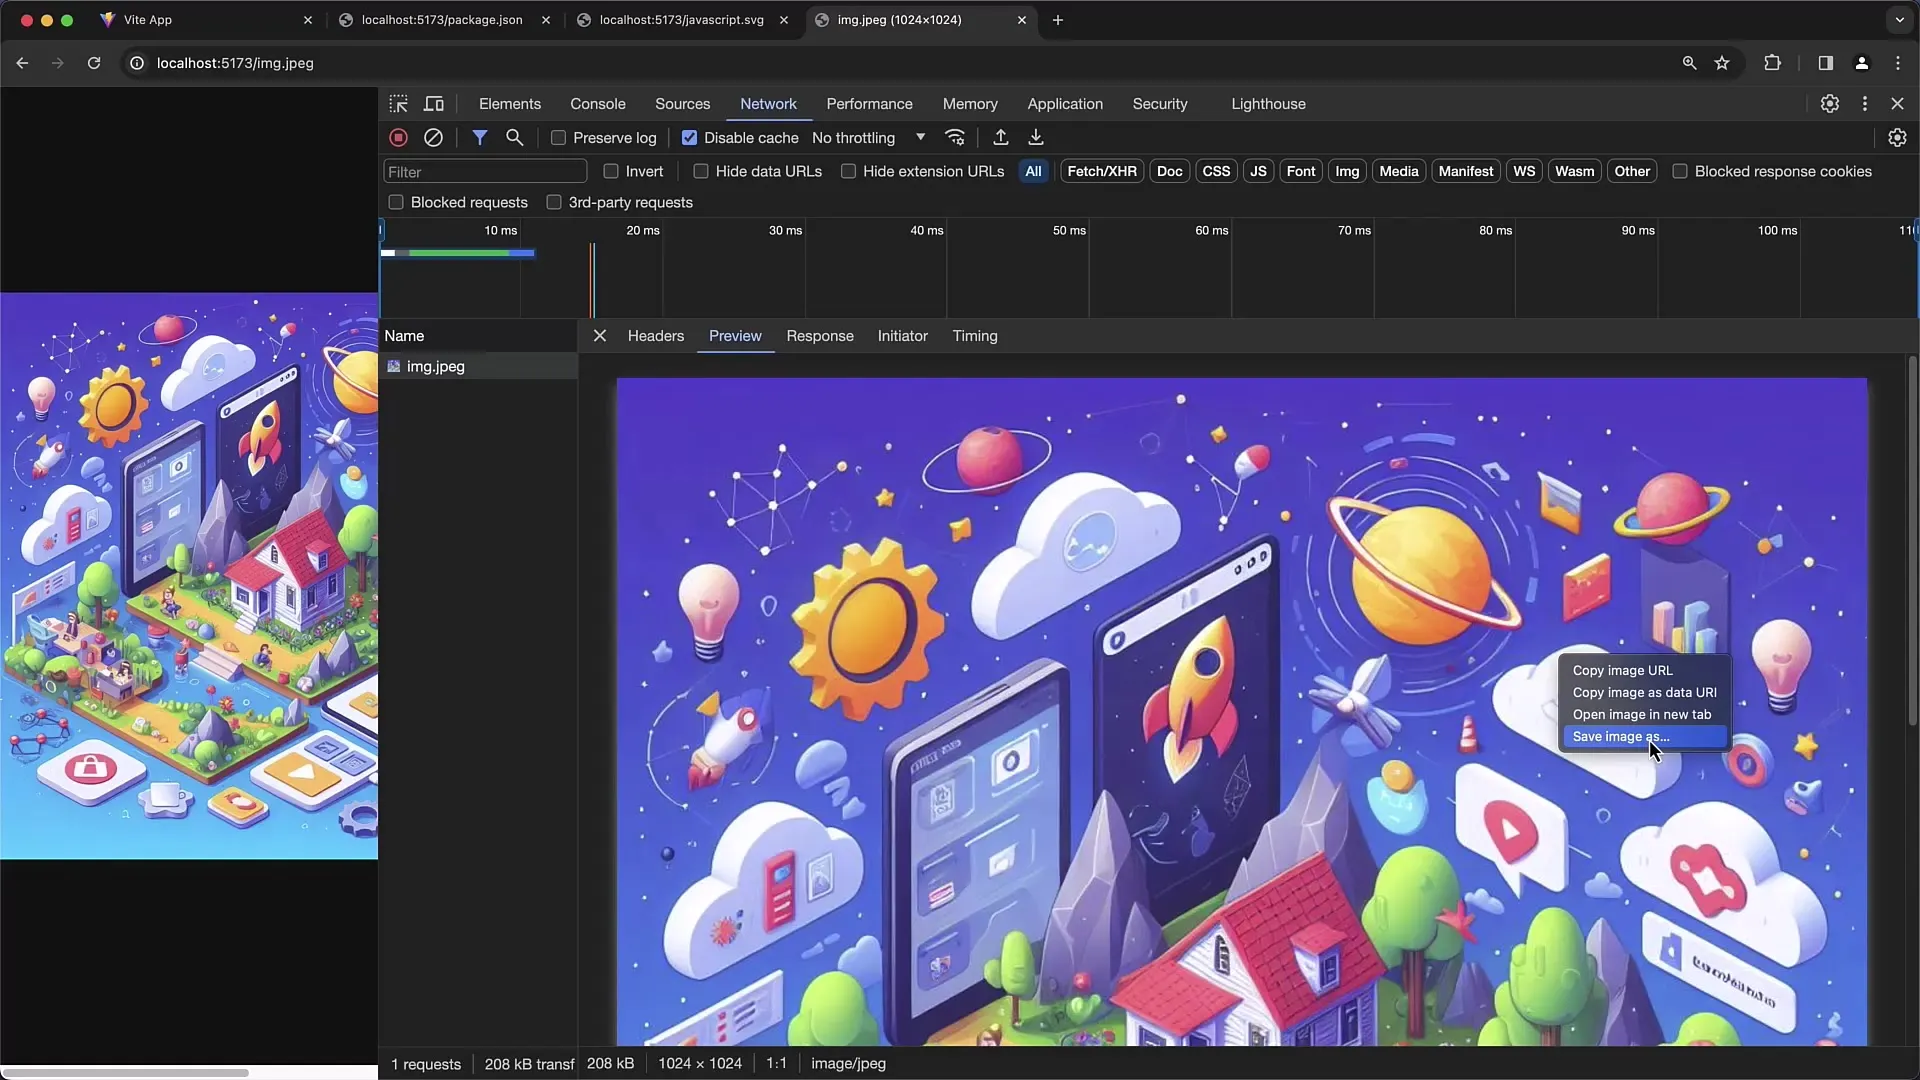
For other formats like PNG or JPEG, you can use the options "Copy Image URL" or "Save Image as" to save the images locally or simply copy URLs.
Identifying Issues
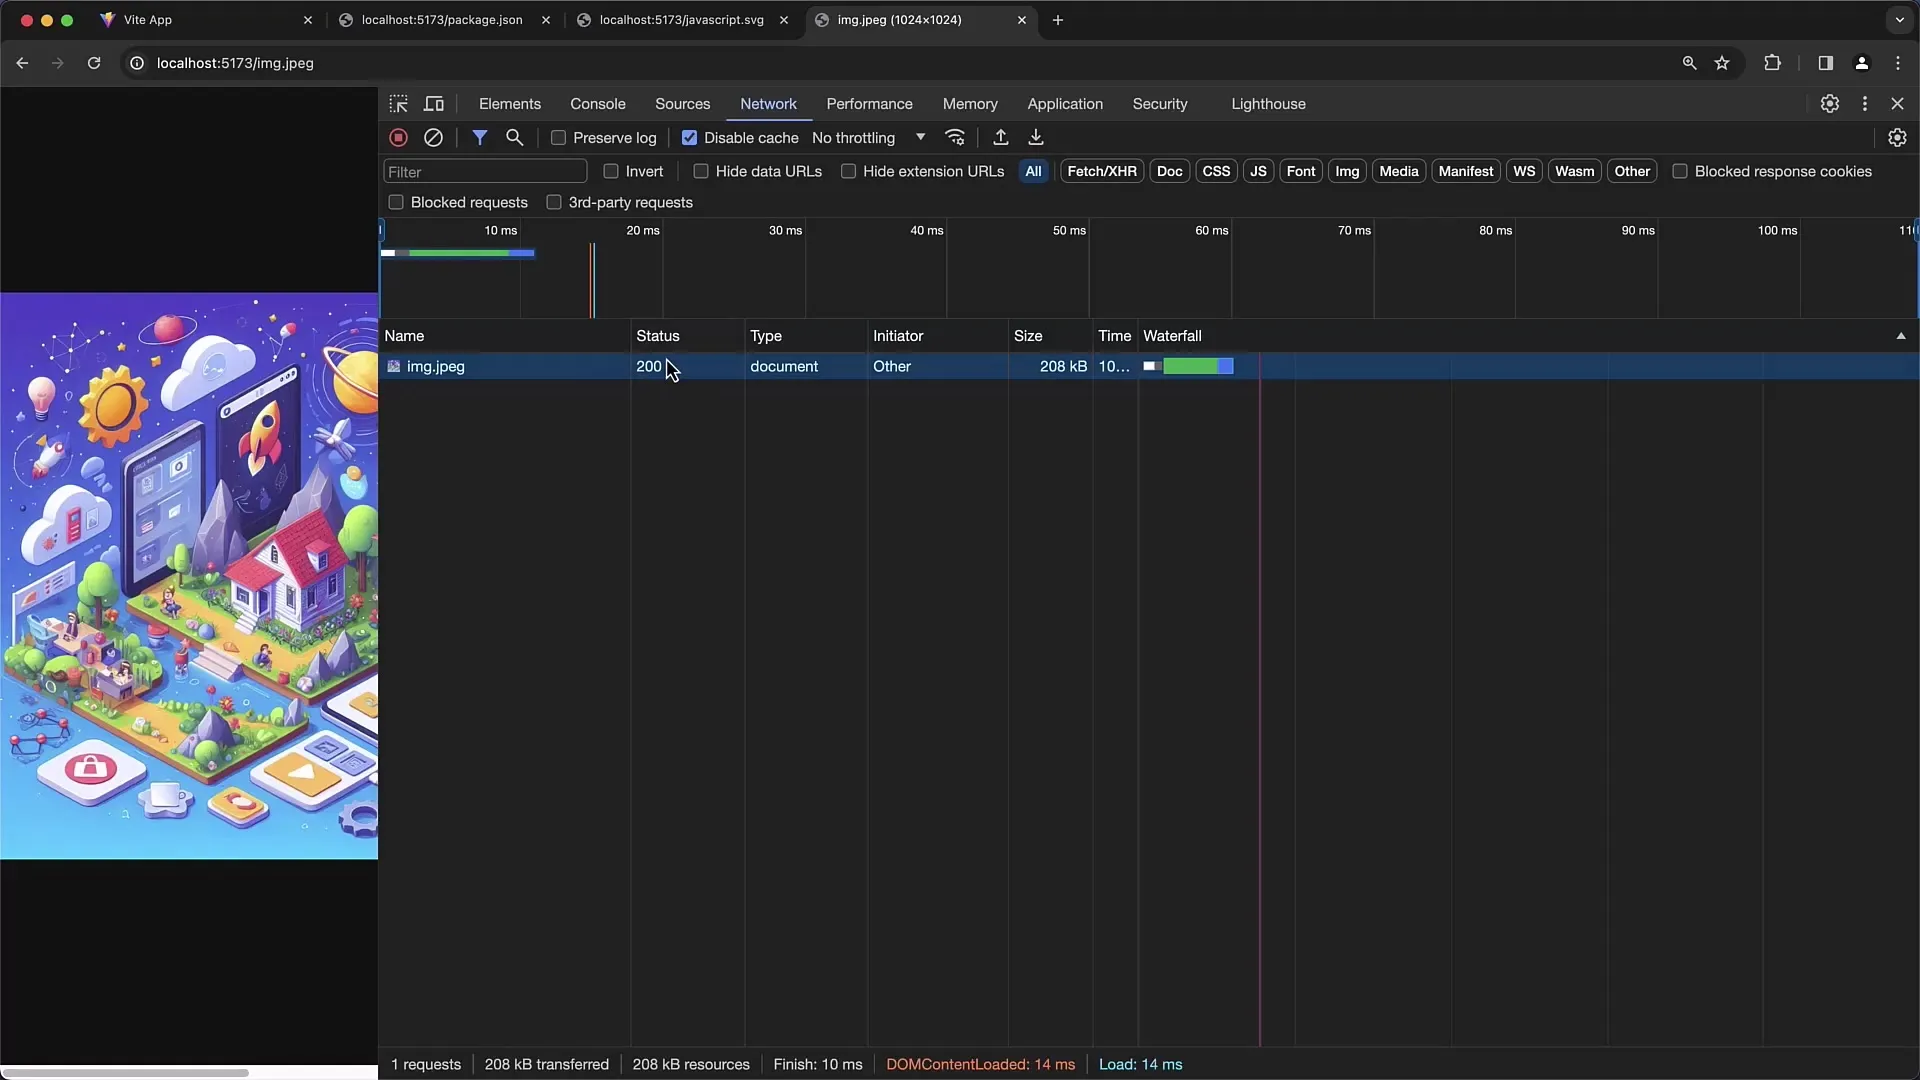
A particularly useful feature of the Developer Tools is the ability to analyze status codes. If a status above 400 is returned, this is an indication of a problem that you should investigate further.
Refer to the request headers to identify possible sources of errors, whether it be an authentication error or other issues that occurred while loading the page.
Summary
In this guide, you have learned how to throttle network speed, analyze HTTP headers, and make better use of preview information. With these tools, you can further optimize the user experience on your website and identify potential sources of errors.
Frequently Asked Questions
What is throttling in Chrome Developer Tools?Throttling allows you to simulate network speed to test how your website performs under different conditions.
How can I view HTTP headers in Developer Tools?Through the Network tab, you can inspect the returned HTTP headers after loading your website.
Can I also test offline?Yes, you can activate the offline feature to check if your website works even without an internet connection.
How can I analyze JSON data in Developer Tools?With the preview feature, you can view the structure of JSON data and selectively expand subobjects.
What should I do if a status code above 400 is returned?Check the request header to identify the cause of the error and ensure all required information is present.


