In this guide, I will show you how to use the Profiler tool in the Chrome Developer Tools to identify and optimize performance bottlenecks in your JavaScript code. Optimized code not only enhances user experience but can also significantly reduce your website's loading times. Once you have gone through this guide, you will be able to analyze your web applications better, identify weaknesses, and take appropriate measures for improvement.
Key Insights
- The Profiler tool is essential for analyzing the performance of web applications.
- You can obtain detailed information about scripting, rendering, and memory consumption.
- By conducting targeted recordings, you can evaluate your application's performance in various usage scenarios.
Step-by-Step Guide
Step 1: Accessing the Profiler Tool
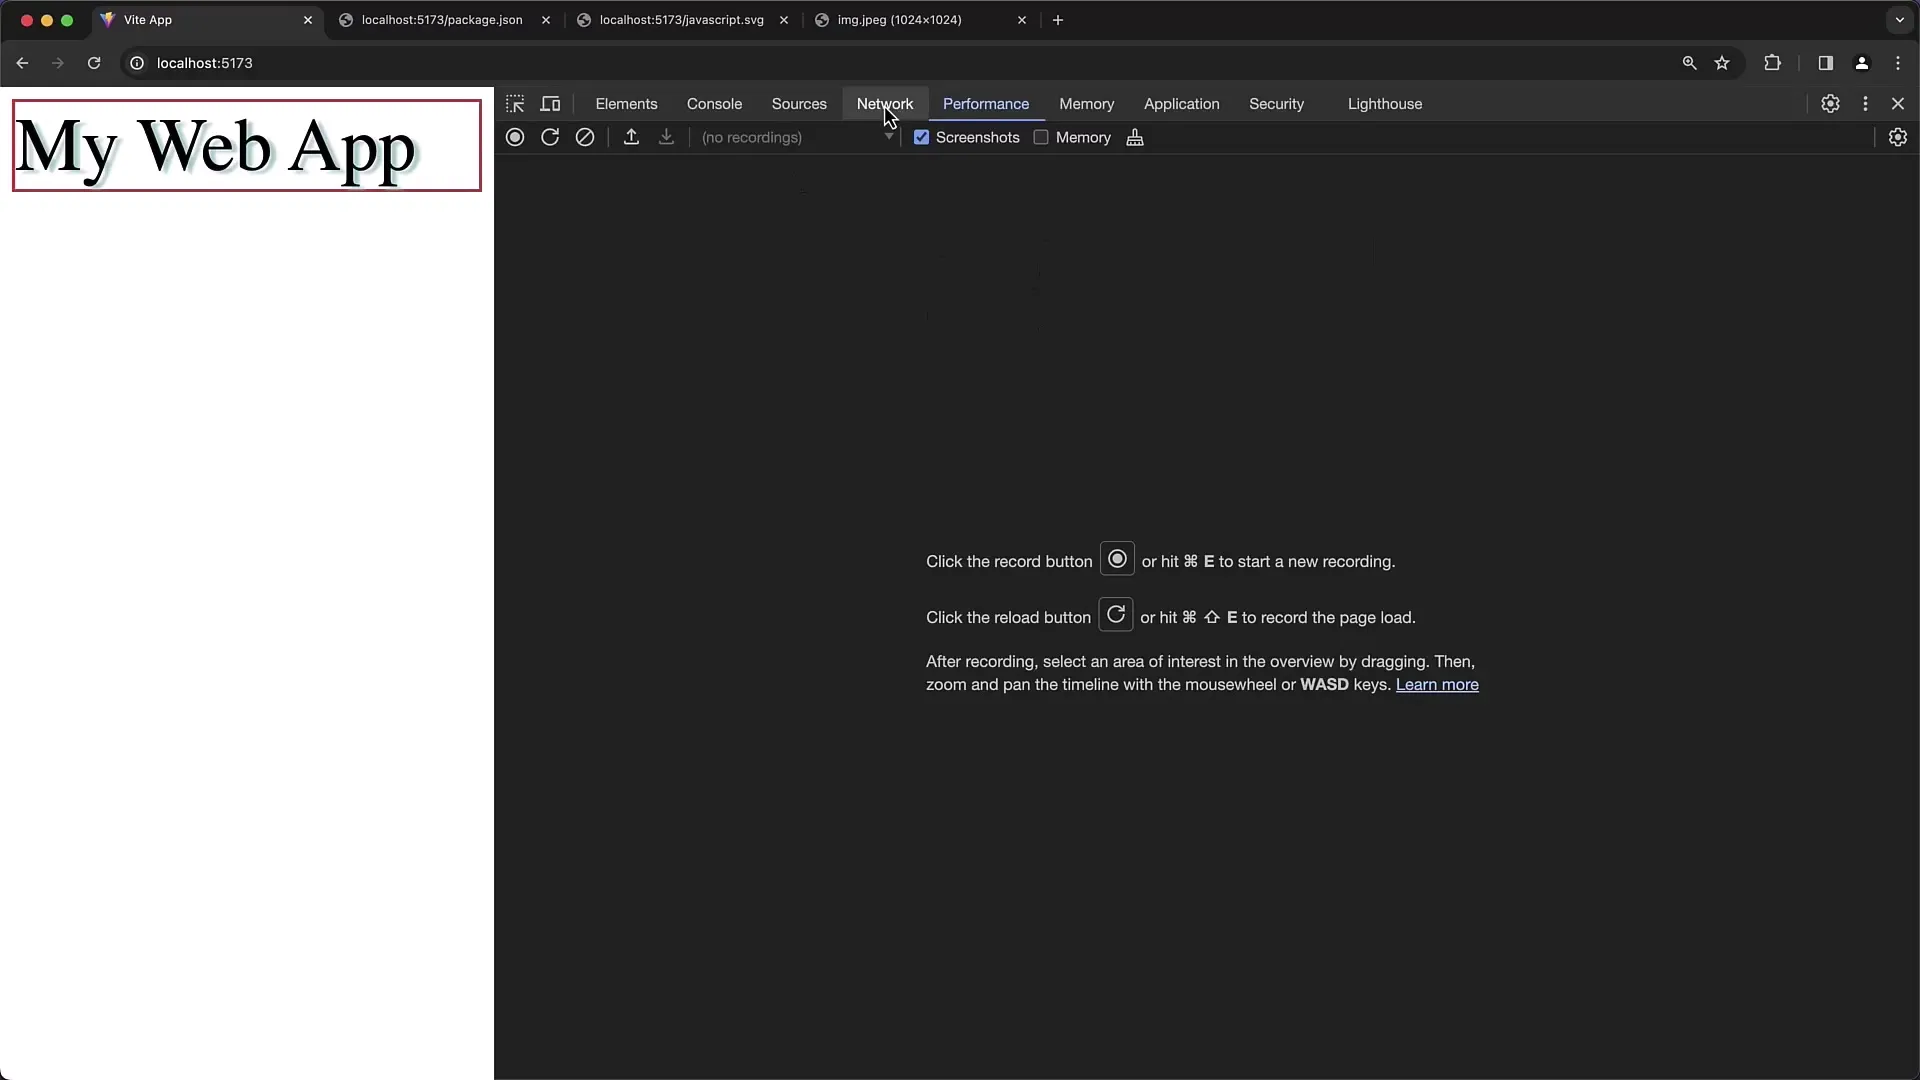
To use the Profiler tool in Chrome Developer Tools, first open the developer tools by pressing F12 or by right-clicking on the page and selecting "Inspect". In the top menu, you will find various tabs. Click on the "Performance" tab, which is typically located next to the "Network" tab.
Step 2: Starting a Recording
To start a performance recording, you can either reload the page while the recording is active or use manual recording. To start profiling directly, click on the "Start profiling and reload page" button. This is particularly useful when you have a complex page with many scripts that need optimization.
Step 3: Stopping the Recording
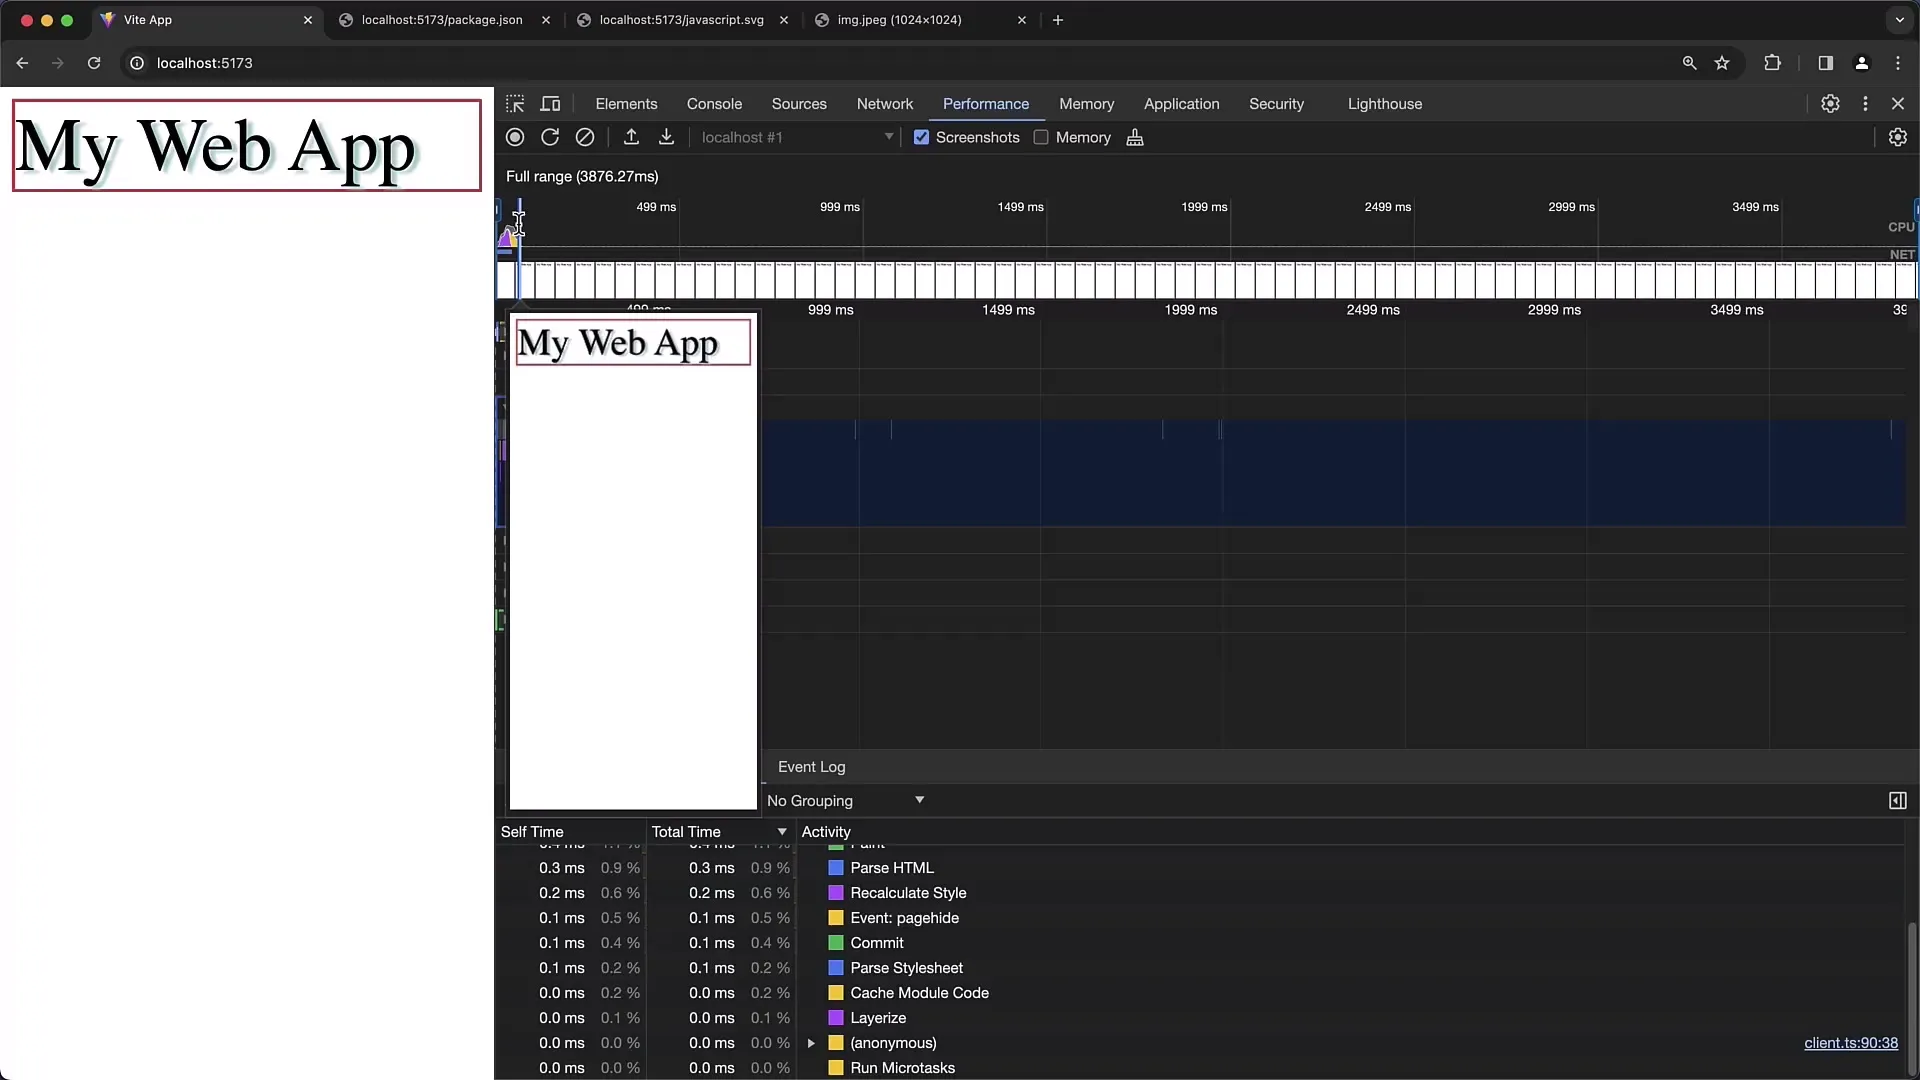
When you feel you have collected sufficient data, you can stop the recording manually. Simply click on the stop button in the Performance tab. You will now receive a visual overview of the performance data collected during the loading and rendering of your page.
Step 4: Analyzing the Performance Data
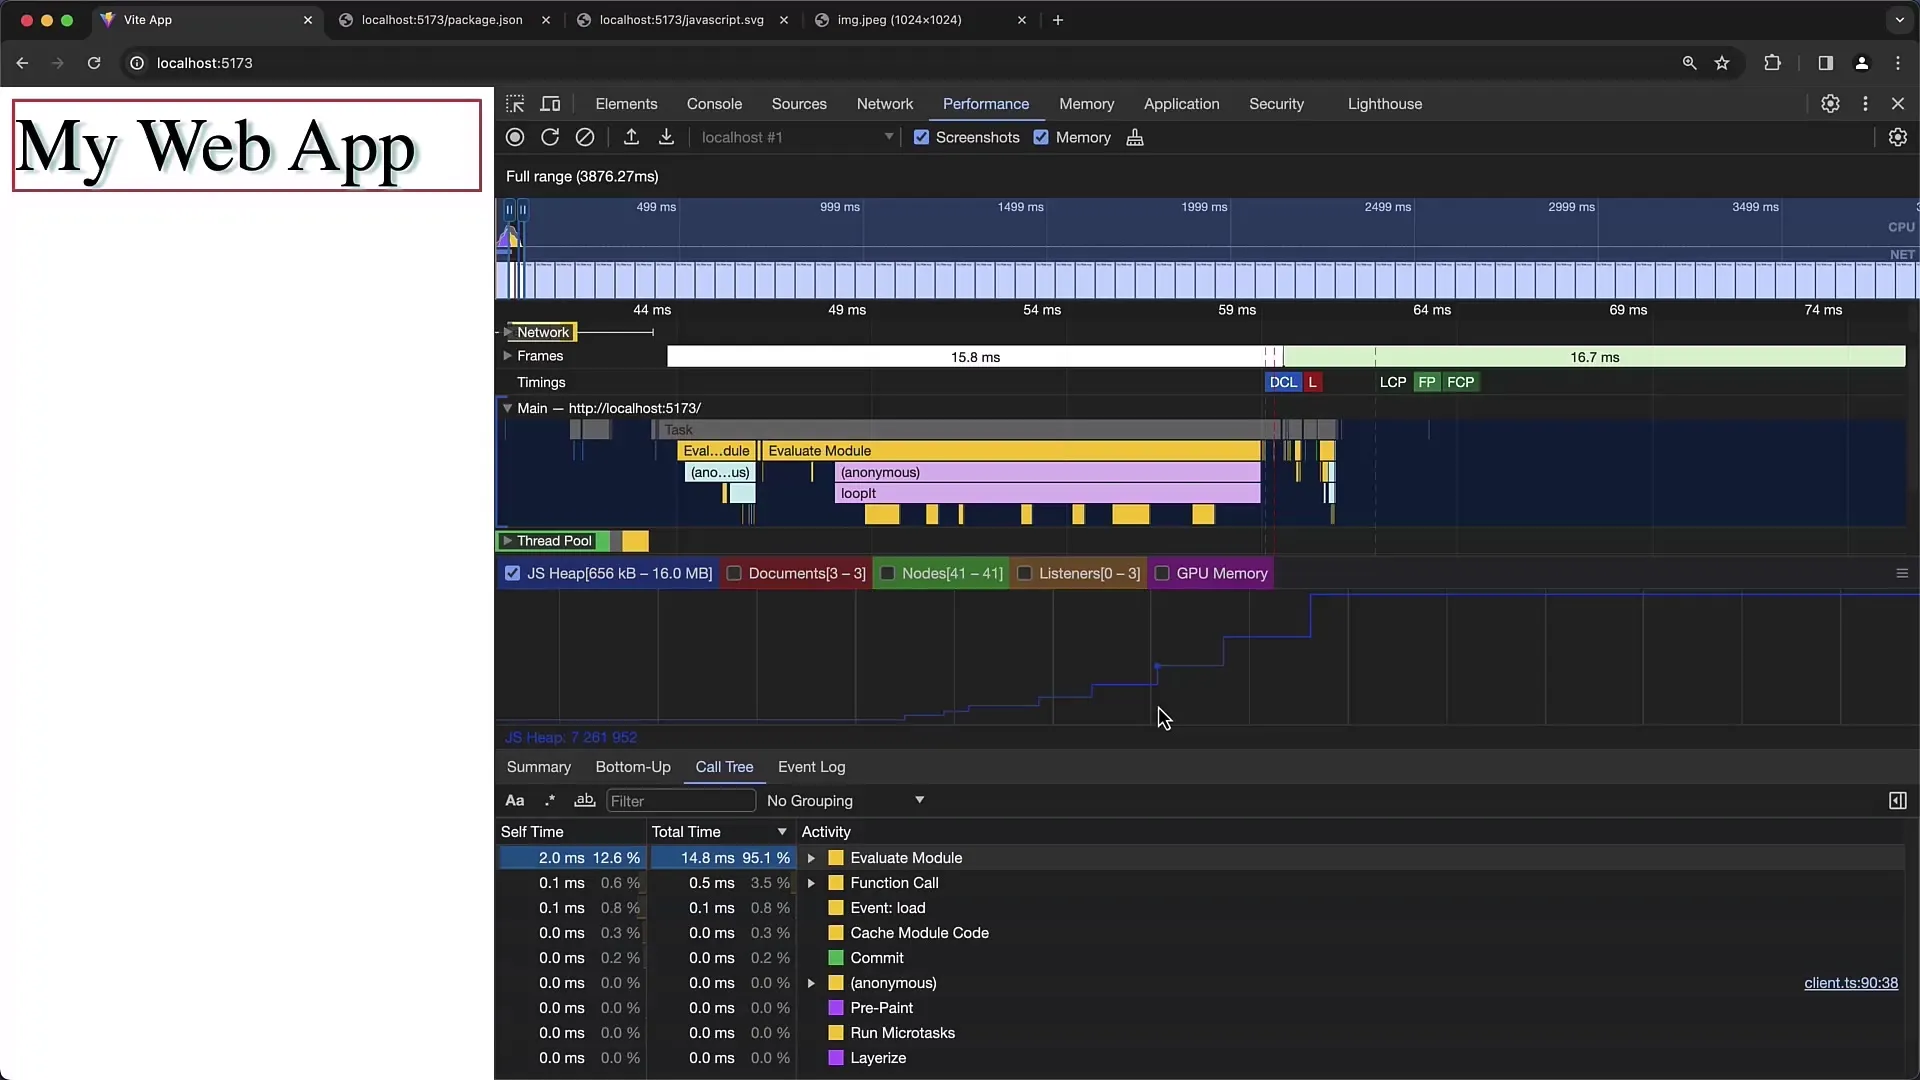
Once the recording has stopped, you will see a graphical representation of the performance log. This will show the timeline of various activities, including loading, rendering, and painting of the page. You can customize the view by zooming in to get more detailed information or to analyze specific time periods.
Step 5: Detailed Analysis of Scripting Time
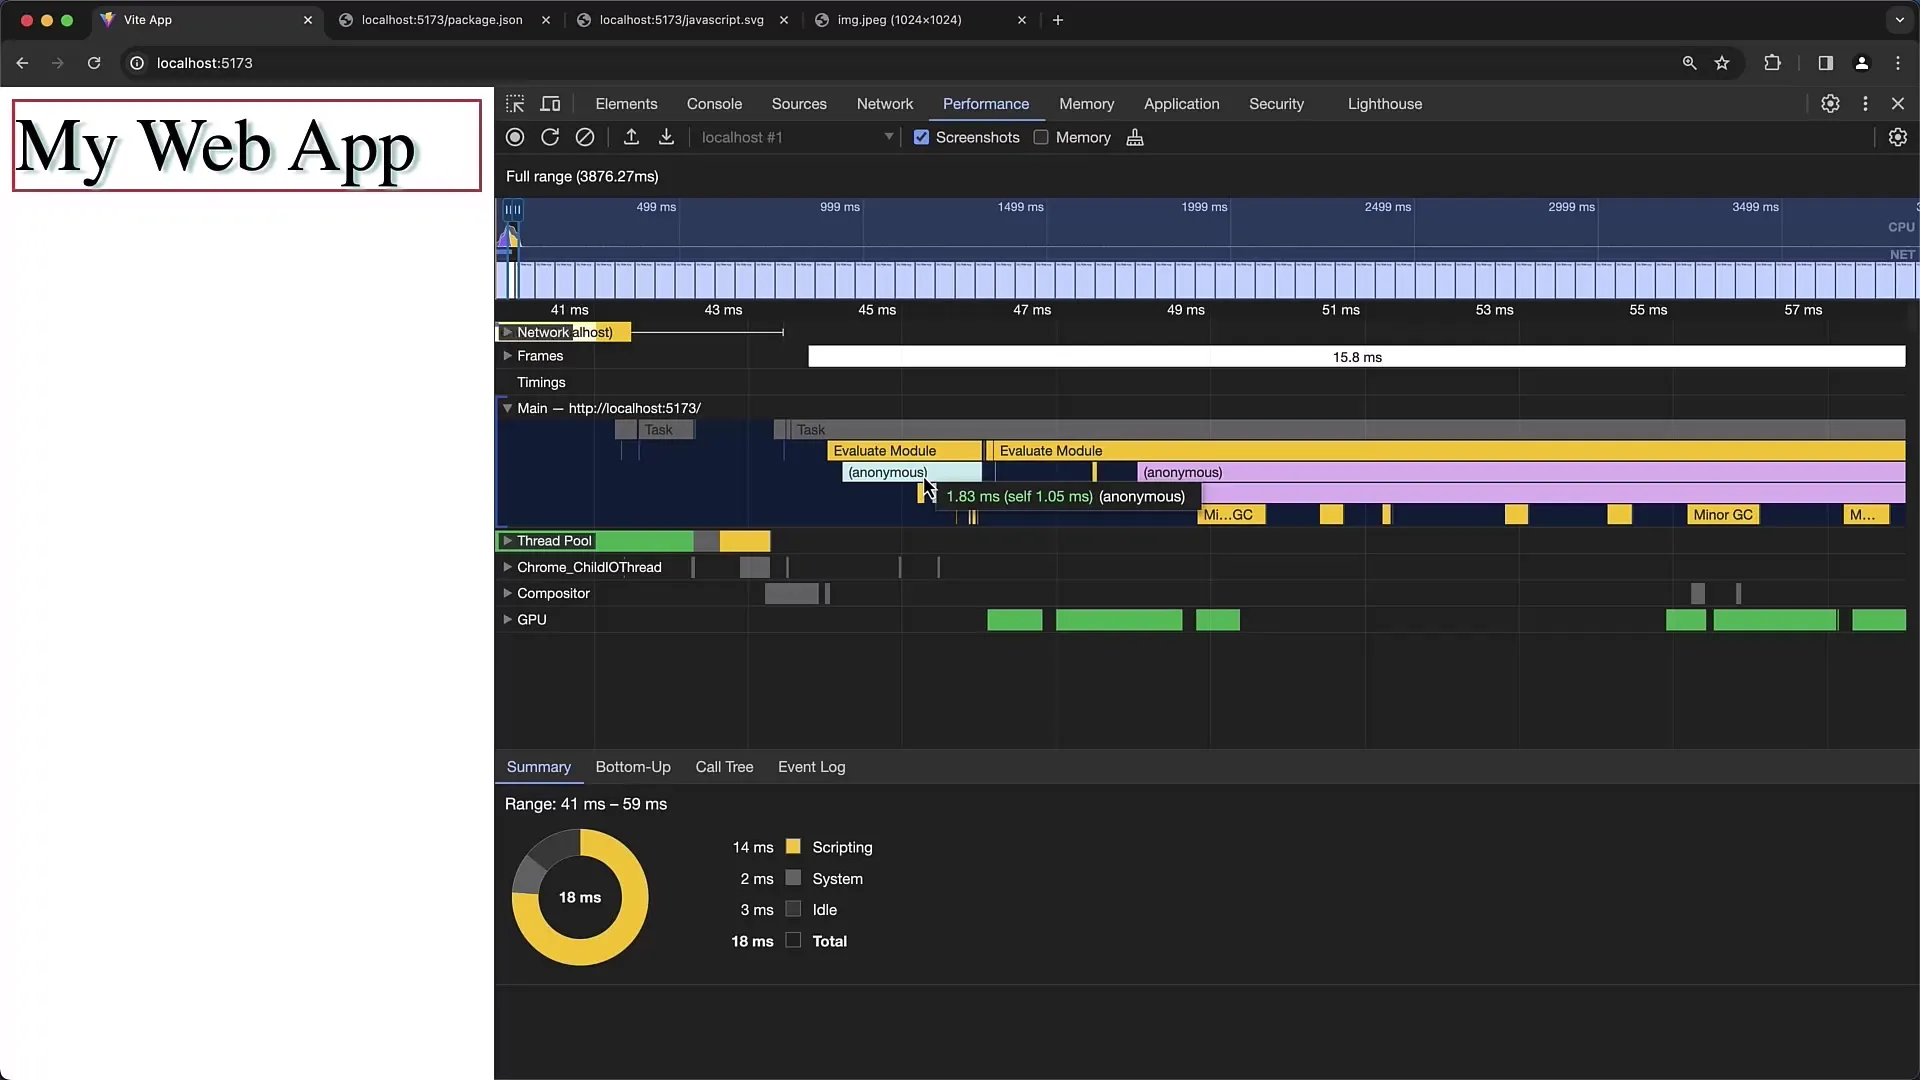
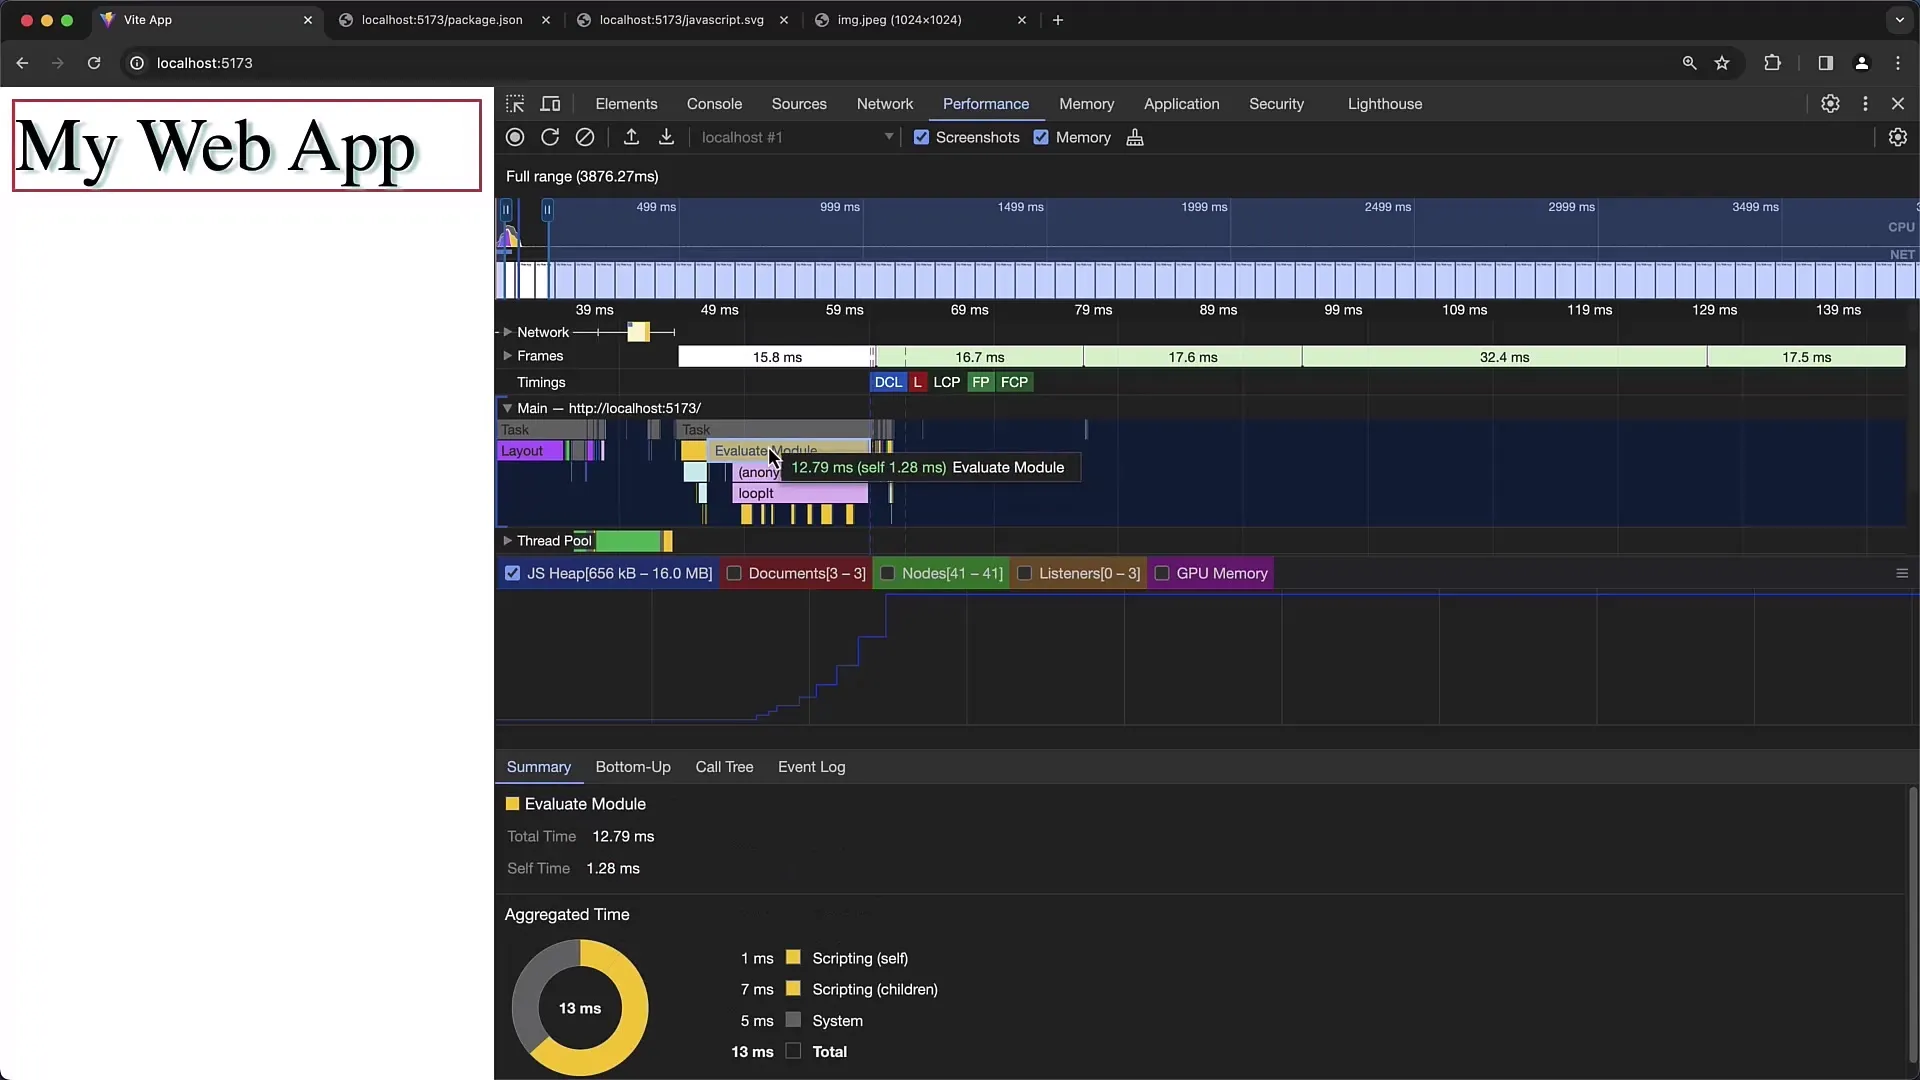
To analyze the performance data more precisely, look at the "Scripting" section, which indicates how much time was spent executing JavaScript functions. Prolonged durations in this area may indicate inefficient code. You can delve into the specific module to see which function consumes the most time.
Step 6: Identifying Rendering Issues
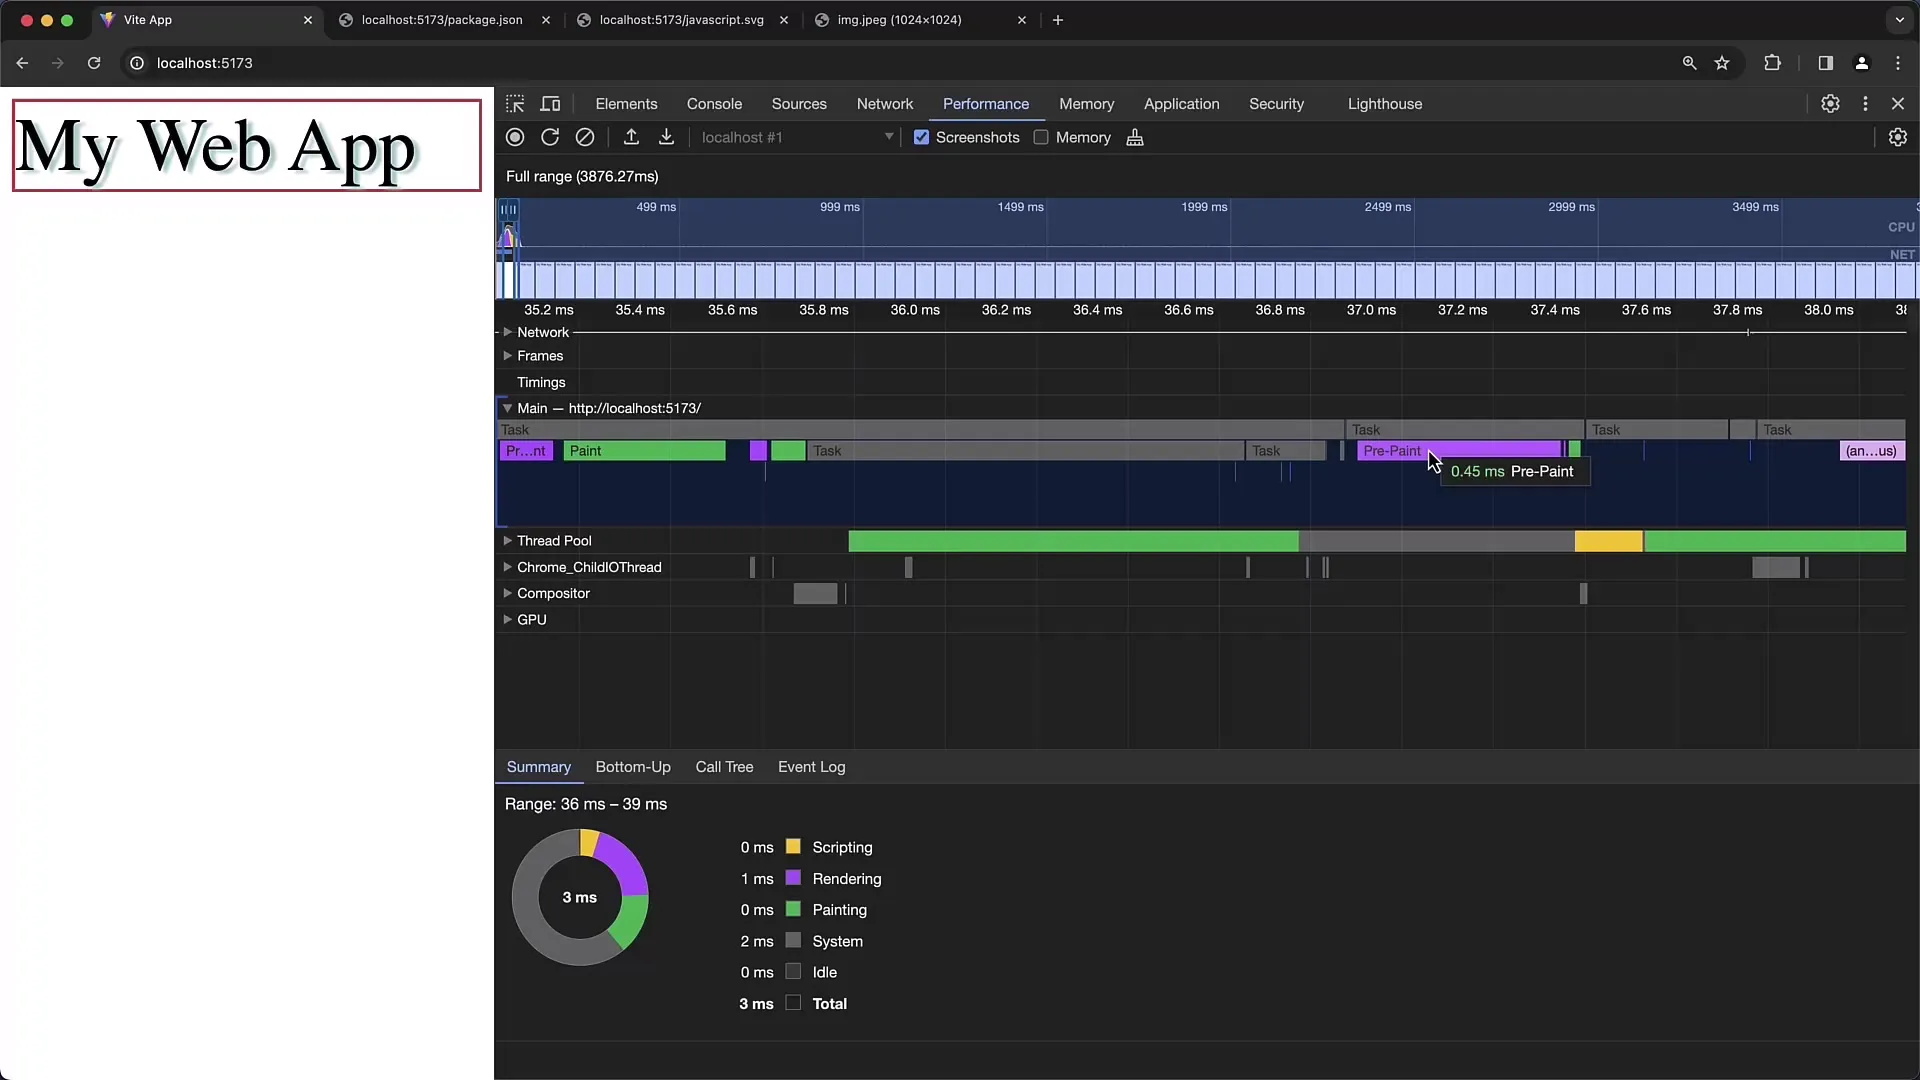
Another crucial aspect is rendering time. Here, you can determine where most time is spent on layout, painting, and composition. Lengthy rendering can result in delayed user interface response or non-fluid display. Pay attention to whether there are many layout or paint events and optimize them if necessary.
Step 7: Analyzing Memory Usage
Go to the "Memory" section in the performance data. Here, you will see your application's memory usage during script execution. A common cause of performance issues is excessive memory consumption due to creating large objects or arrays. In the garbage collection, you can see how much memory is actually being freed.
Step 8: Brief Summary of Results
After conducting the analysis, gather the insights and plan the next steps. Consider which functions consume the most performance and where optimizations are possible. It is beneficial to perform these steps iteratively to ensure that changes actually lead to performance enhancements.
Summary
In this tutorial, you have learned how to use the Profiler tool in Chrome Developer Tools for analyzing the performance of JavaScript code. You have seen how to start recordings, analyze the collected data, and identify weaknesses. By continuously monitoring and optimizing, you can significantly improve the performance of your applications.
Frequently Asked Questions
What should I do when I have found a performance bottleneck?Analyze the specific section of code causing the bottleneck and consider how you can optimize it, e.g., by reducing the number of DOM elements or optimizing loops.
Can I export the performance data?Yes, you can export the performance data by right-clicking on the performance recording and saving the data.
How often should I check the performance of my application?It is recommended to regularly check the performance, especially after major changes to the code or user interface.


