In software development, efficient resource management is crucial, especially when using JavaScript. A common issue is memory leaks, which can impact the performance and stability of an application. In this tutorial, I will show you how to use the Memory Profiler in the Chrome Developer Tools to analyze your application's memory usage and identify potential memory leaks.
Main Insights
- The Memory Tab allows you to monitor your application's memory usage and create heap snapshots.
- Garbage collection is an automated process that frees up memory that is no longer referenced.
- With heap snapshots, you can analyze the current state of your memory and discover which objects hold references.
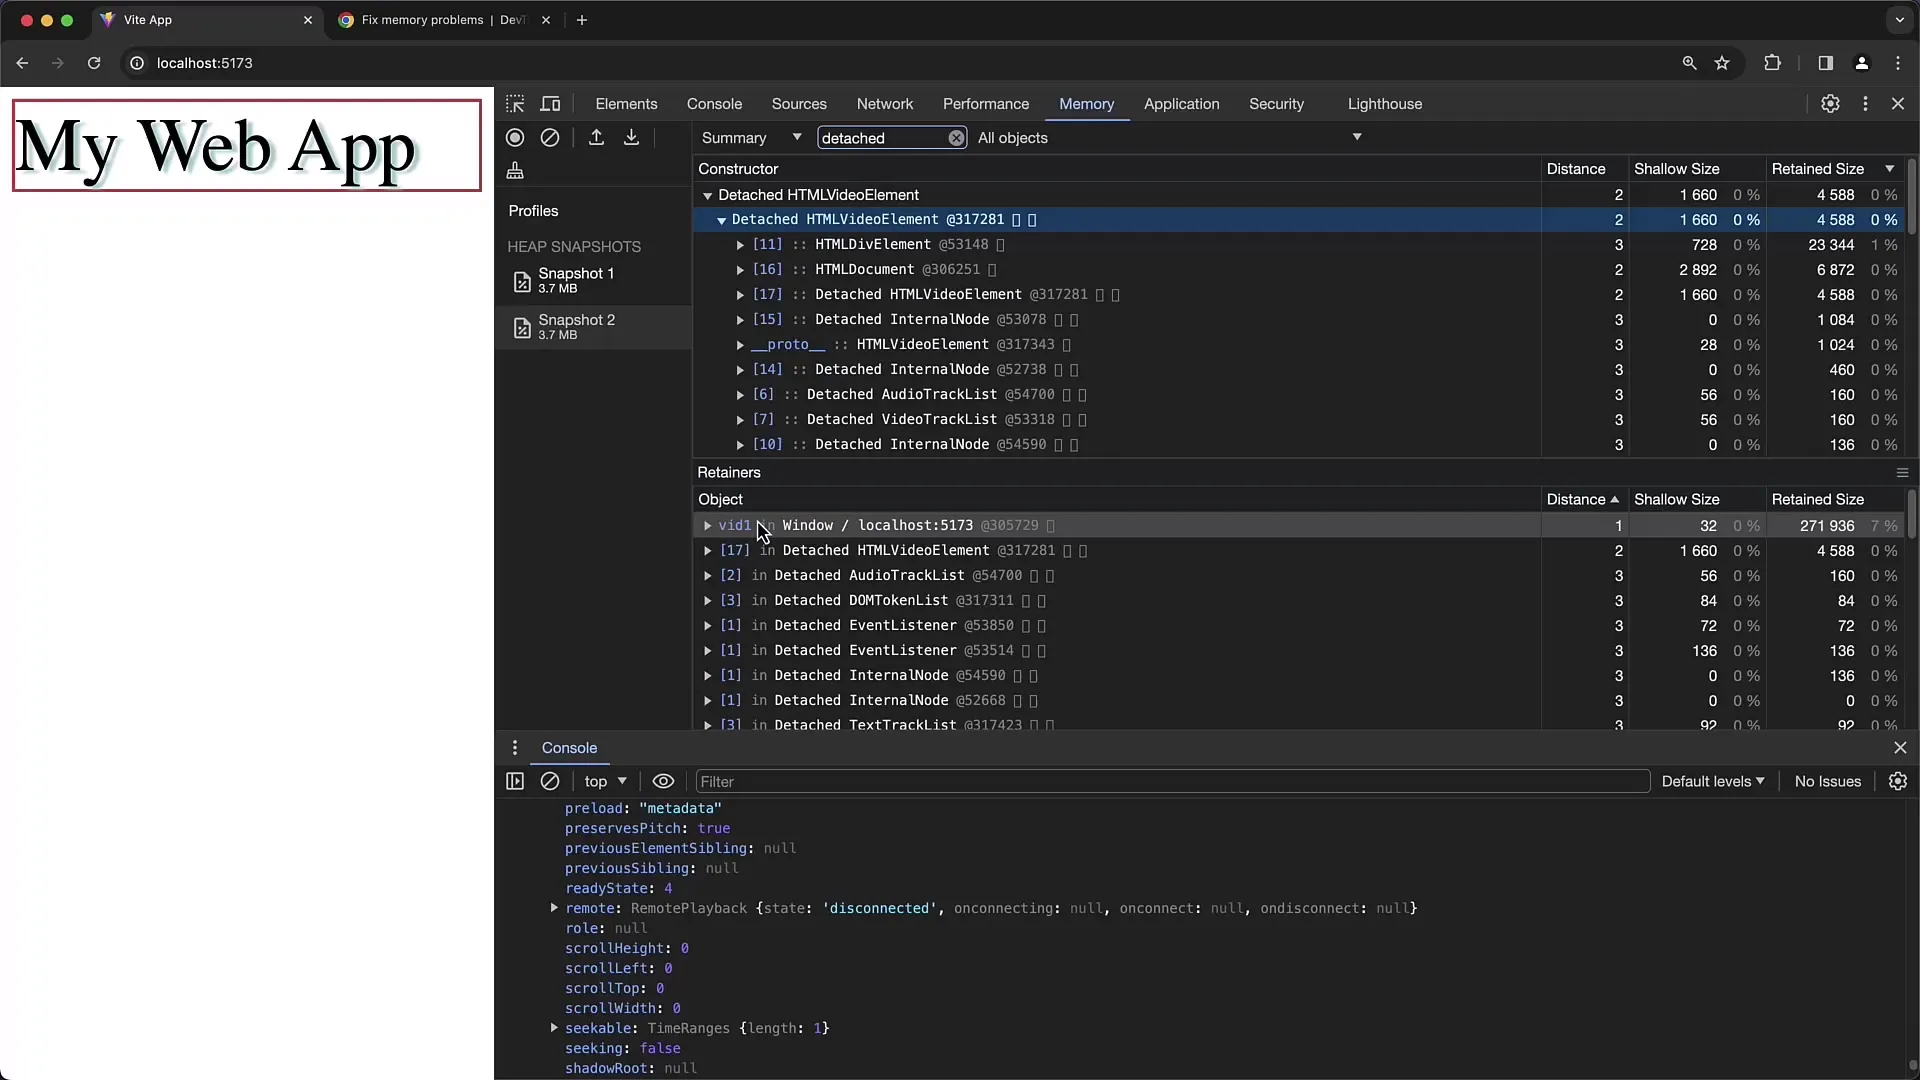
- Detached DOM elements can potentially cause memory leaks if not released correctly.
Step-by-Step Guide
Step 1: Accessing the Memory Tab
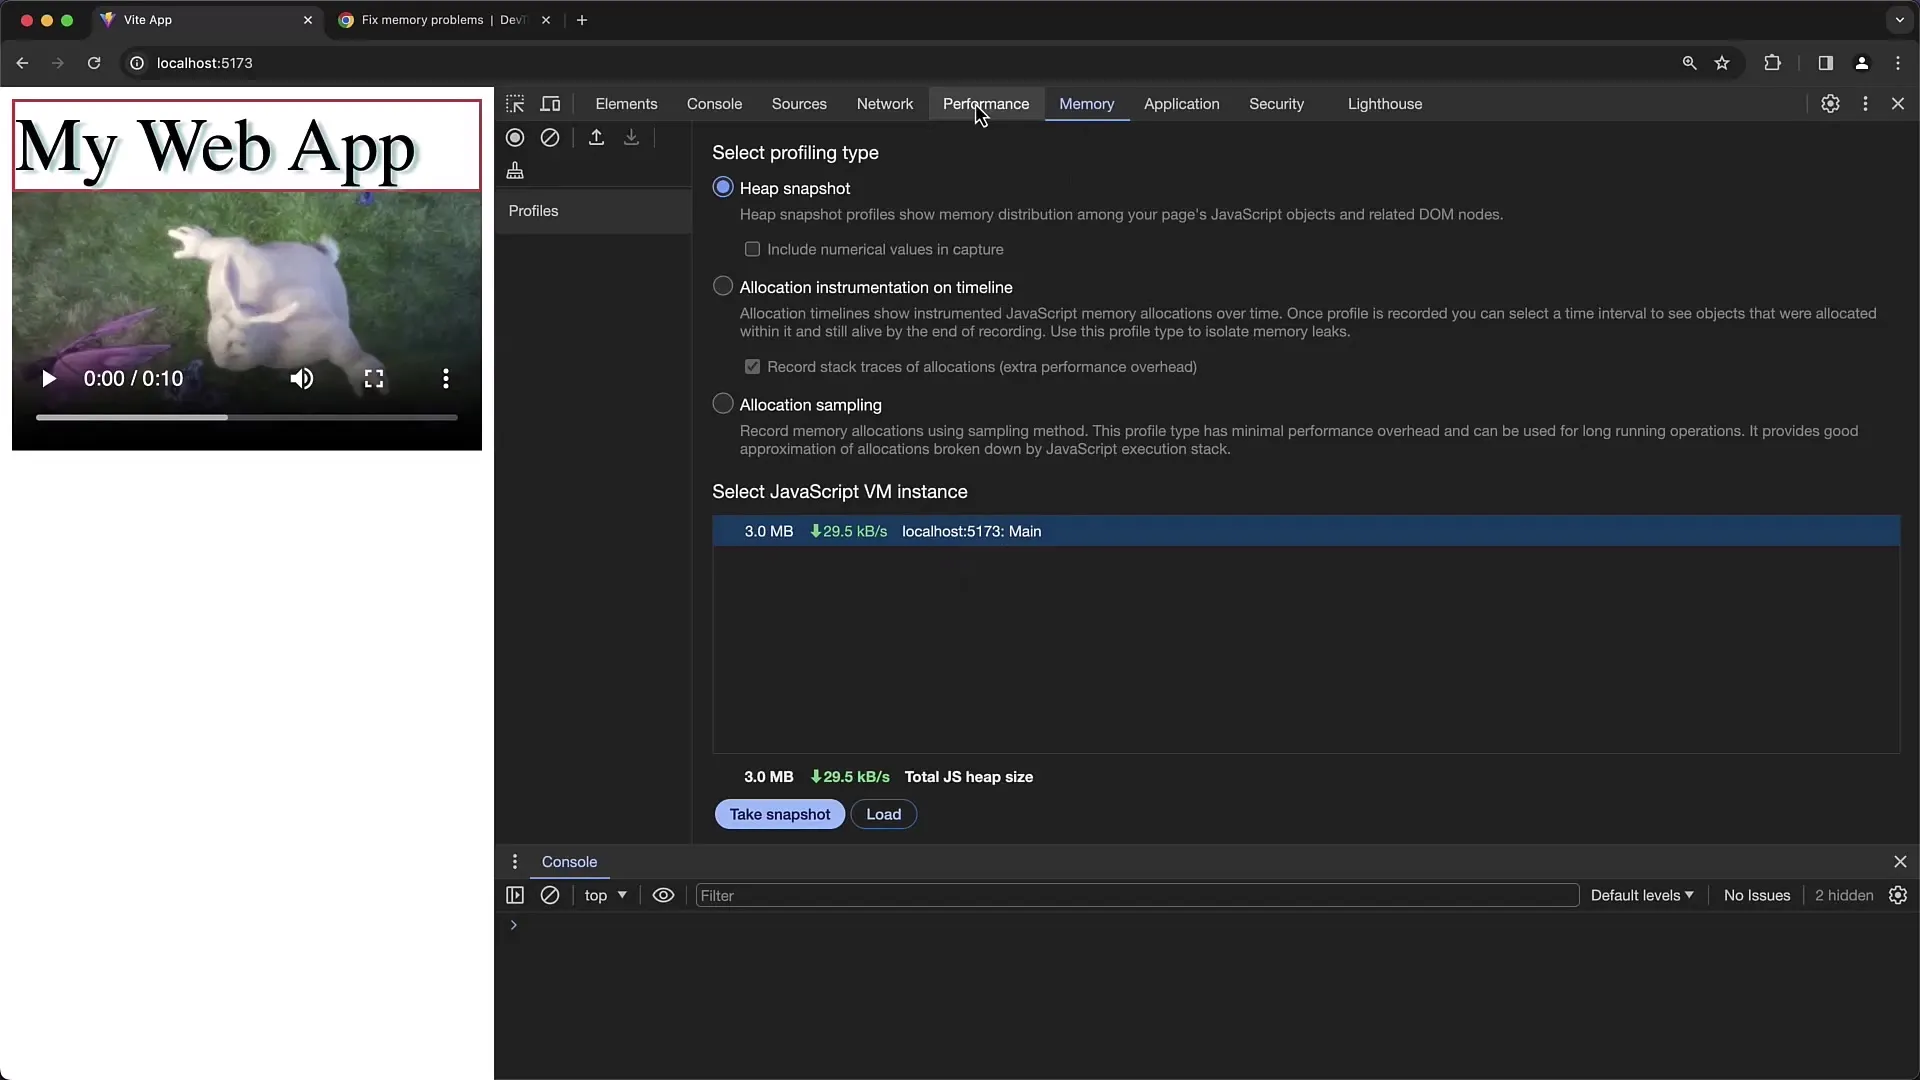
To use the Memory Profiler, open the Chrome Developer Tools by right-clicking on the page and selecting "Inspect" or using the F12 key combination. Then navigate to the "Memory" tab.
Step 2: Creating a Heap Snapshot
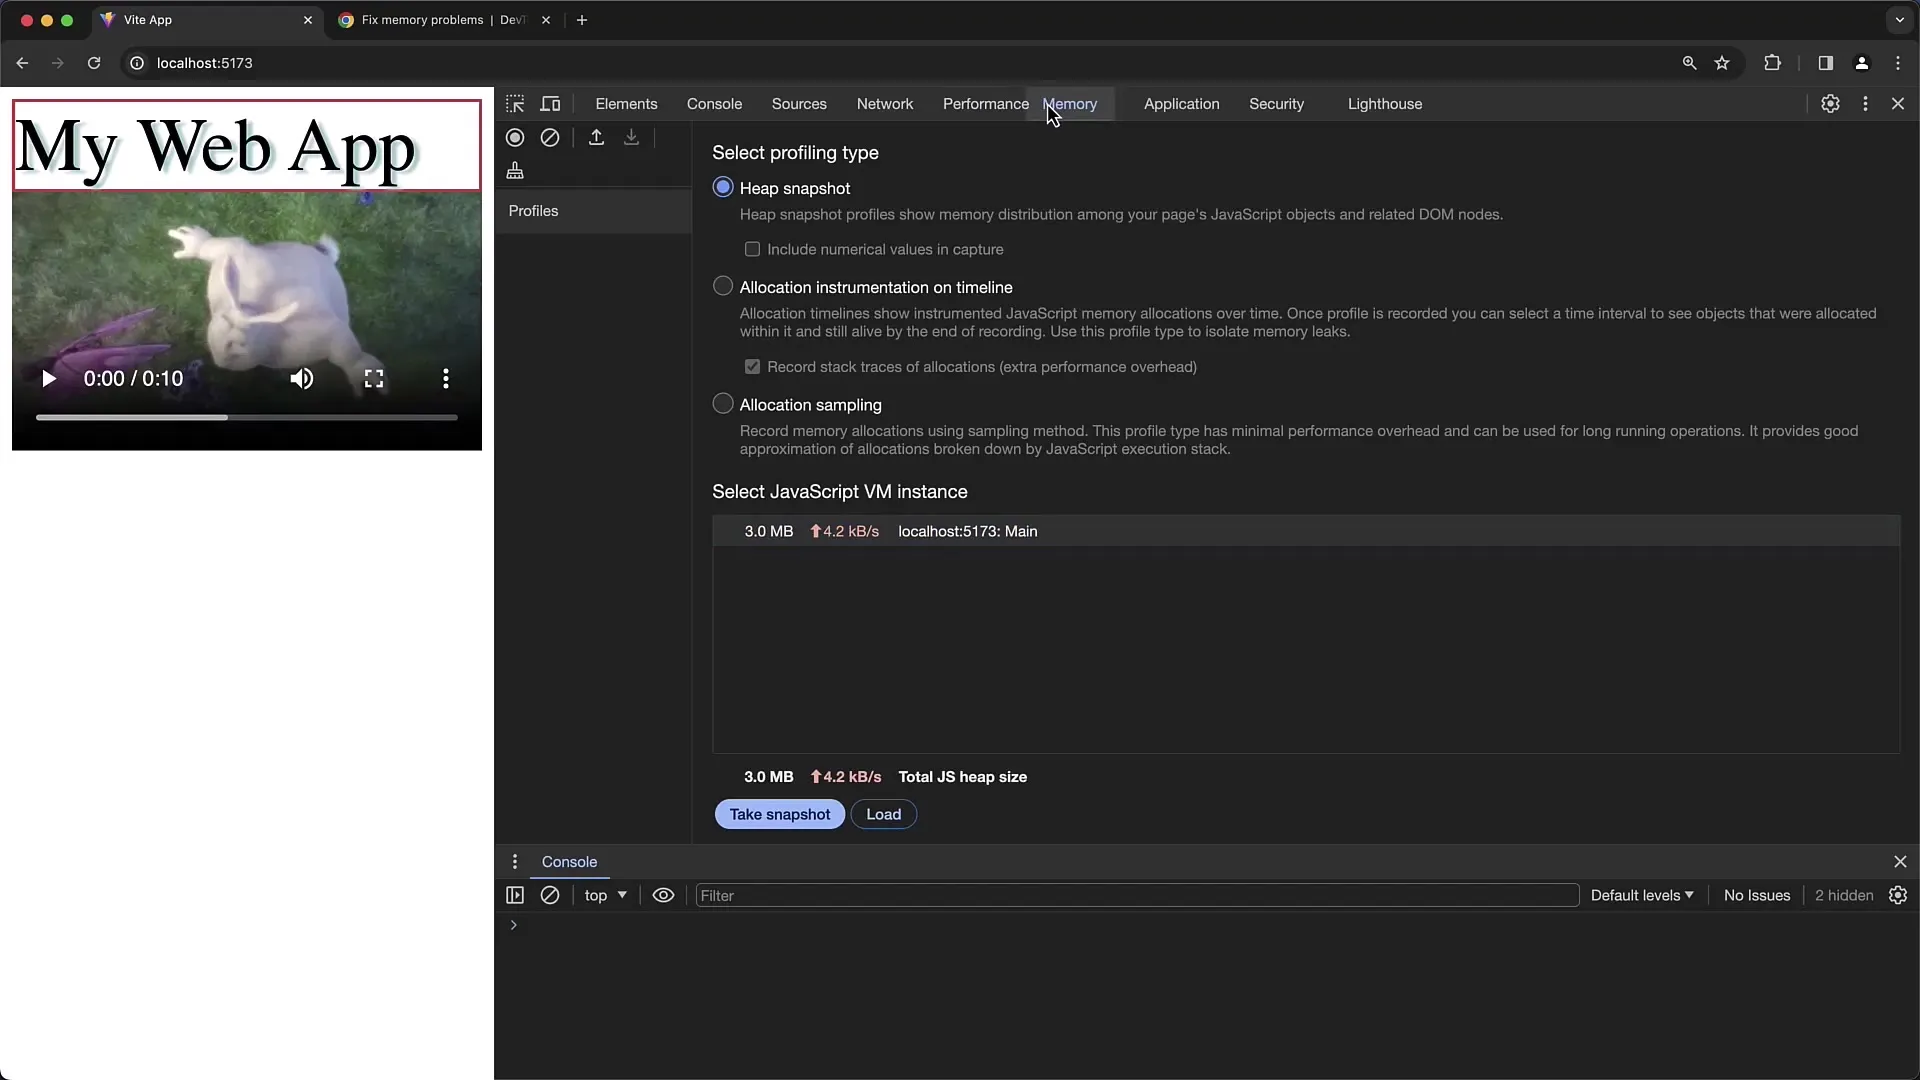
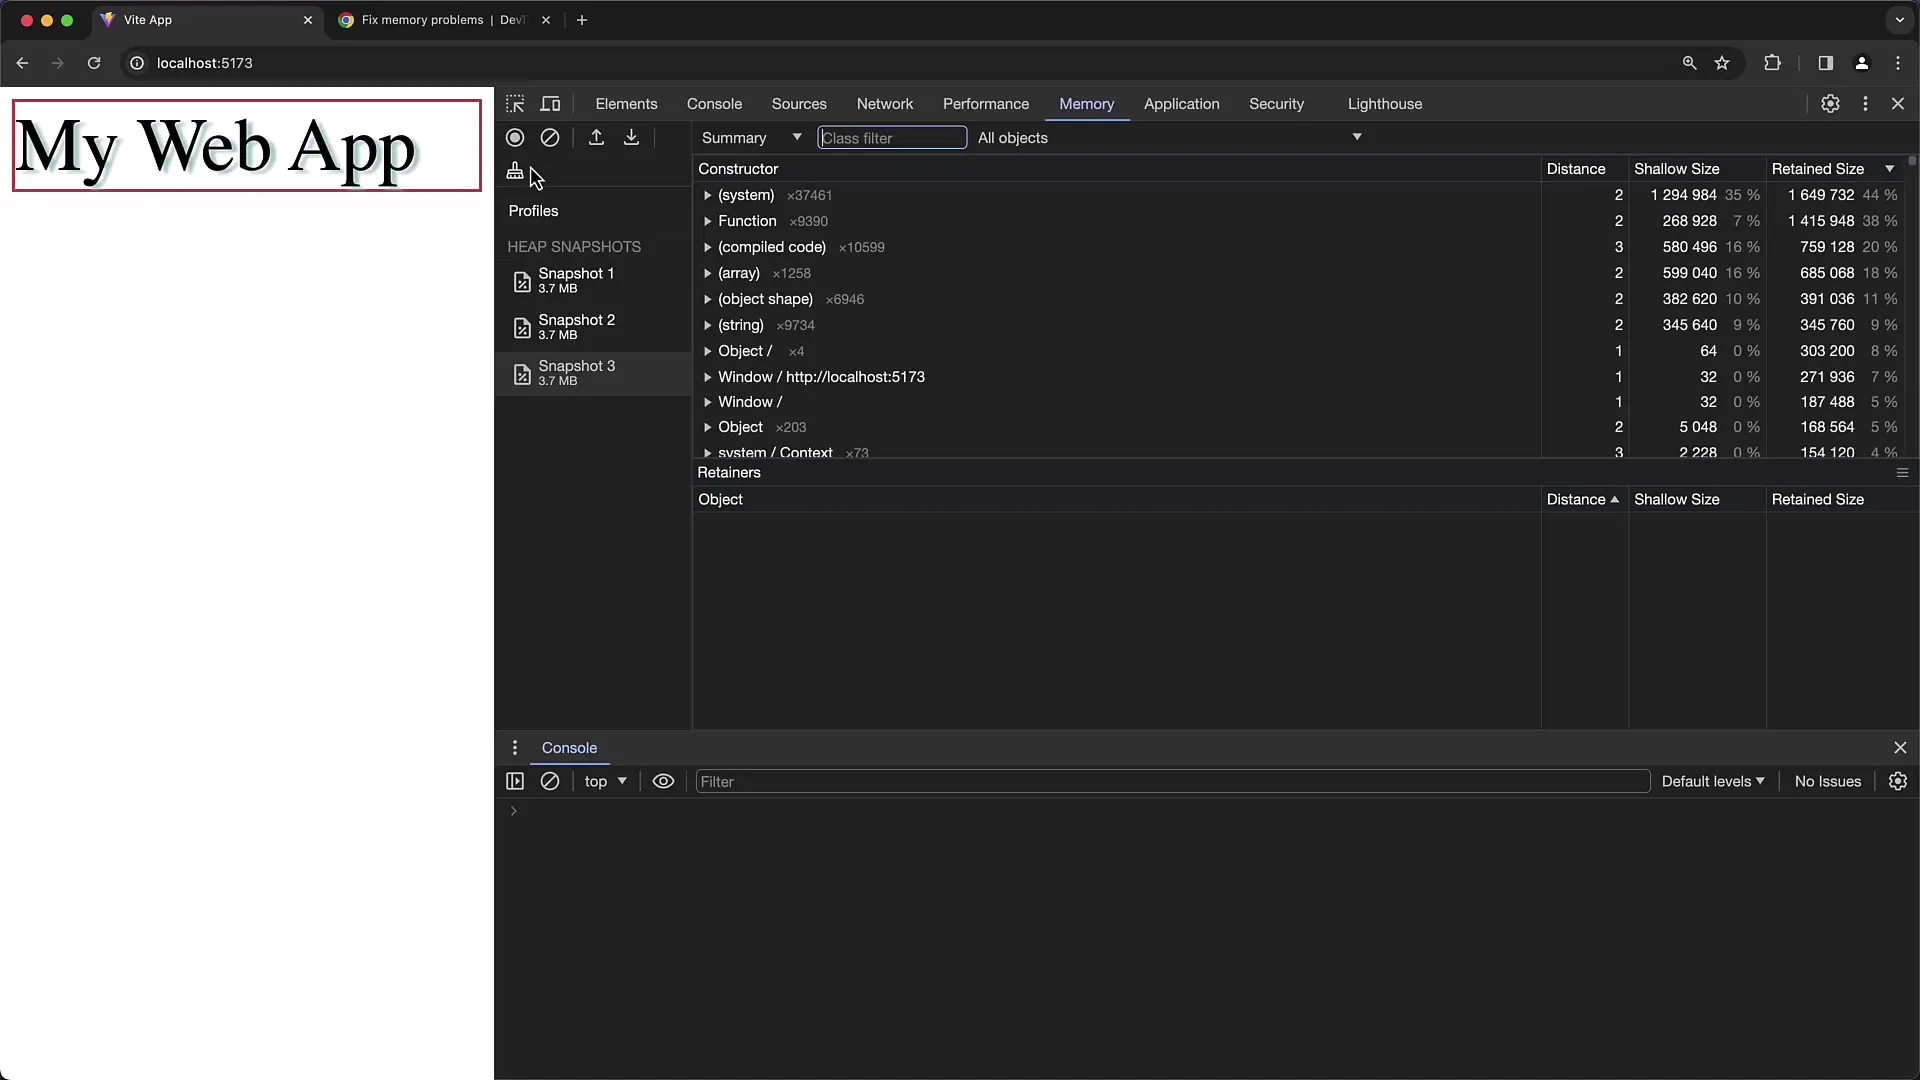
In the Memory Tab, you can create a heap snapshot. Click on the "Take Snapshot" button. This will give you an overview of the memory state of your application at a specific point in time. With this snapshot, you can examine the current objects and their references.
Step 3: Analyzing the Heap Snapshot
After creating the snapshot, you can analyze the objects held in memory. Scroll through the list of objects and click on a specific object to get more information about its references. You can also view the object's size and its retainer references, which indicate which objects have prevented the current object from being removed by the garbage collector.
Step 4: Triggering Garbage Collection
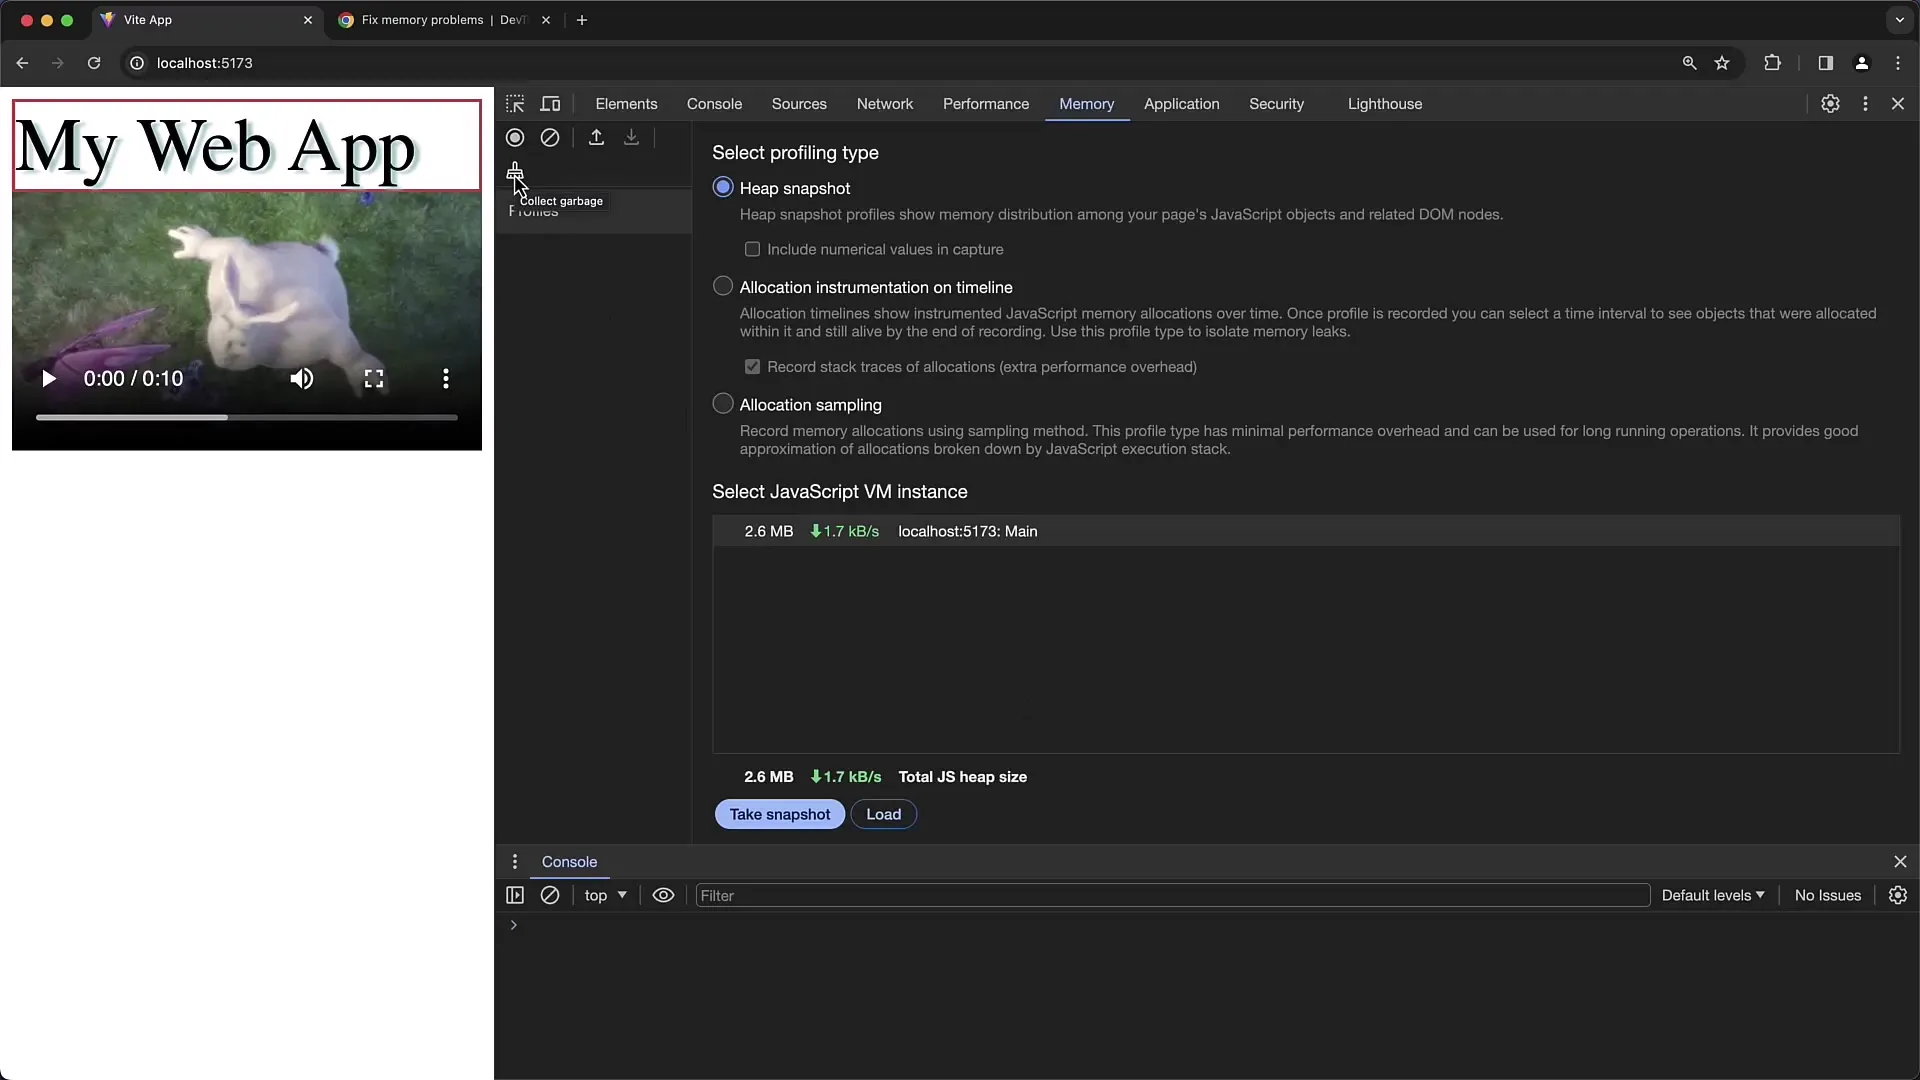
To check which objects can be safely released, you can manually trigger garbage collection. Click on the "Collect Garbage" button. This allows you to observe if the memory usage is reduced and if unused objects are deleted.
Step 5: Examining Detached DOM Elements
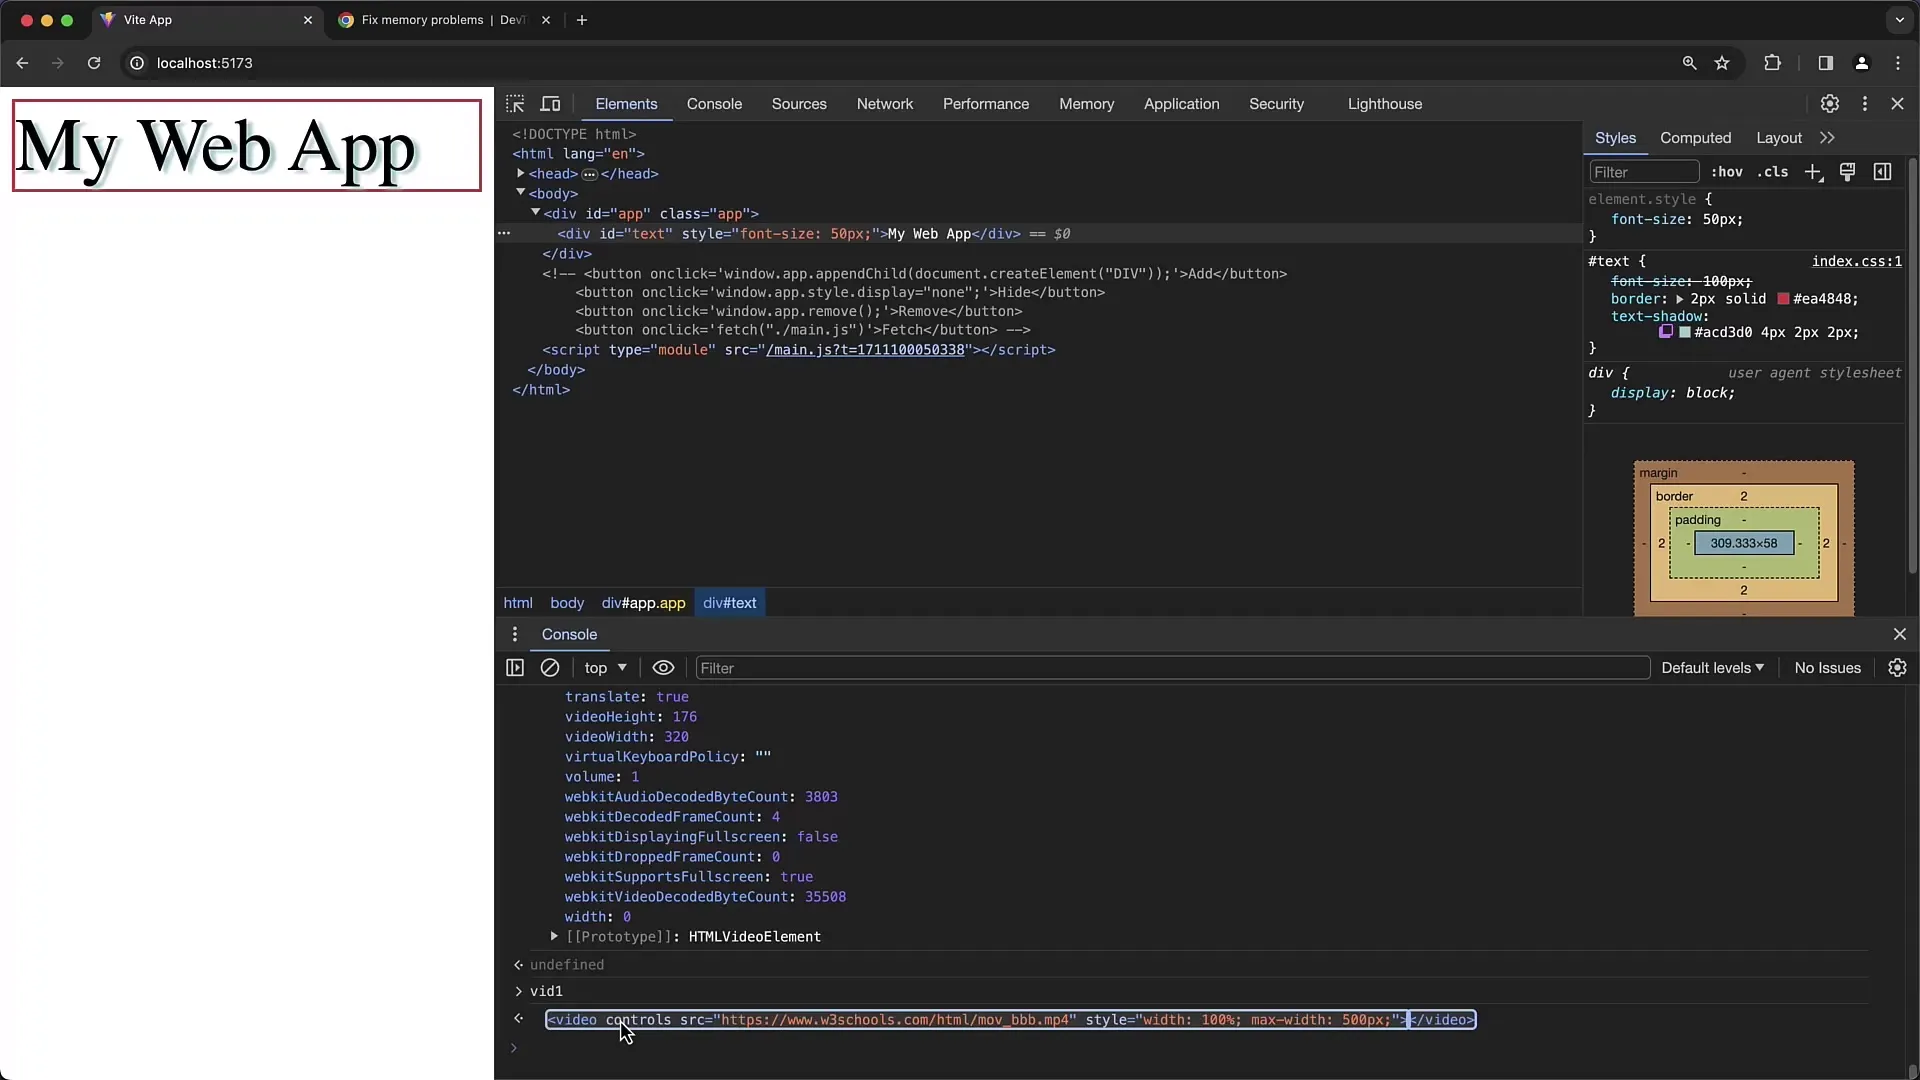
A common issue in memory management is detached DOM elements, which are elements that have been removed from the DOM but are still held in memory. You can easily identify these objects by filtering for "detached" in the snapshot. This way, you can check which elements are no longer in the DOM but are still held in memory.
Step 6: Tracking Object References
If you find that certain objects are not being released, it is important to understand which other objects they are being referenced by. Select the object and look at the retainer references to understand the hierarchy and dependencies that prevent the garbage collector from intervening.
Step 7: Testing and Validating
To ensure that your changes optimize memory usage, take heap snapshots repeatedly during your application's interaction. This way, you can determine if memory usage behaves as expected and if all unnecessary objects are successfully released.
Step 8: Using the Timeline Feature
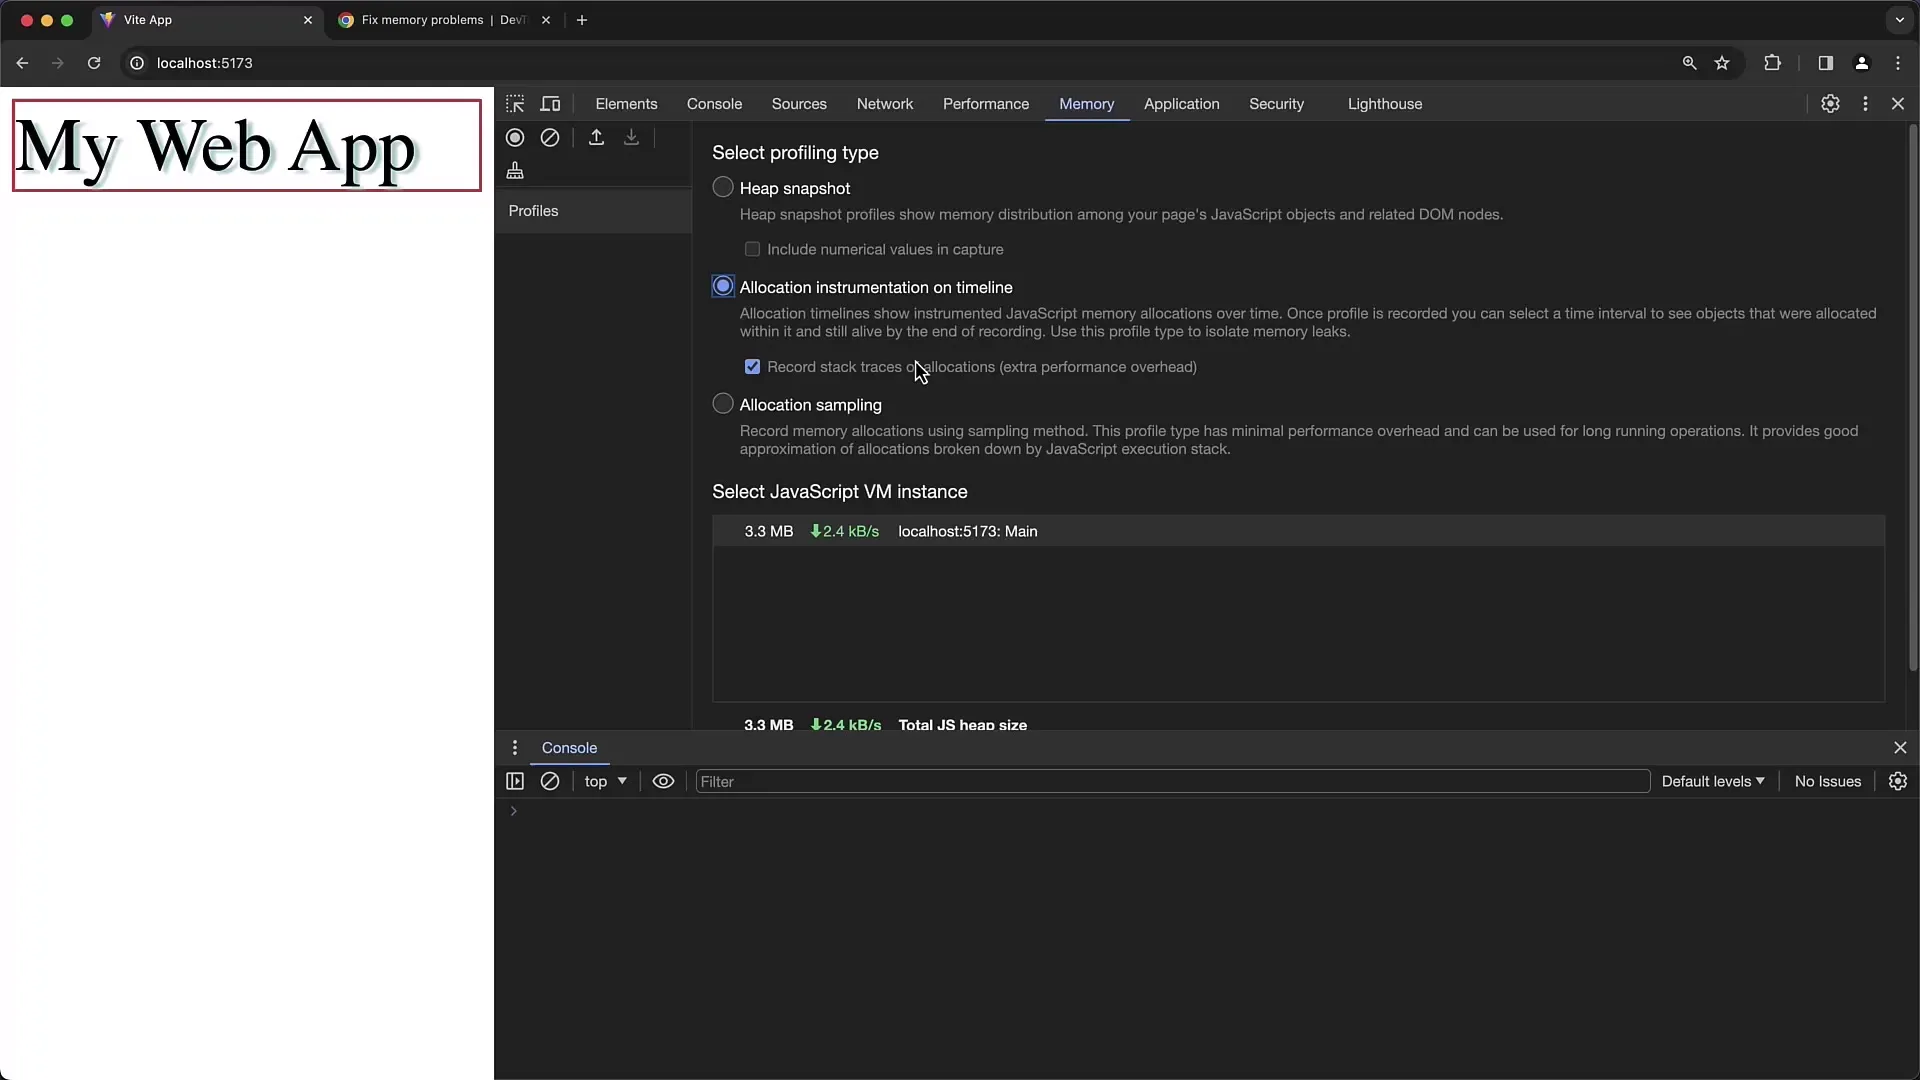
In addition to the snapshot feature, the Timeline feature allows you to observe memory allocation over a period of time. You can define the time span and analyze how objects are allocated in memory during application inputs. Click on "Start Recording" and interact with your application to study the allocations.
Summary
In this guide, you have learned how to use the Memory Profiler of Chrome Developer Tools to analyze the memory consumption of your applications. You have learned how to create Heap Snapshots, trigger garbage collection, and identify potential memory leaks through detached DOM elements. By regularly using these tools, you can optimize the memory consumption and significantly improve the performance of your applications.
Frequently Asked Questions
How can I determine if there is a memory leak?A memory leak occurs when the memory consumption of your application steadily increases during usage without ever returning to a normal level.
What are detached DOM elements?Detached DOM elements are those that have been removed from the DOM but are still being held in memory, often by existing references in JavaScript variables.
How can I ensure that my application does not hold any unused memory?Regular Heap Snapshots and using the Garbage Collection function help to identify unused objects and ensure they are released.
Can I save the results of Heap Snapshots?Yes, you can save the snapshots and load them later to perform a past analysis of your application.


