In this guide, you will learn about the useful features of the Rendering tab in the Chrome Developer Tools. This tool is essential for optimizing the performance of your web applications. You will discover how to debug layout, optimize animations, and understand the importance of user experience in terms of rendering speed. Let's dive in and explore the different features that will help you improve the rendering of your web applications.
Key Insights
- The Rendering tab offers various tools for analyzing and optimizing the rendering process.
- The options in the tab allow you to optimize animations, layout styles, and user experiences.
- By monitoring rendering statistics, you can identify and resolve potential bottlenecks.
Step-by-Step Guide
Accessing the Rendering Tab
To access the Rendering tab, you need to open Chrome's Developer Tools. You can do this by right-clicking on the page and selecting "Inspect," or by pressing the keyboard shortcut Ctrl + Shift + I. Once the Developer Tools are open, click on the menu with three dots in the top right corner and navigate to "More tools" and then to "Rendering."
Flexbox Visualization
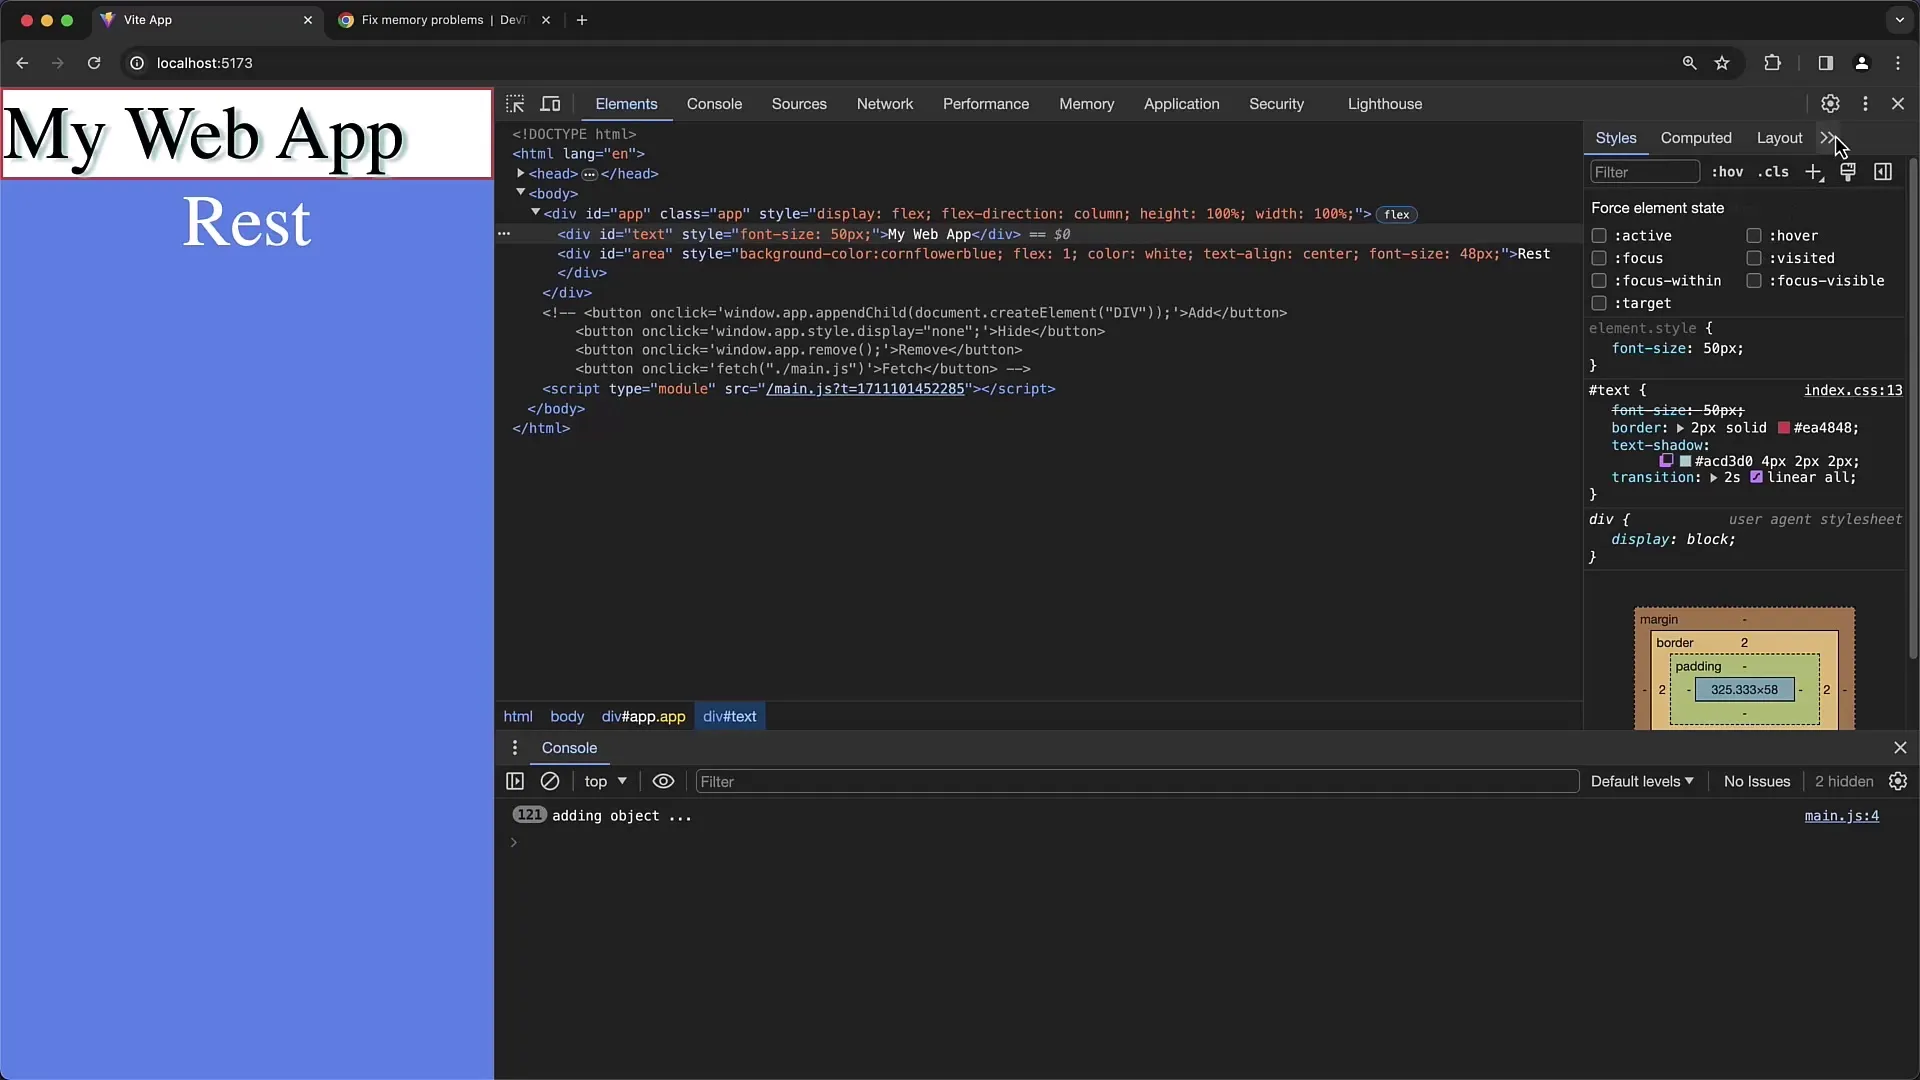
Before exploring the Rendering tab, let's take a look at the Elements Sidebar, where you can adjust various layout properties. A useful feature here is the Box Editor. For a Flexbox layout, you can click on the "Open Box Editor" button. Here, you will see an overview of Flex properties, such as flex-direction, justify-content, and align-items. These settings allow you to directly influence the layout.
Optimizing Animations
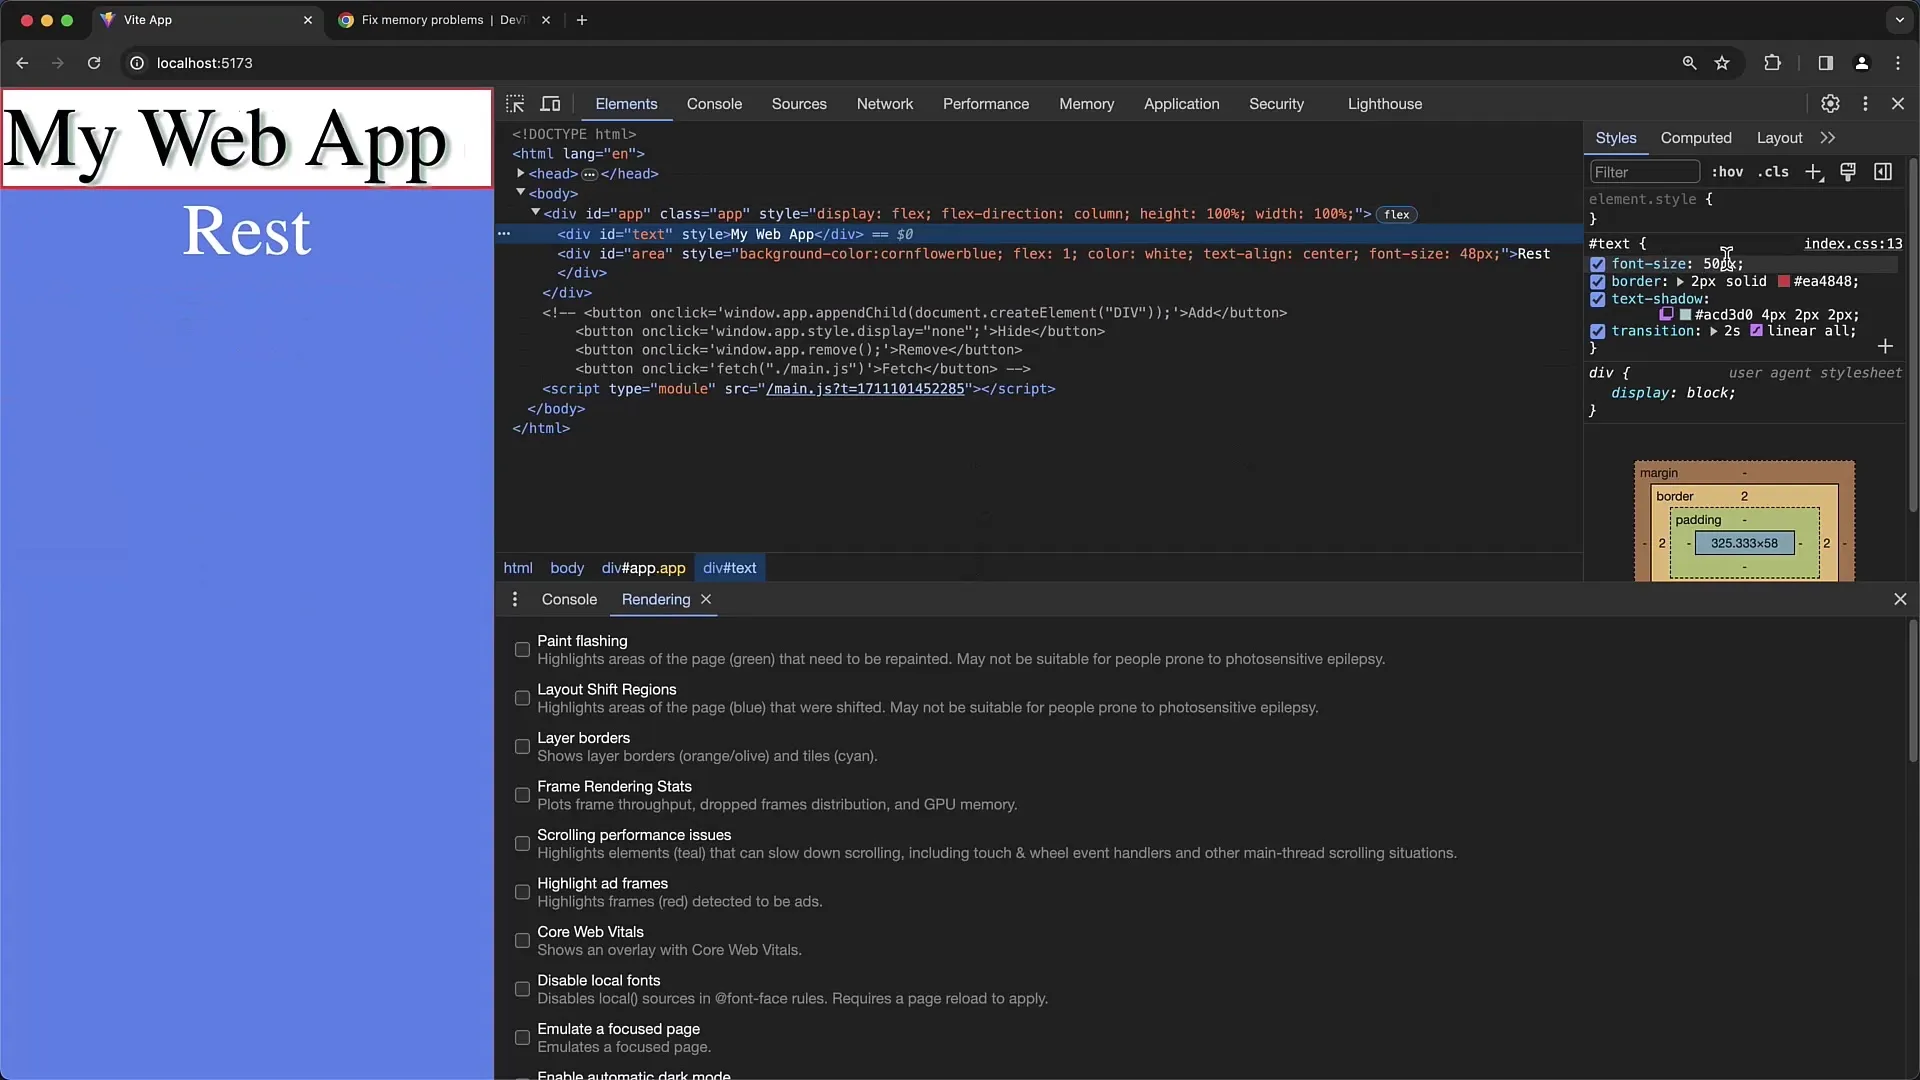
Another important aspect is animation. To debug animations, select an element with an animated property and turn on "Hover." You can observe the font-size value increasing from 50 pixels to 100 pixels. This allows you to adjust transition properties for smoother animation.
Available Rendering Settings
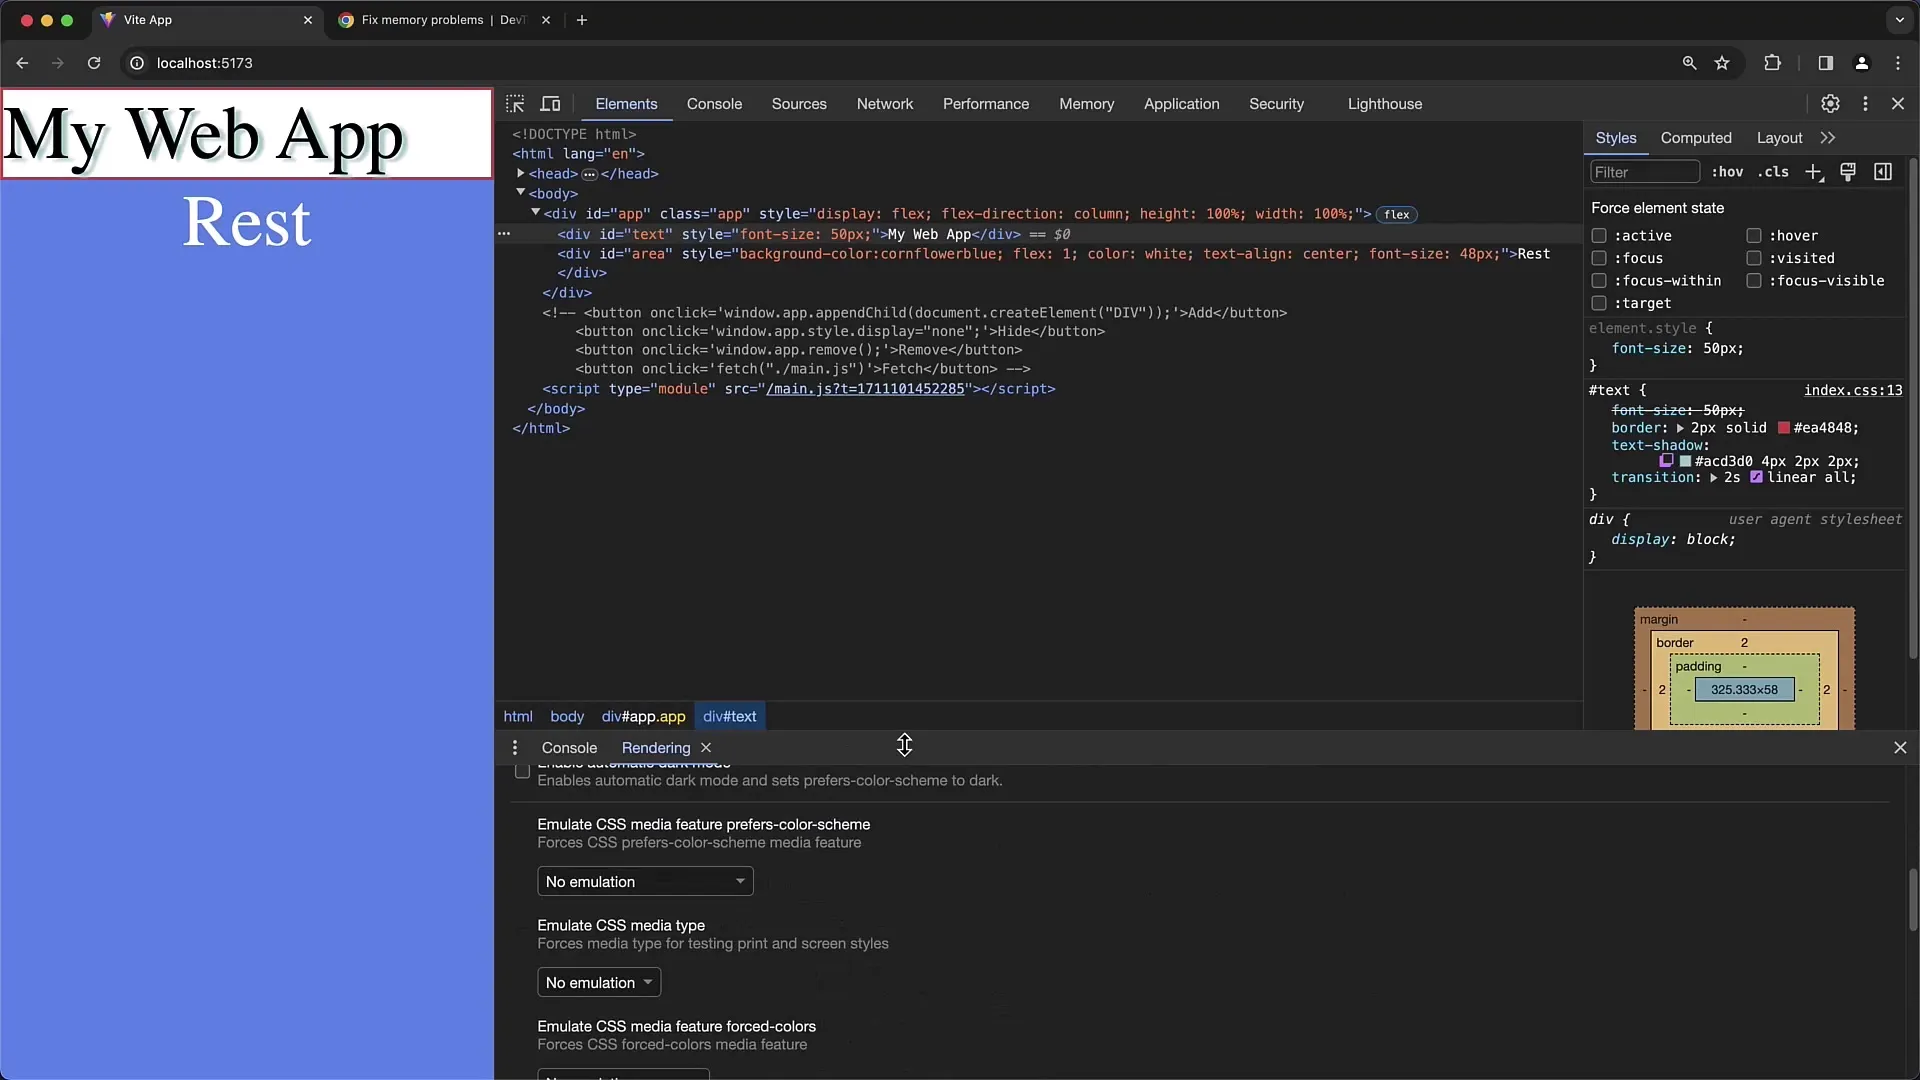
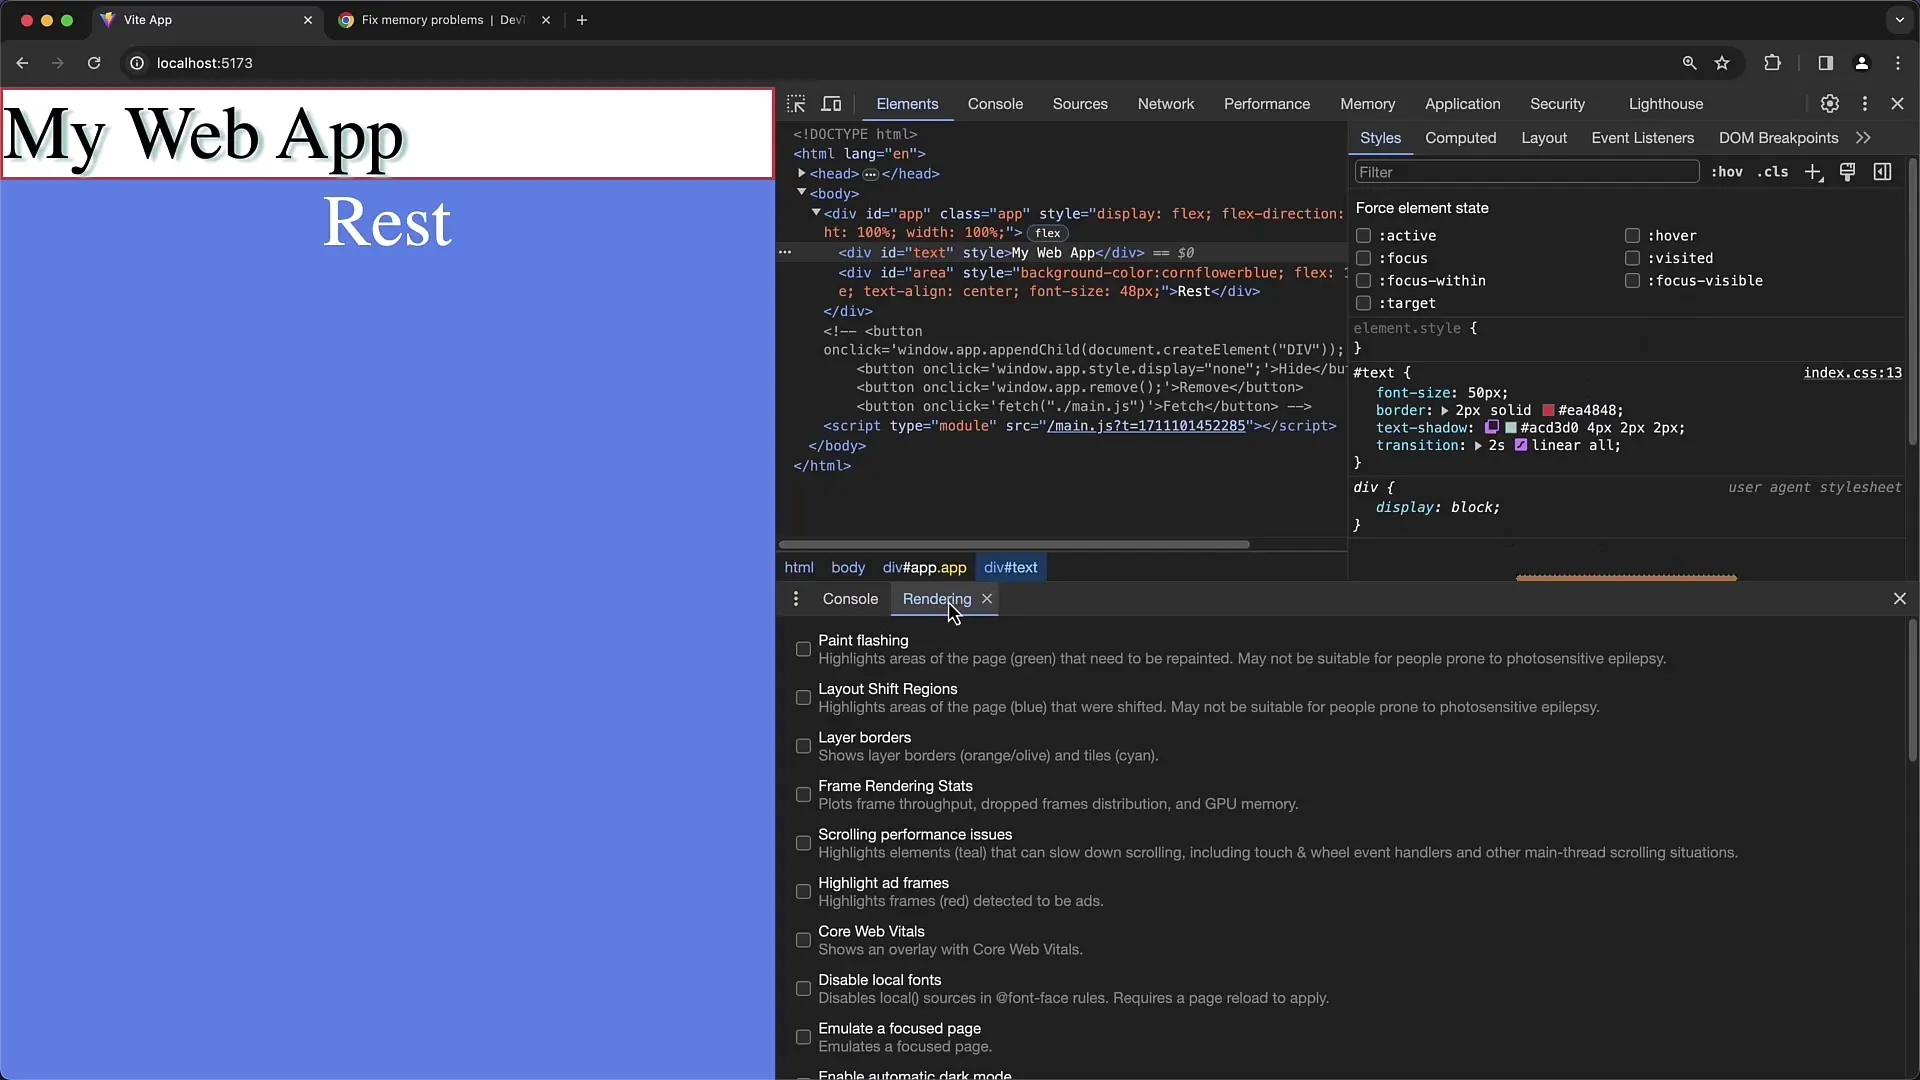
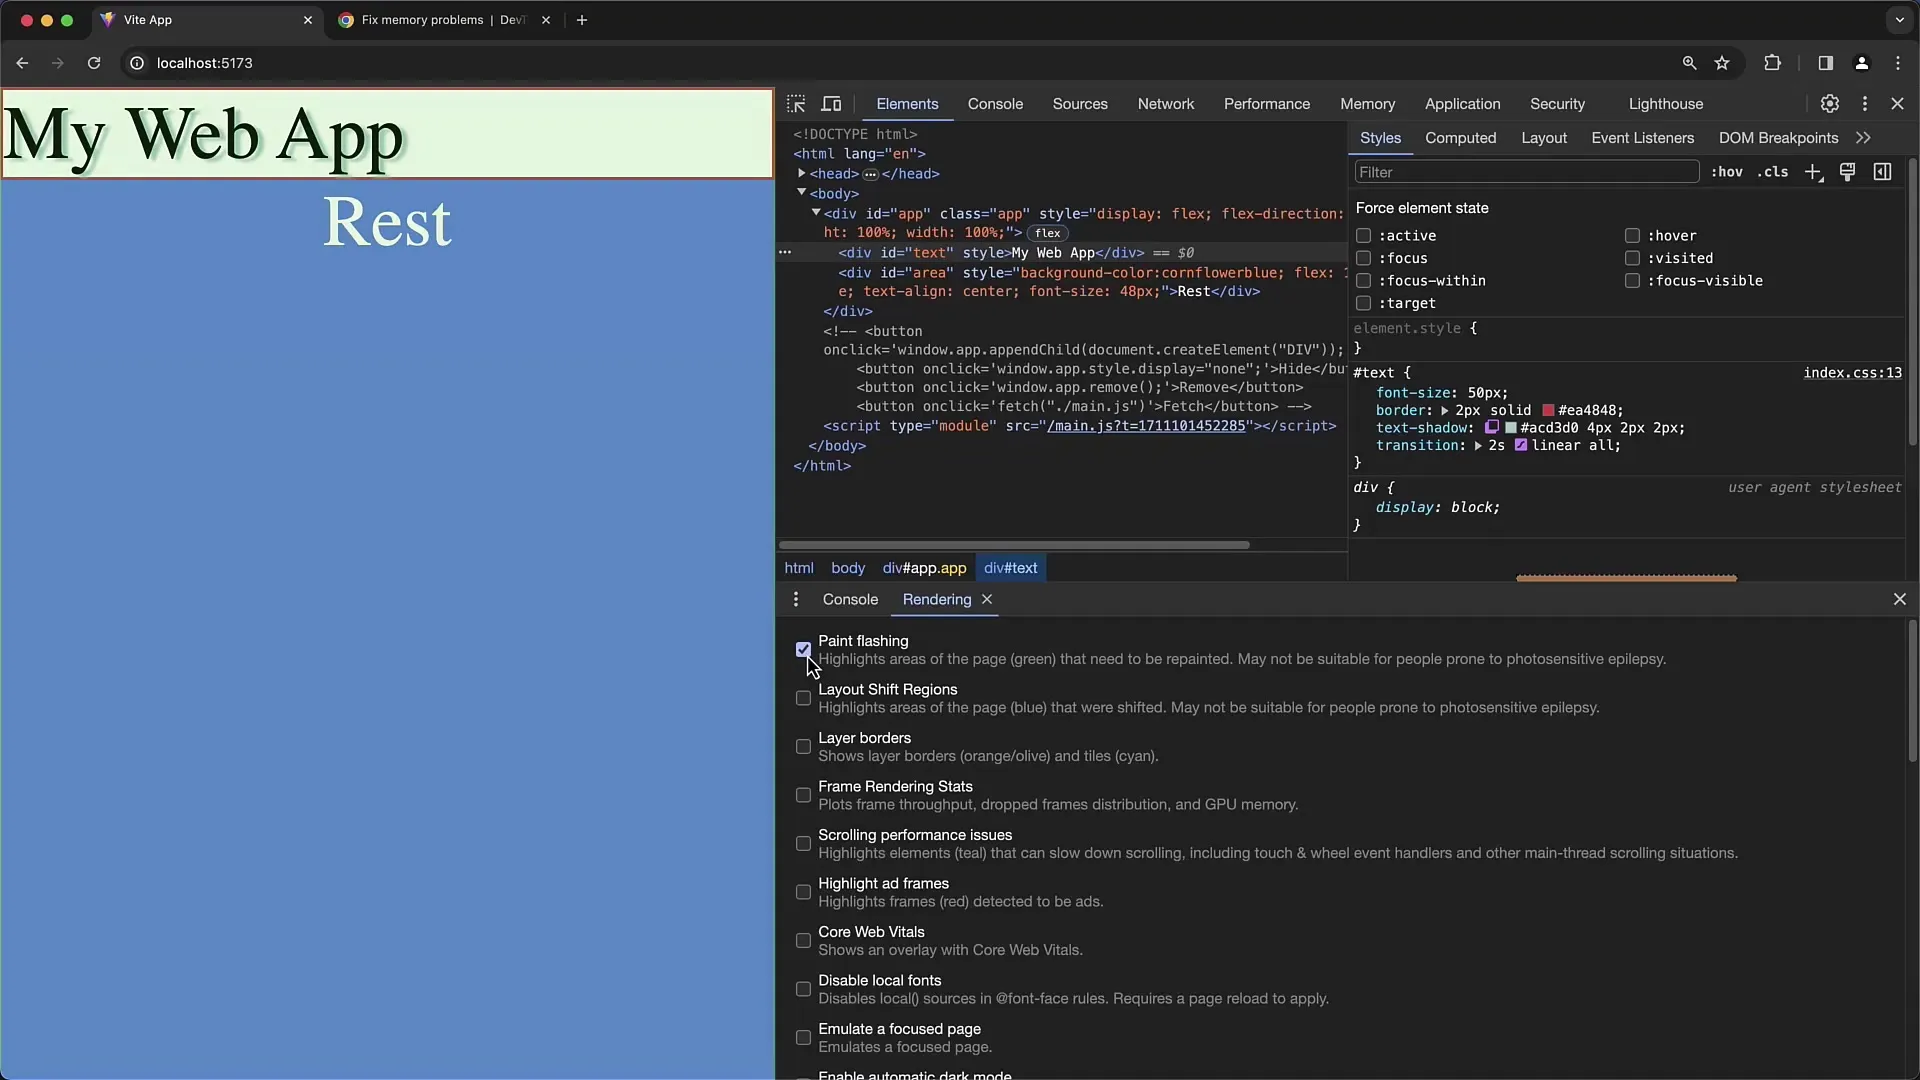
Now we get to the actual Rendering tab. You can move this to the top position of your Developer Tools as needed. In the Rendering tab, you will find numerous checkboxes and options that help you understand the process better and identify errors. One of the key features is the "Paint Flashing" mode, which shows you which areas of the page are currently being re-rendered.
Using Paint Flashing
Enable "Paint Flashing" to see which areas of the webpage are highlighted in green when navigating. This is helpful when making optimizations as it indicates where rendering issues occur or where animations are not running smoothly. If you see many parts of the page being unnecessarily rendered, this could be a hint of inefficient code.
Layer Border and Frame Rendering Stats
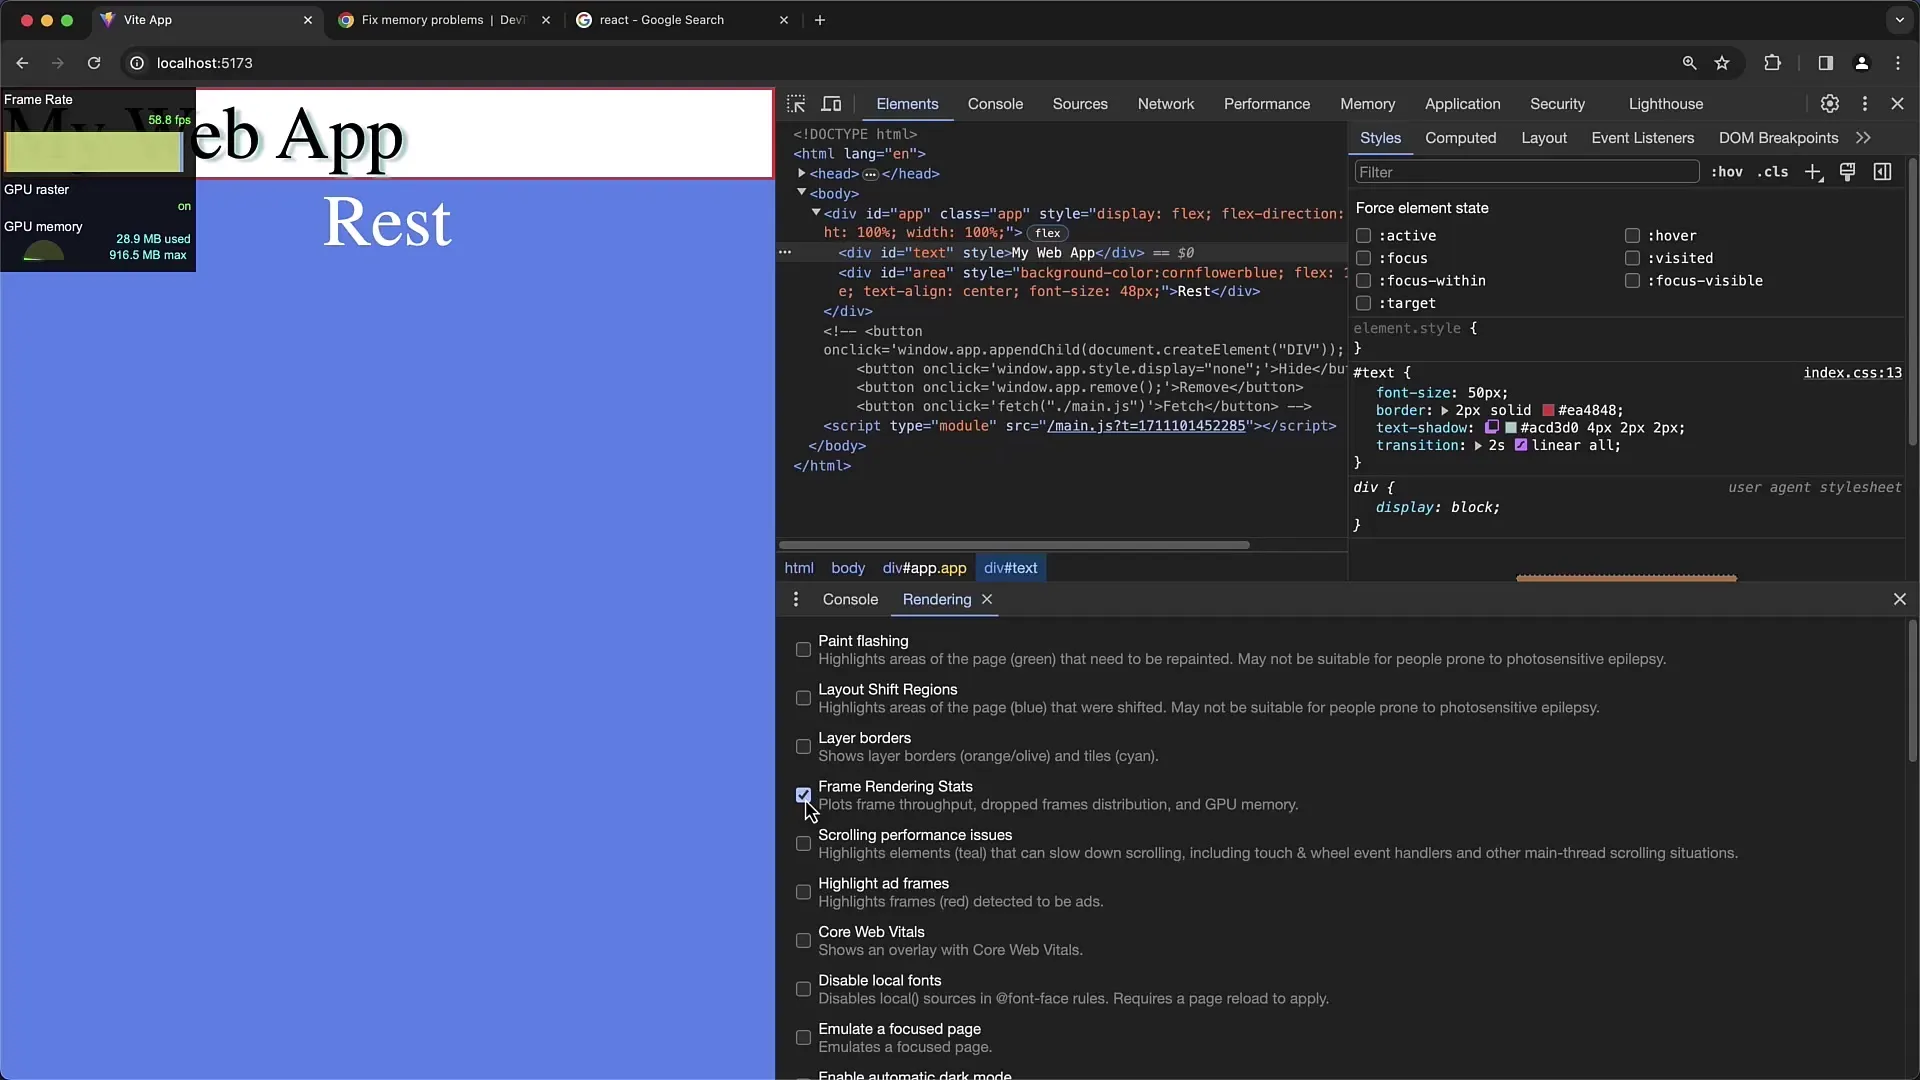
Another useful feature is the Layer Border display; this shows you the render parts used by the GPU. You can also analyze the Frame Rendering Stats to assess the performance of your animations. In this area, you can read how many frames per second (FPS) are rendered and if there are any bottlenecks that could affect performance.
Scrolling Performance
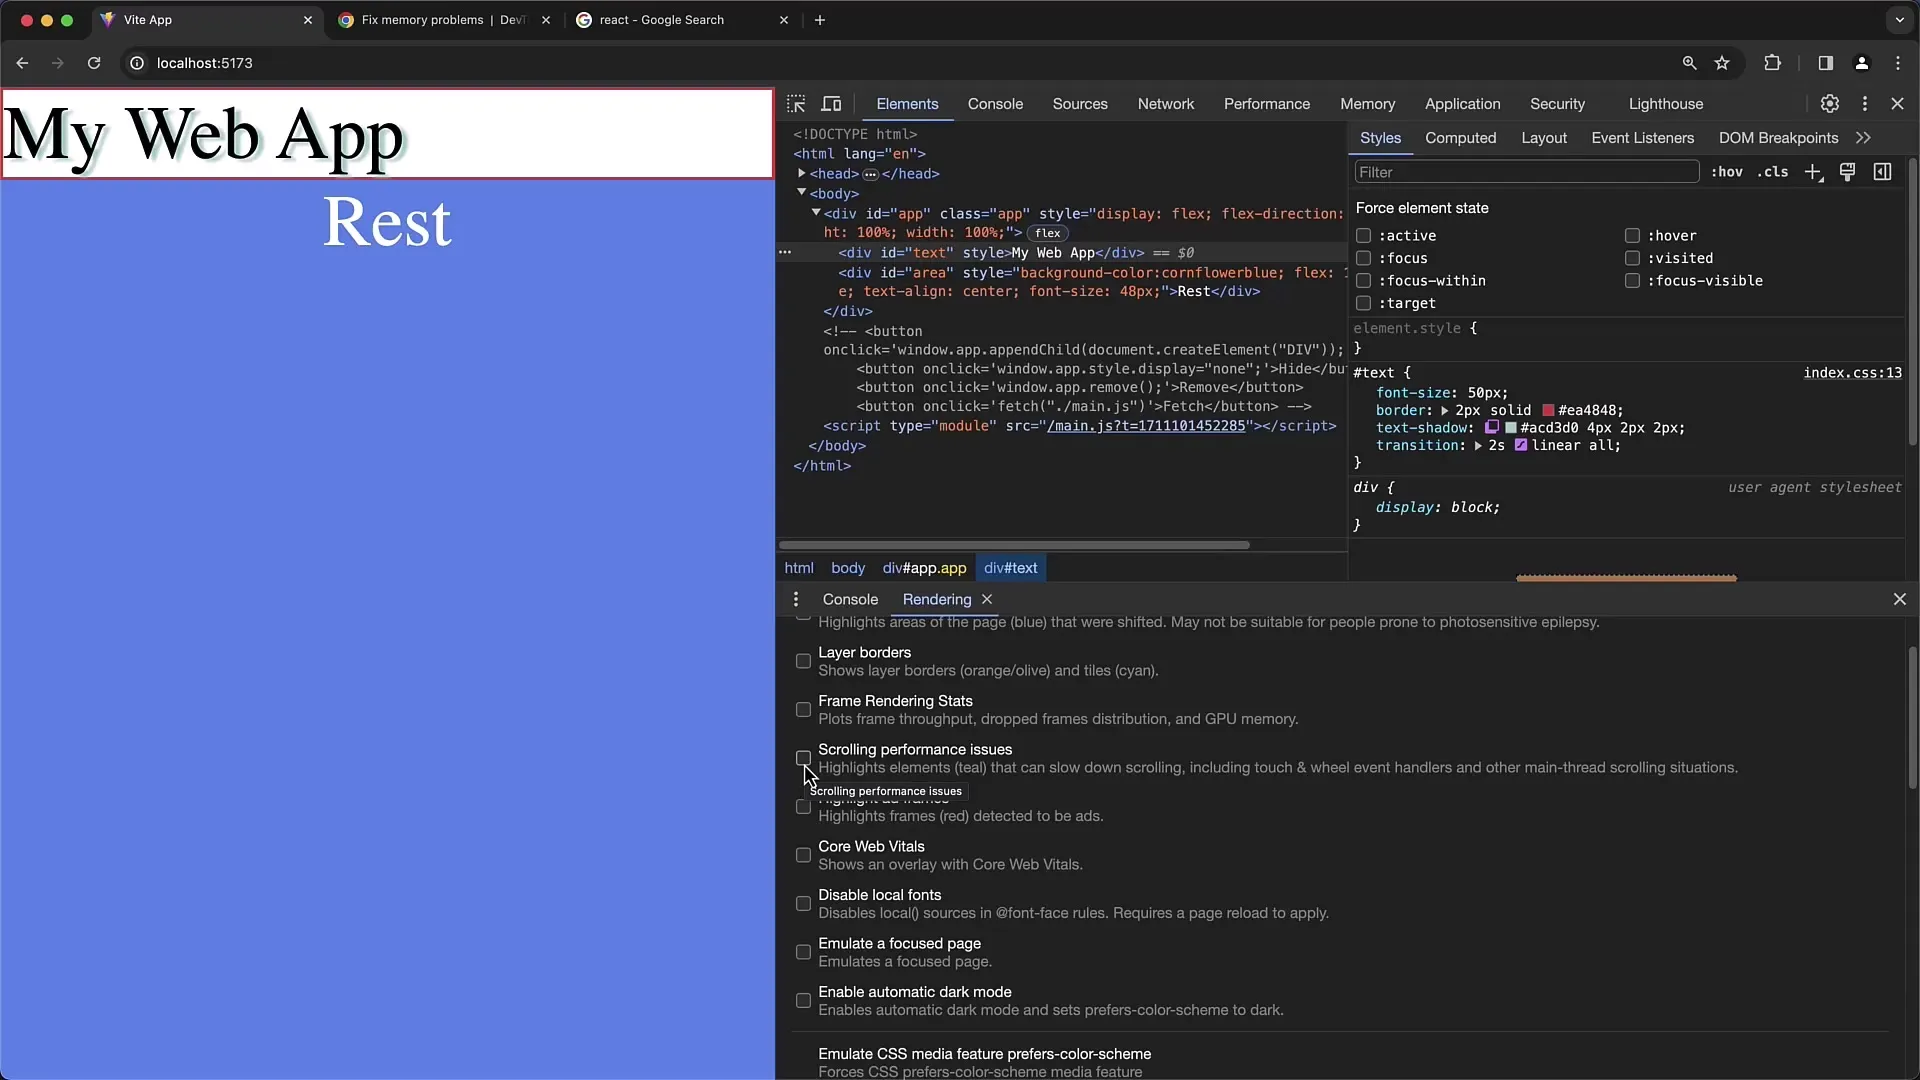
To optimize the perception of scrolling, enable the scroll performance option. This may help you identify any delays. This is particularly important for a pleasant user experience and should be monitored consistently.
Initial Design of Content and Interaction Delay
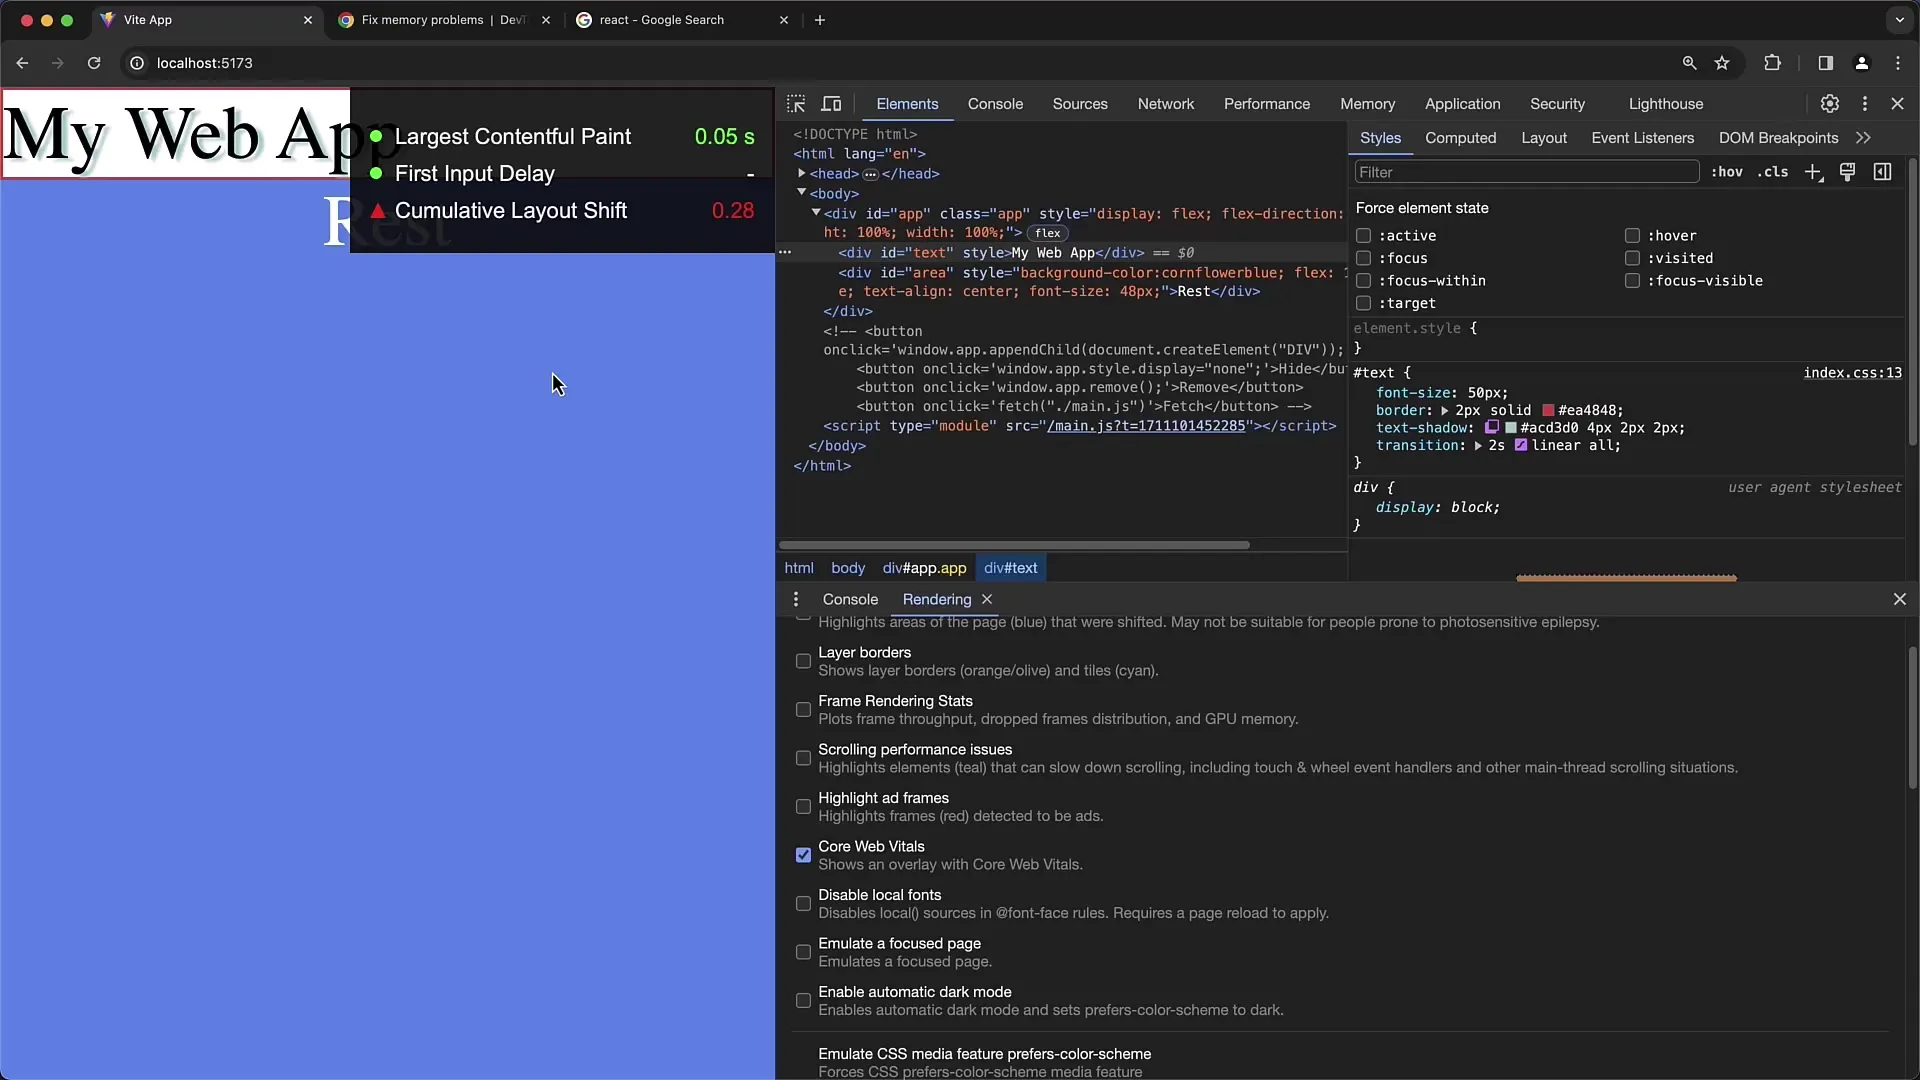
You can also measure the time until the largest content update occurs or the first interaction is possible. This gives you a clear insight into how quickly your page reacts when users load it. For example, it can be crucial for the page to respond in less than 100 milliseconds to ensure an optimal user experience.
Accessibility Tests
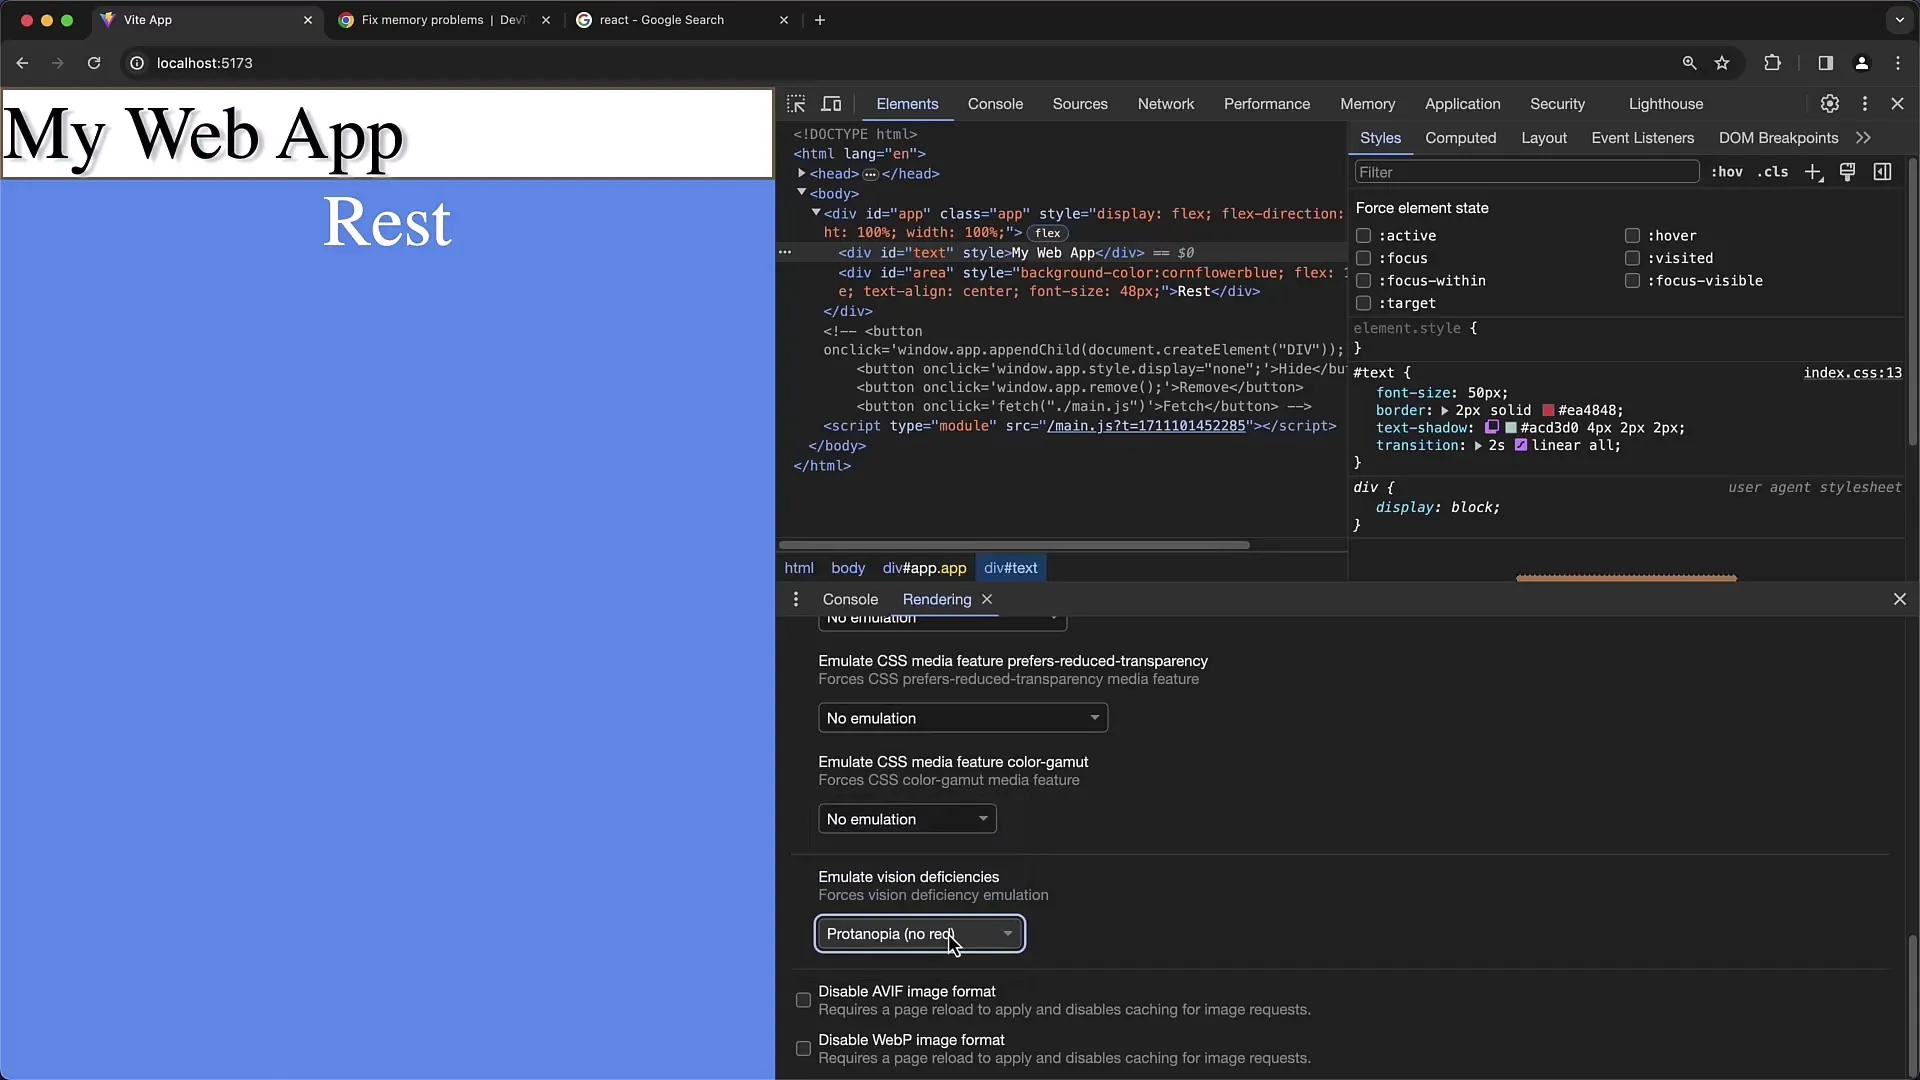
An extremely helpful feature for developers is the ability to simulate accessibility settings. You can see how your page looks for someone with limited vision capabilities. This includes simulating color blindness and contrast problems.

Font Management
The Rendering tab also allows you to deactivate local fonts that should be used by the browser. This is useful to ensure that the fonts are loaded from your web server or to identify potential conflicts between different fonts.
Summary
The Rendering tab in the Chrome Developer Tools is a fundamental tool for any web developer looking to optimize the performance and user experience of their websites. By understanding and applying the various functions, you can pinpoint and solve potential issues to make rendering smoother. From Flexbox editing to checking scroll performance and accessibility, this tab offers everything you need to optimize your website.
Frequently Asked Questions
How do I open the Rendering tab in Chrome Developer Tools?You can open the Rendering tab by opening the Developer Tools and navigating in the menu to "More tools" and then to "Rendering".
What is Paint Flashing and how do I use it?Paint Flashing is a feature that highlights all areas that are being re-rendered. You can activate it in the Rendering tab to facilitate debugging.
How can I check the performance of my animations?You can enable the Frame Rendering Stats to monitor the FPS of your animations.
How do I simulate accessibility on my website?In the Rendering tab, there are options to simulate constraints such as color blindness or other visual limitations.
What can I do if I see that many parts of my page are unnecessarily rendered?If you notice many unnecessary renderings, you should check your code for inefficiencies and introduce possible improvements.


