In this tutorial, you will learn how to effectively use the React Developer Tools browser add-on. React DevTools extends the Chrome developer tools with specific functions that help you better understand the structure of your React components, inspect their props and state. This comprehensive introduction will show you how to install the add-on and apply it in your daily development.
Key Takeaways
- You should install the React Developer Tools to effectively analyze your React component structure in Chrome.
- You gain insight into props, state, and the hierarchy of your components.
- Using the Profiler tool can help you identify performance issues in your application.
Step-by-Step Guide
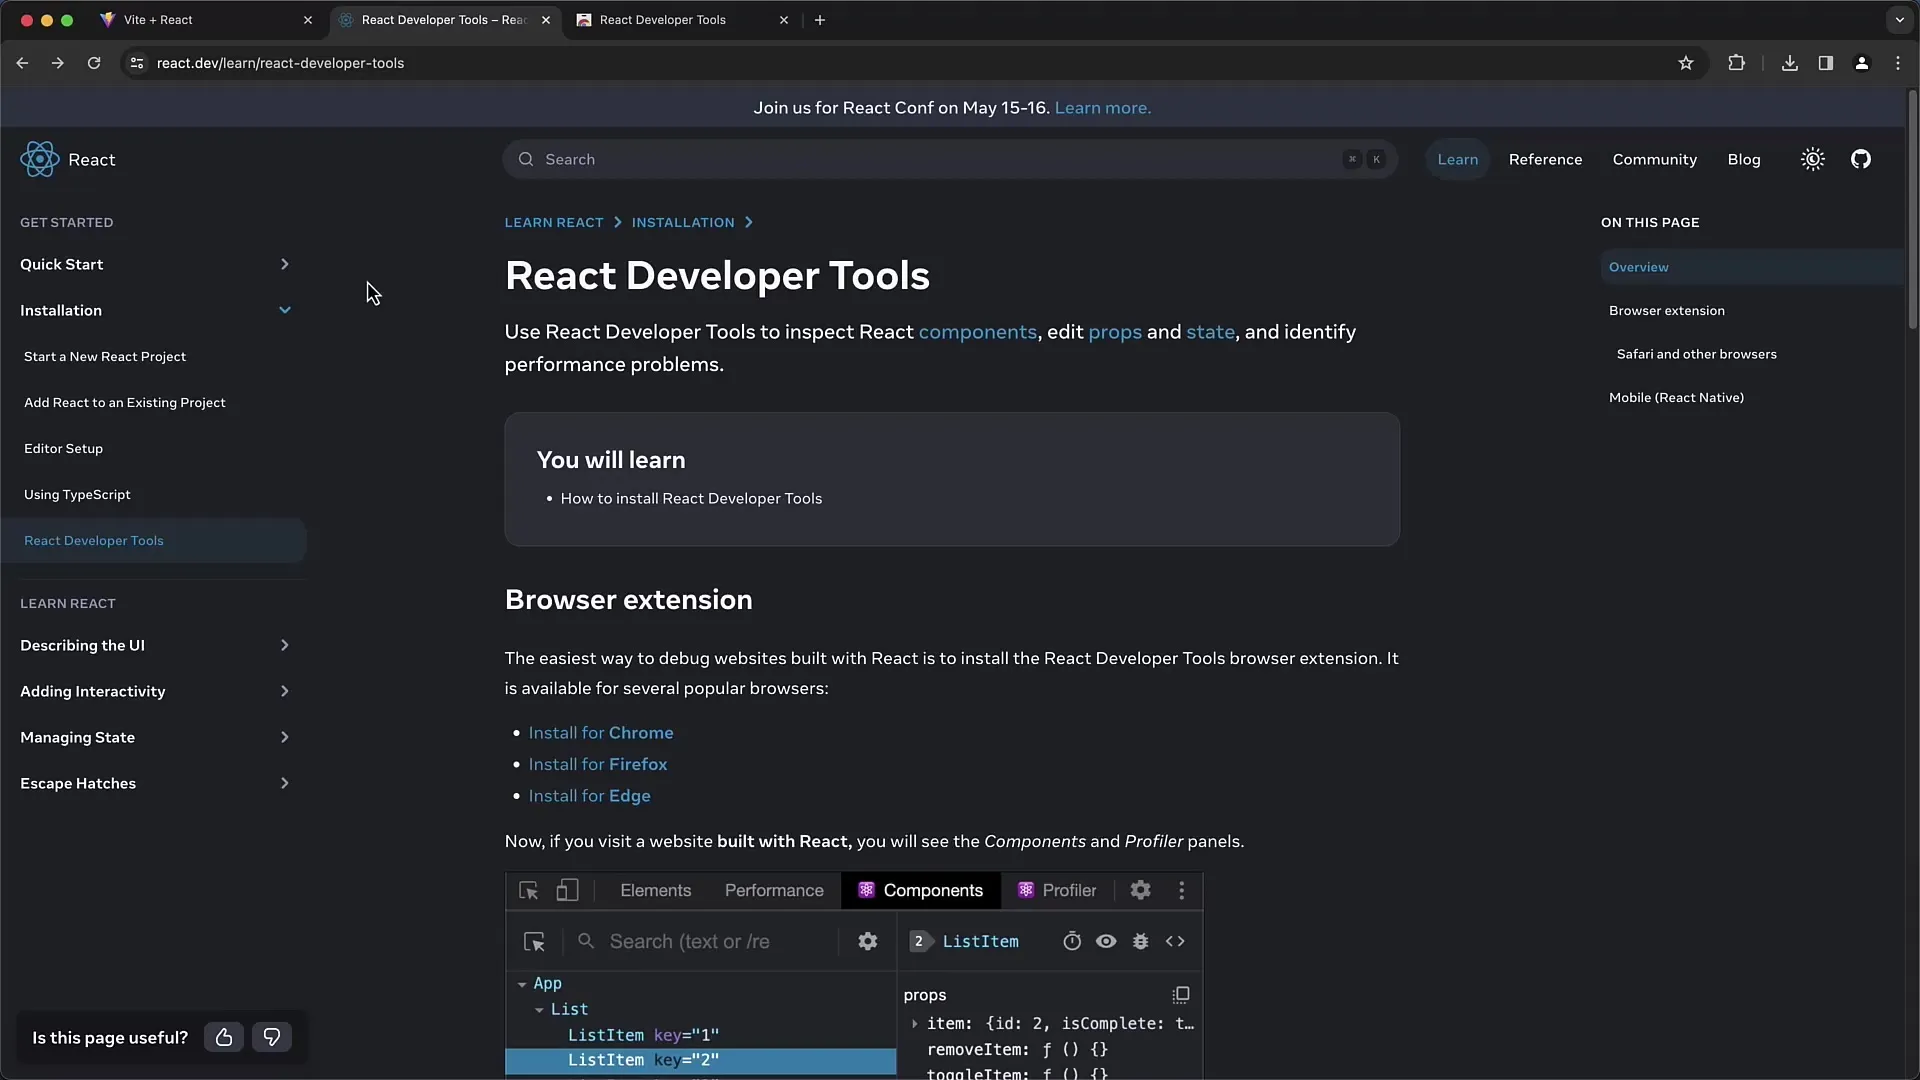
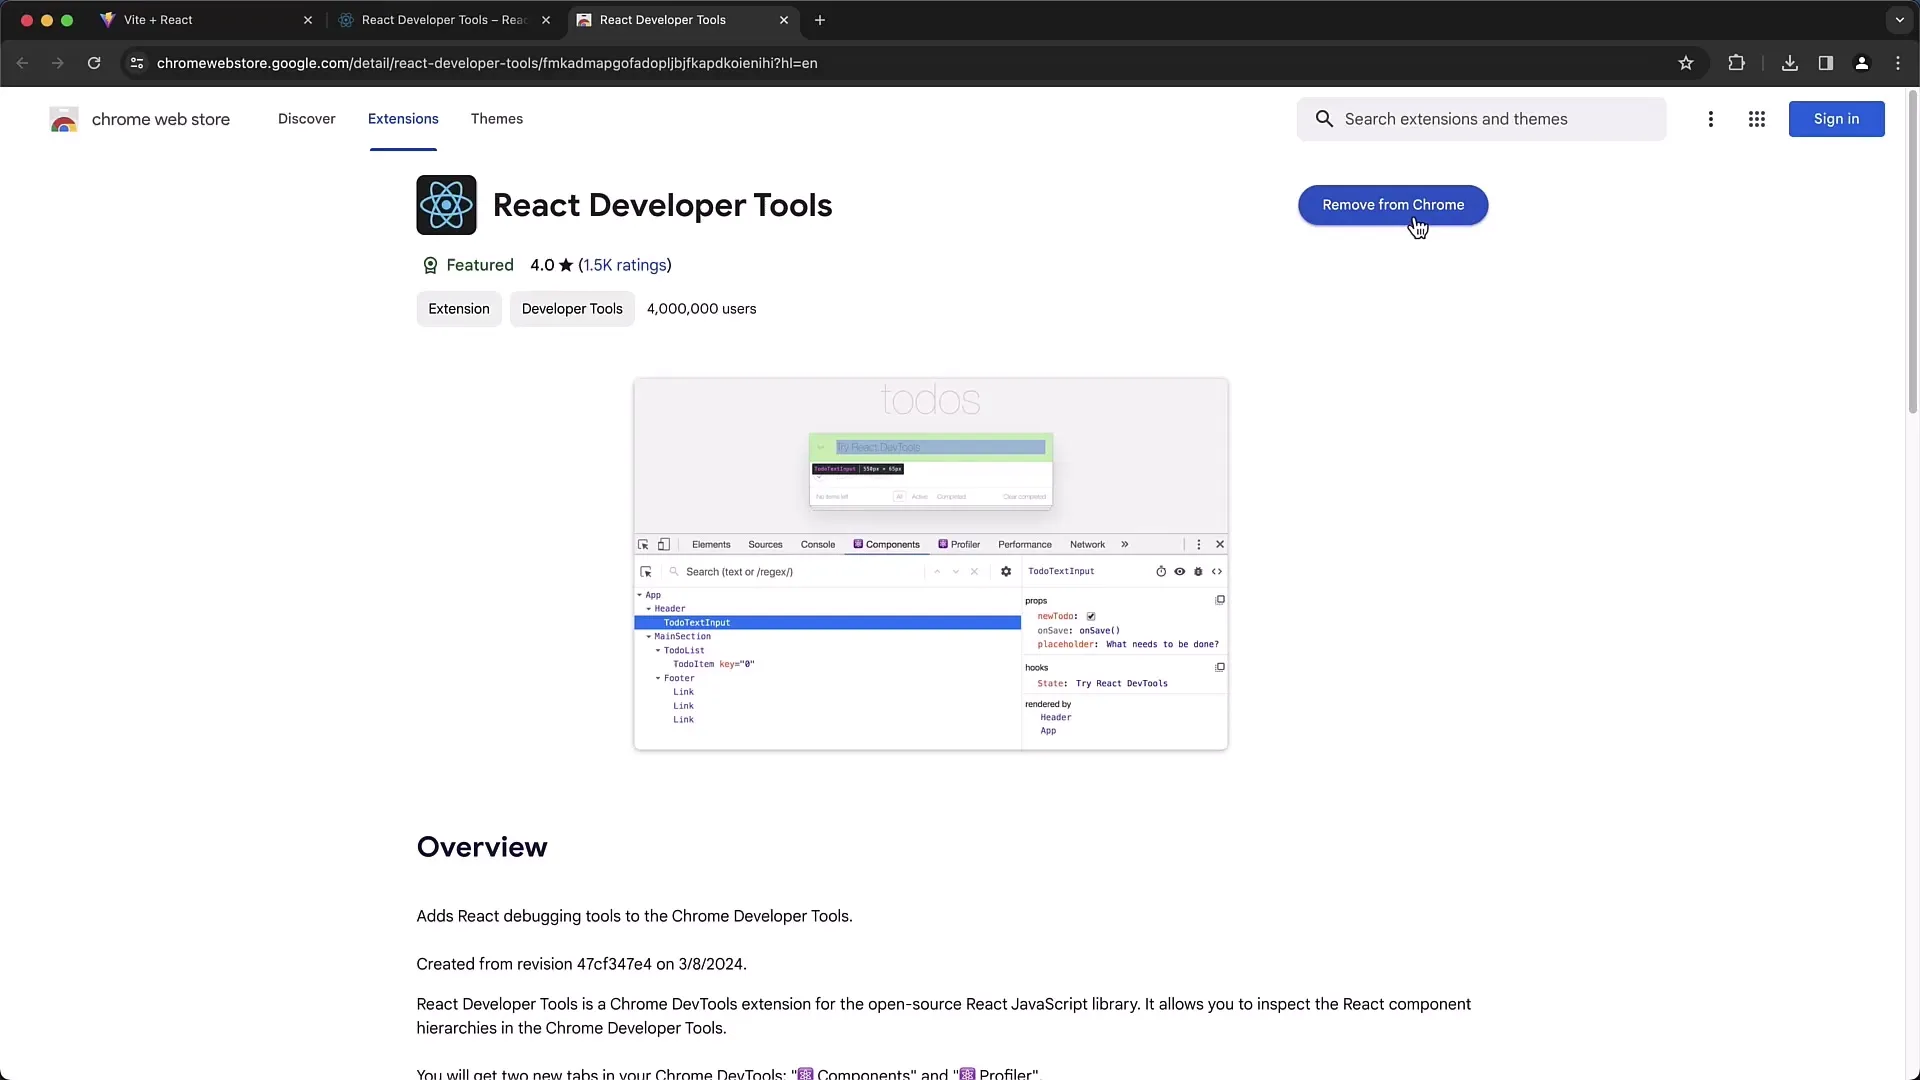
First, you need to install the React Developer Tools in the Chrome browser. Go to the React website at react.dev for installation information. Here you will find information on installing the add-on for various browsers. For Chrome, select "Install in Chrome" and you will be redirected to the Chrome Web Store.
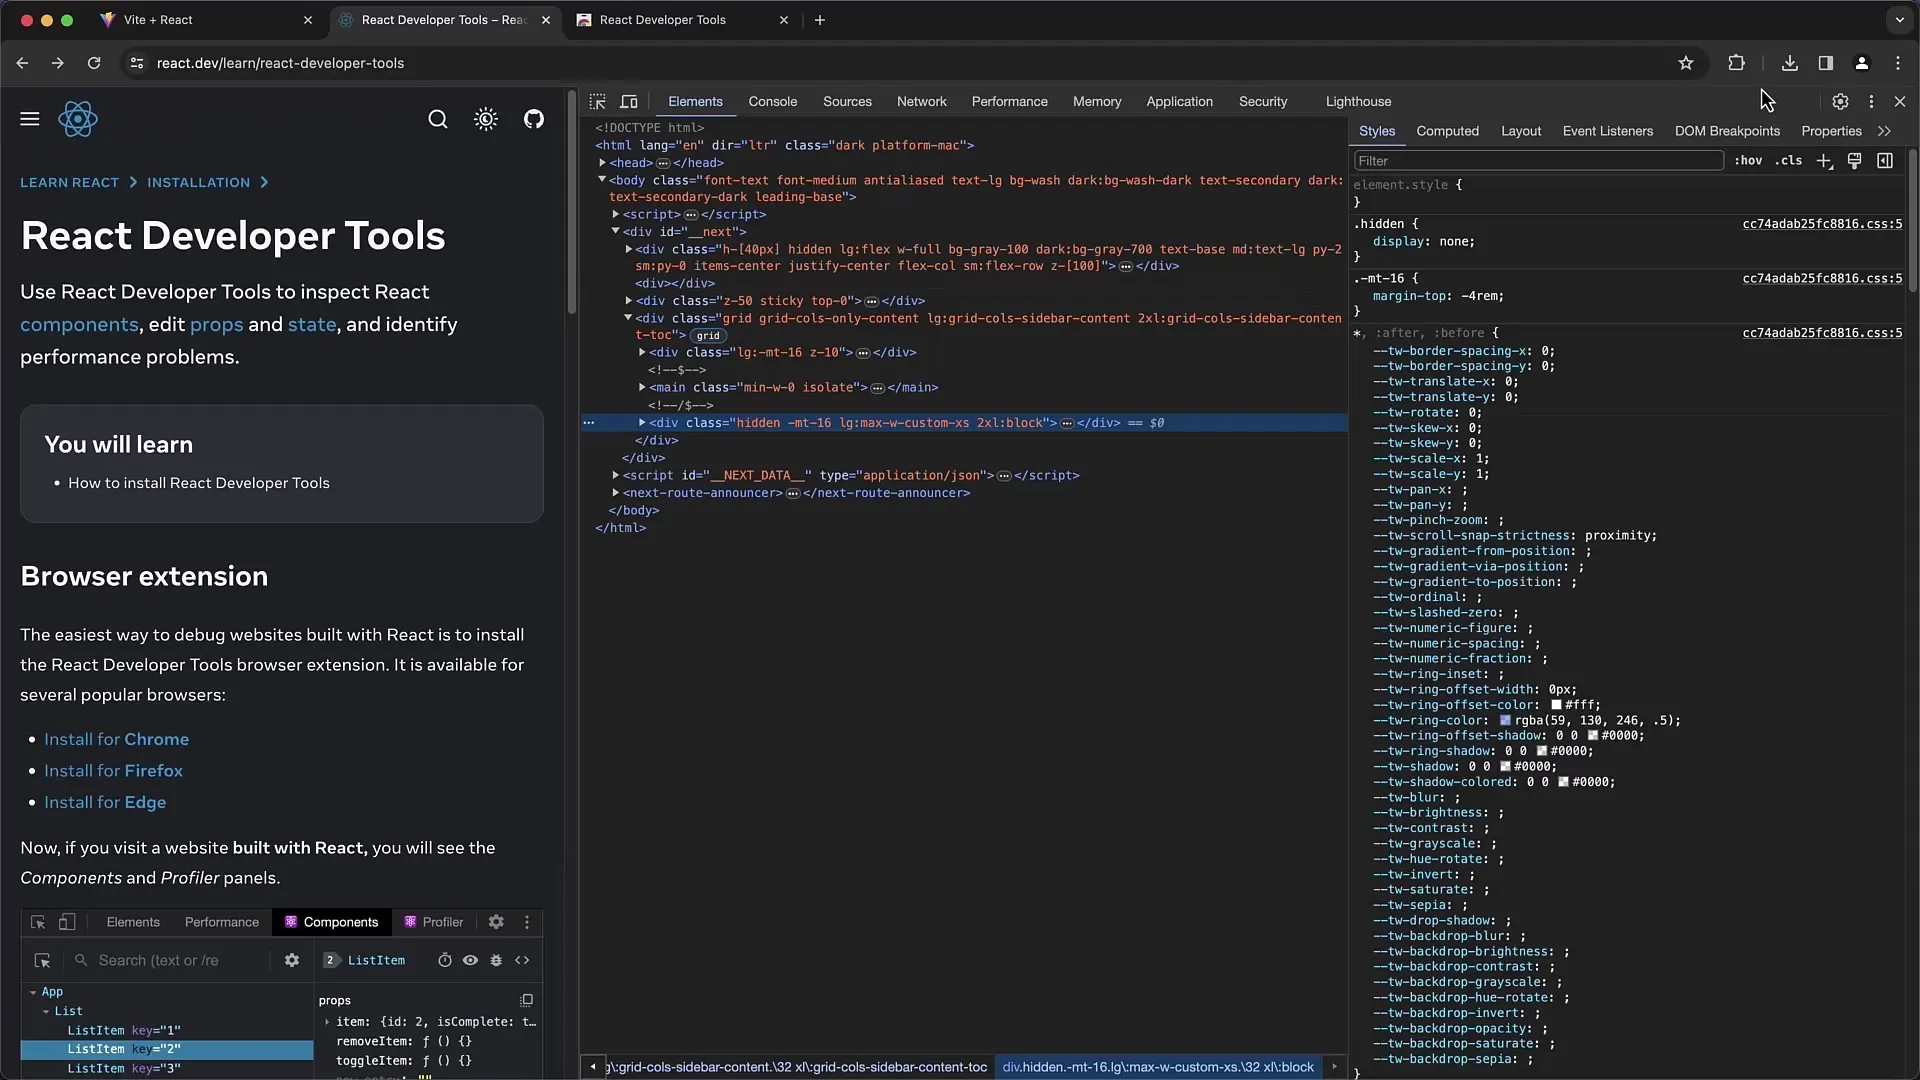
To use the extension, after installation, make sure you have granted access to the DevTools. Open the developer tools (F12) and click on the "Extensions" tab to confirm the required permissions. Refresh the page to make the new tabs visible in the DevTools.
After installation, you should see two new tabs in the Chrome Developer Tools: "Components" and "Profiler." Click on "Components." Here you can inspect the hierarchy of your React components and their props. While analyzing the website, you may notice that the component names may be abbreviated or minified, as you may be working in a production environment.
If you want to inspect a particular component, you can click on the three-dot menu in the developer tools interface and go to "Select element." Click on the corresponding component on the page, and it will be highlighted, showing you immediately in the DevTools where it resides within the React hierarchy.

By clicking on different components, you gain access to all props assigned to those components. For example, you will see the "classname" indicating which CSS classes are used for styling the component. The context from which the component originates will also be displayed.
When working with your own React applications, make sure to use debug builds instead of minified production versions. This way, you can obtain more important information about the component names and their structure. For example, in the "Components" tab of the React DevTools, you can see your app component and the nested components such as the "Entry" component.

Now let's move on to the "Profiler" functionality of the React DevTools. This feature is particularly useful for monitoring the performance of your application. You can start a profiling process by clicking the "Start Profiling" button. Add some elements to create render operations, then click "Stop."
In the profiling area, you can get an overview of all render operations, their durations, and the reasons they occurred. For example, if you see that a component is being rendered frequently, it may indicate performance issues that need detailed analysis.

When you view the "Flame Graph" view, you can trace the individual components and their render operations. By simply clicking, you can access more detailed information on each render operation.
To further improve your application's performance, you should also enable the re-render highlights. In the settings of the React DevTools, you can activate this feature to display visual cues during component rendering. This helps you identify which parts of your application are frequently updated and where optimization is needed.
Keep in mind the other features in the DevTools. There may be additional useful features that can assist you in your development process. Familiarize yourself with the various settings and their benefits.
Summary
In this guide, you have learned how to install and use the React Developer Tools. The DevTools provide valuable insights into the structure and performance of your React applications. You can monitor props, state, and render operations to optimize your application. Try out the features presented and explore how they can help you in your projects.


