This tutorial is about effectively utilizing the Chrome Developer Tools and its settings. You will learn how to configure the DevTools to match your working style. Topics such as the appearance of the tools, keyboard shortcuts, and other function settings are highlighted. With these practical adjustments, you can significantly optimize your workflow and work more efficiently.
Key Insights
- You can customize the appearance of the Developer Tools by switching between light and dark themes.
- The language of the Developer Tools can be changed to avoid confusion from translated terms.
- JavaScript source maps are useful for debugging. They should be turned on or off as needed.
- There are numerous useful settings for the console to control the display of log messages.
Step-by-step Guide
Access Settings
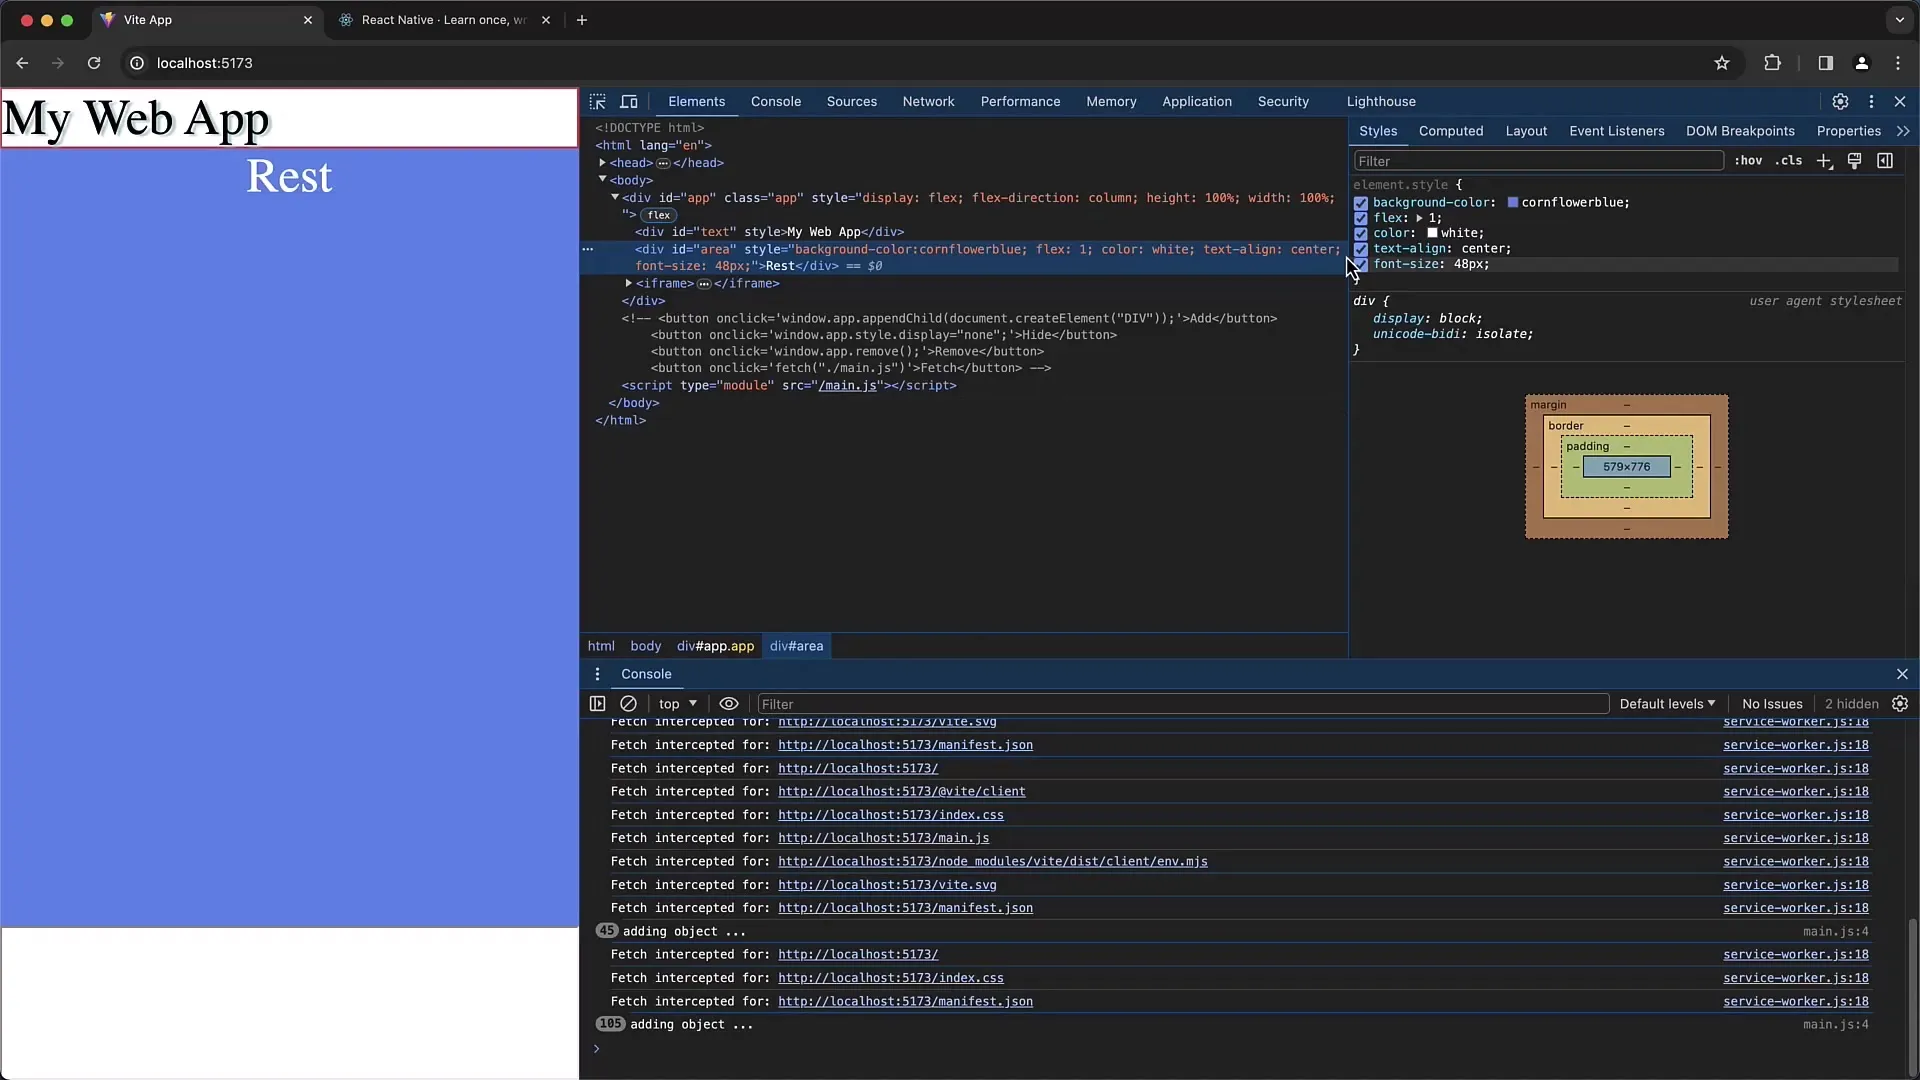
To open the settings of Chrome Developer Tools, click on the gear icon in the top right corner of the DevTools. There you will find a variety of customization options.
Customize Appearance
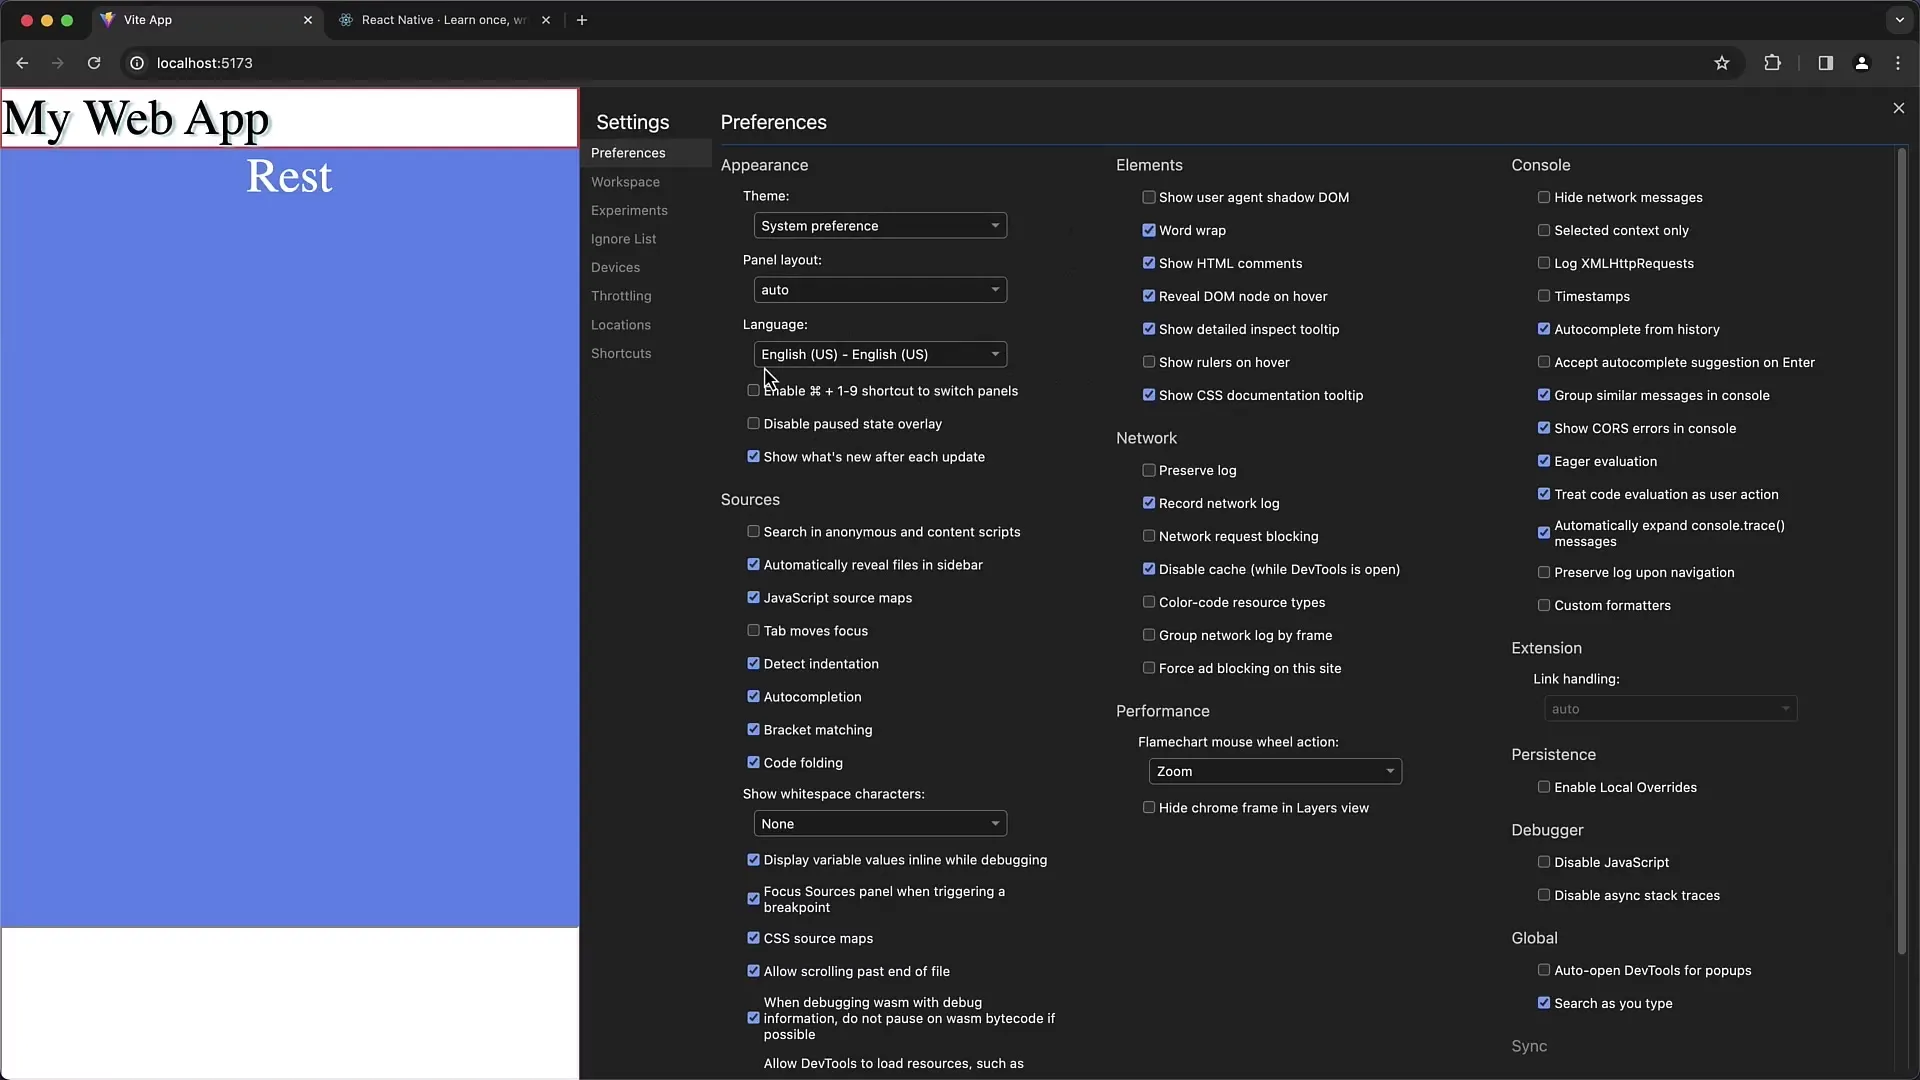
In the settings, you can choose between light and dark themes under the "Appearance" tab. This can make working more pleasant, especially in different lighting conditions. You can also set your preferred theme based on your computer's system settings.
Adjust Language
The language of the DevTools can be changed in the settings. Here, you can set the display to English, for example, to avoid translation issues with certain terms.
JavaScript Source Maps
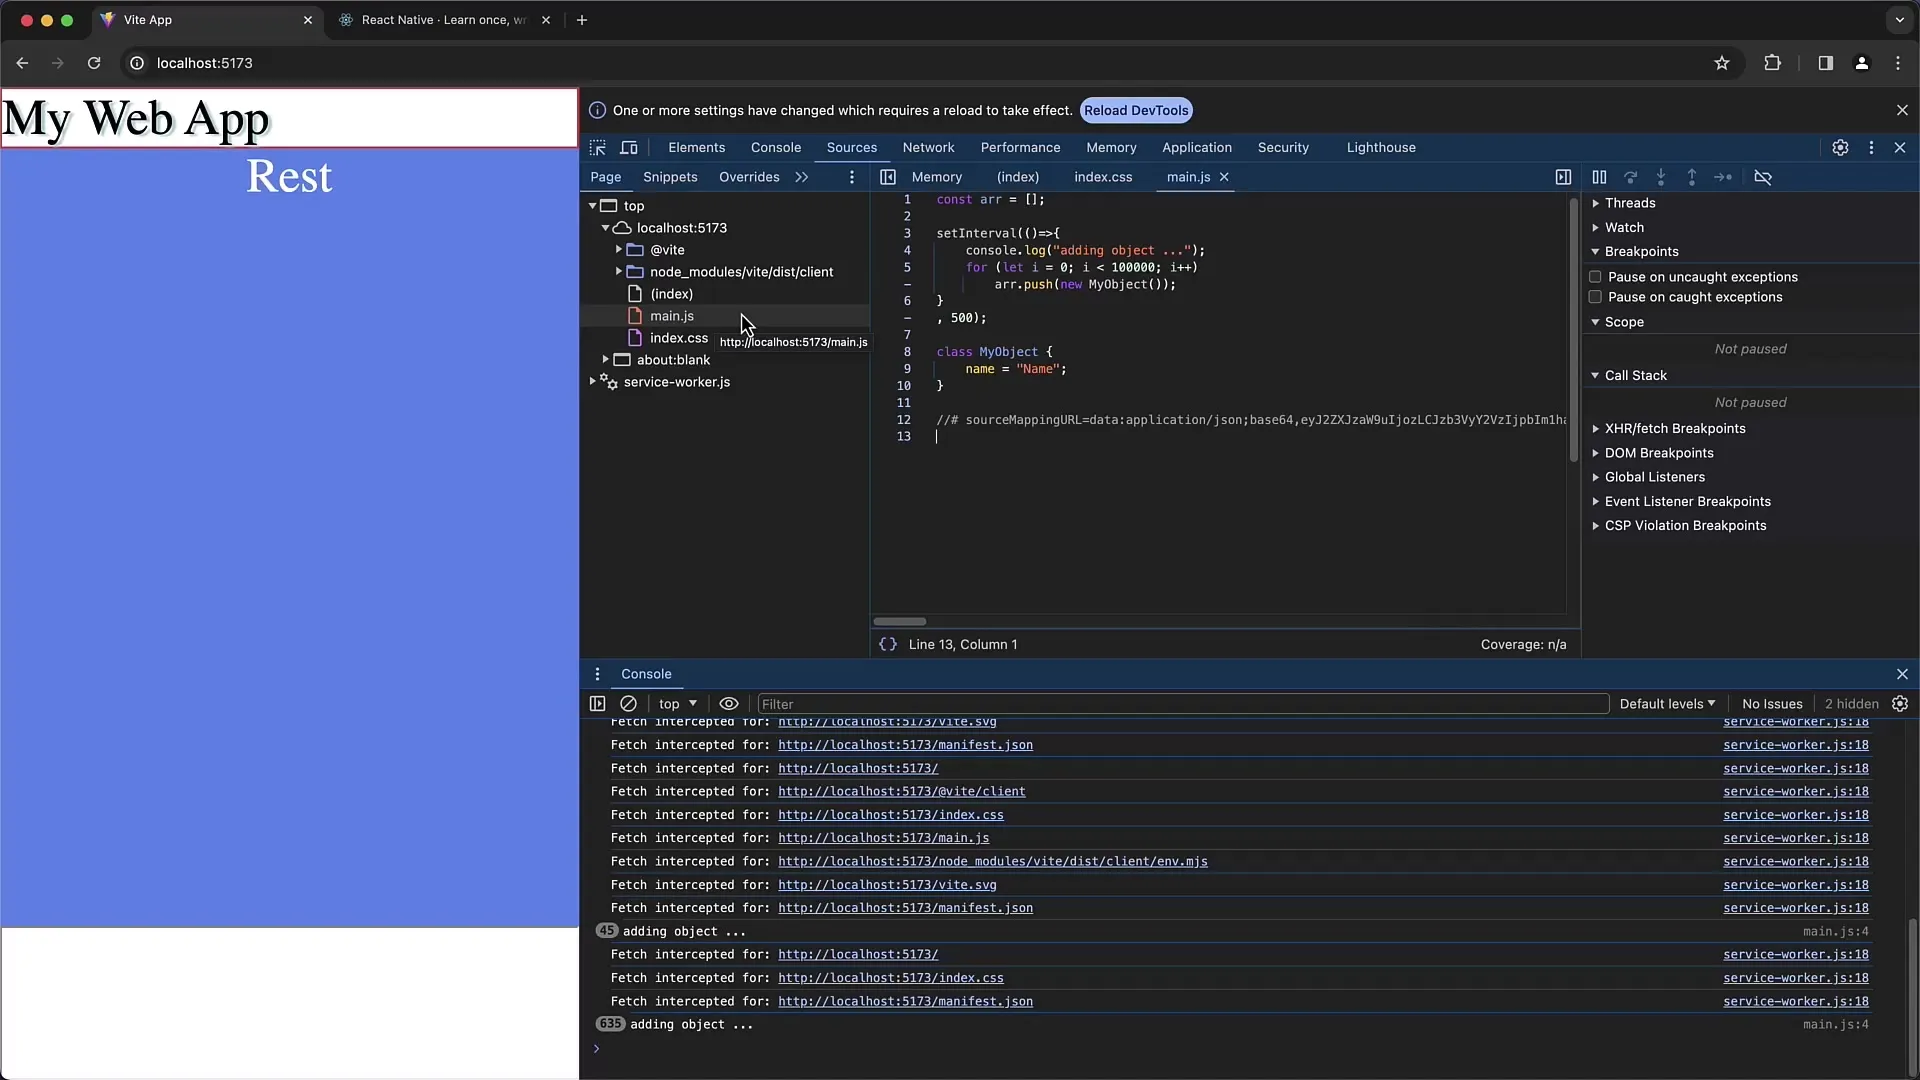
In the "Preferences," you can enable or disable JavaScript source maps. Source maps are particularly helpful for viewing the original code during debugging. Be sure to turn them on or off as needed, especially if you are having trouble reaching the correct lines.
Pretty Print
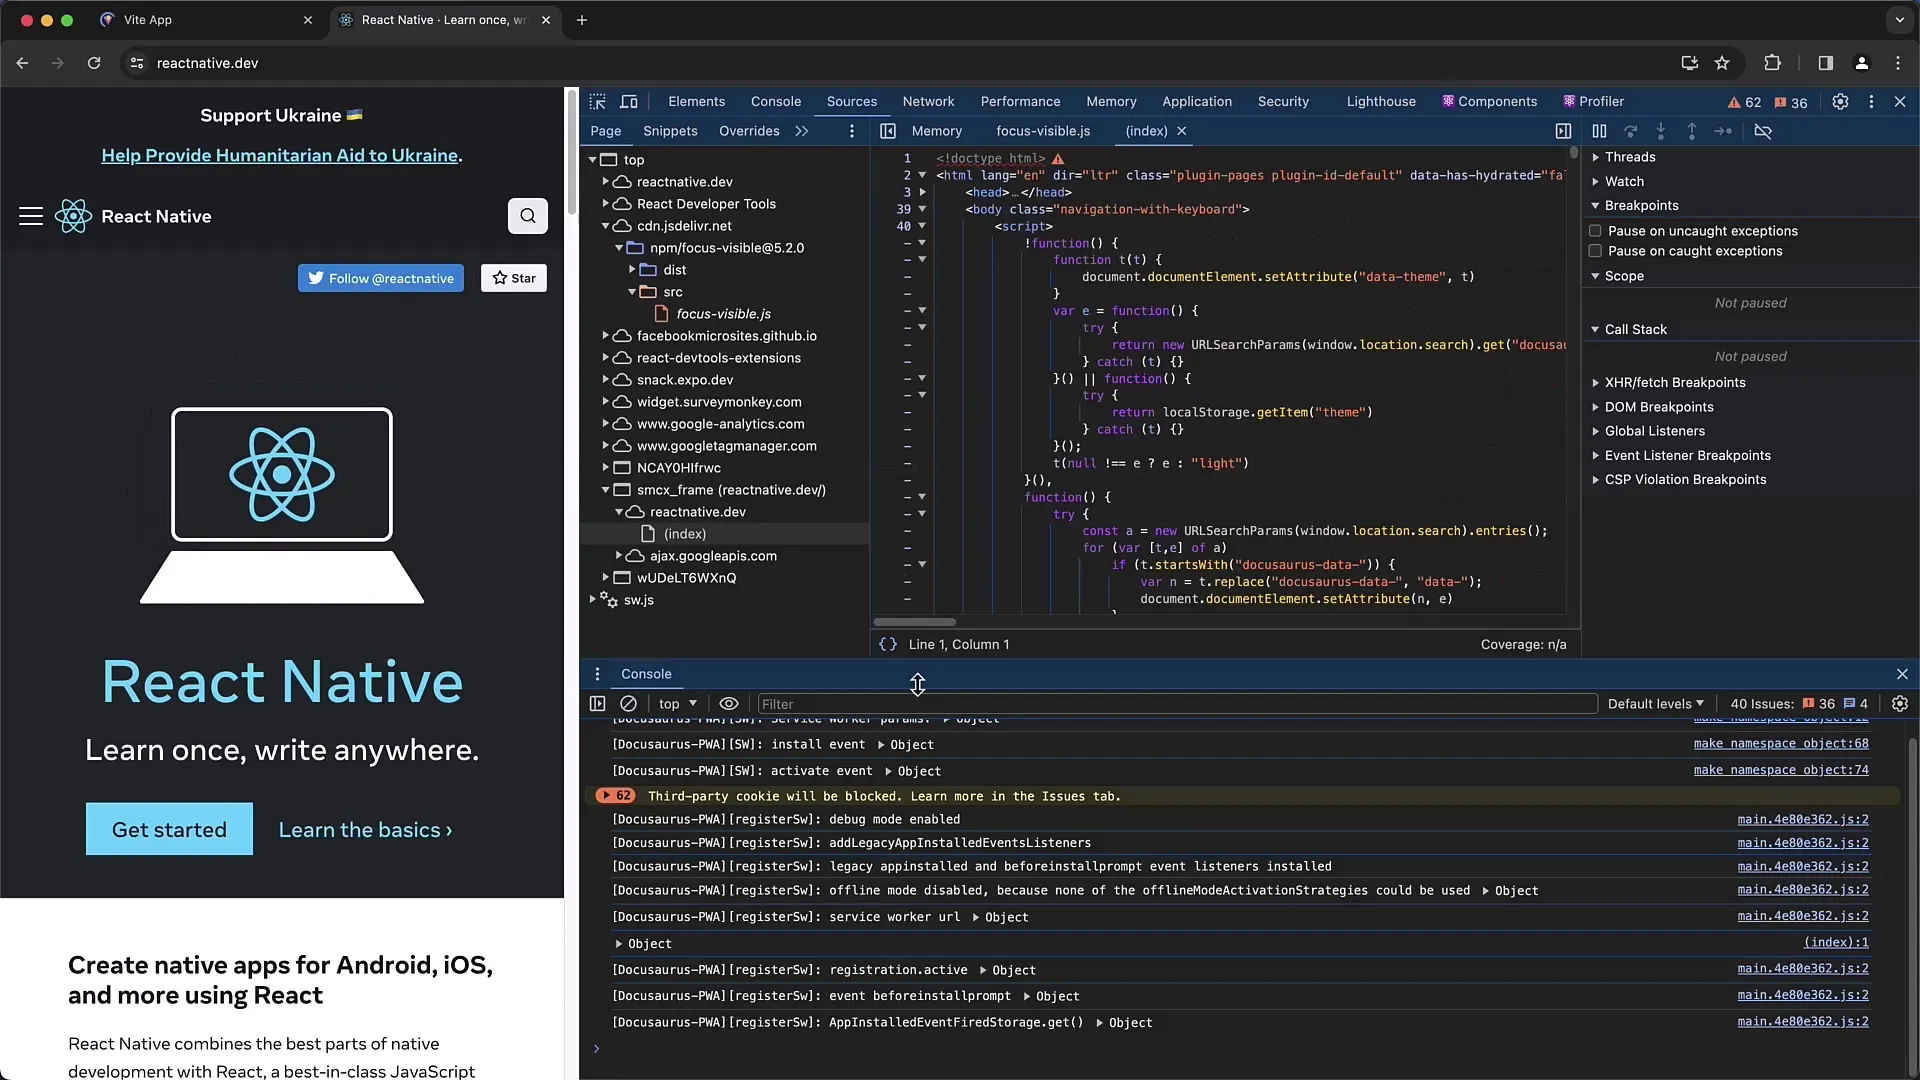
With the "Pretty Print" feature, you can convert minified JavaScript into a more readable format. This is useful when working with obfuscated code. You can activate this option in the source information.
Show Whitespace Characters
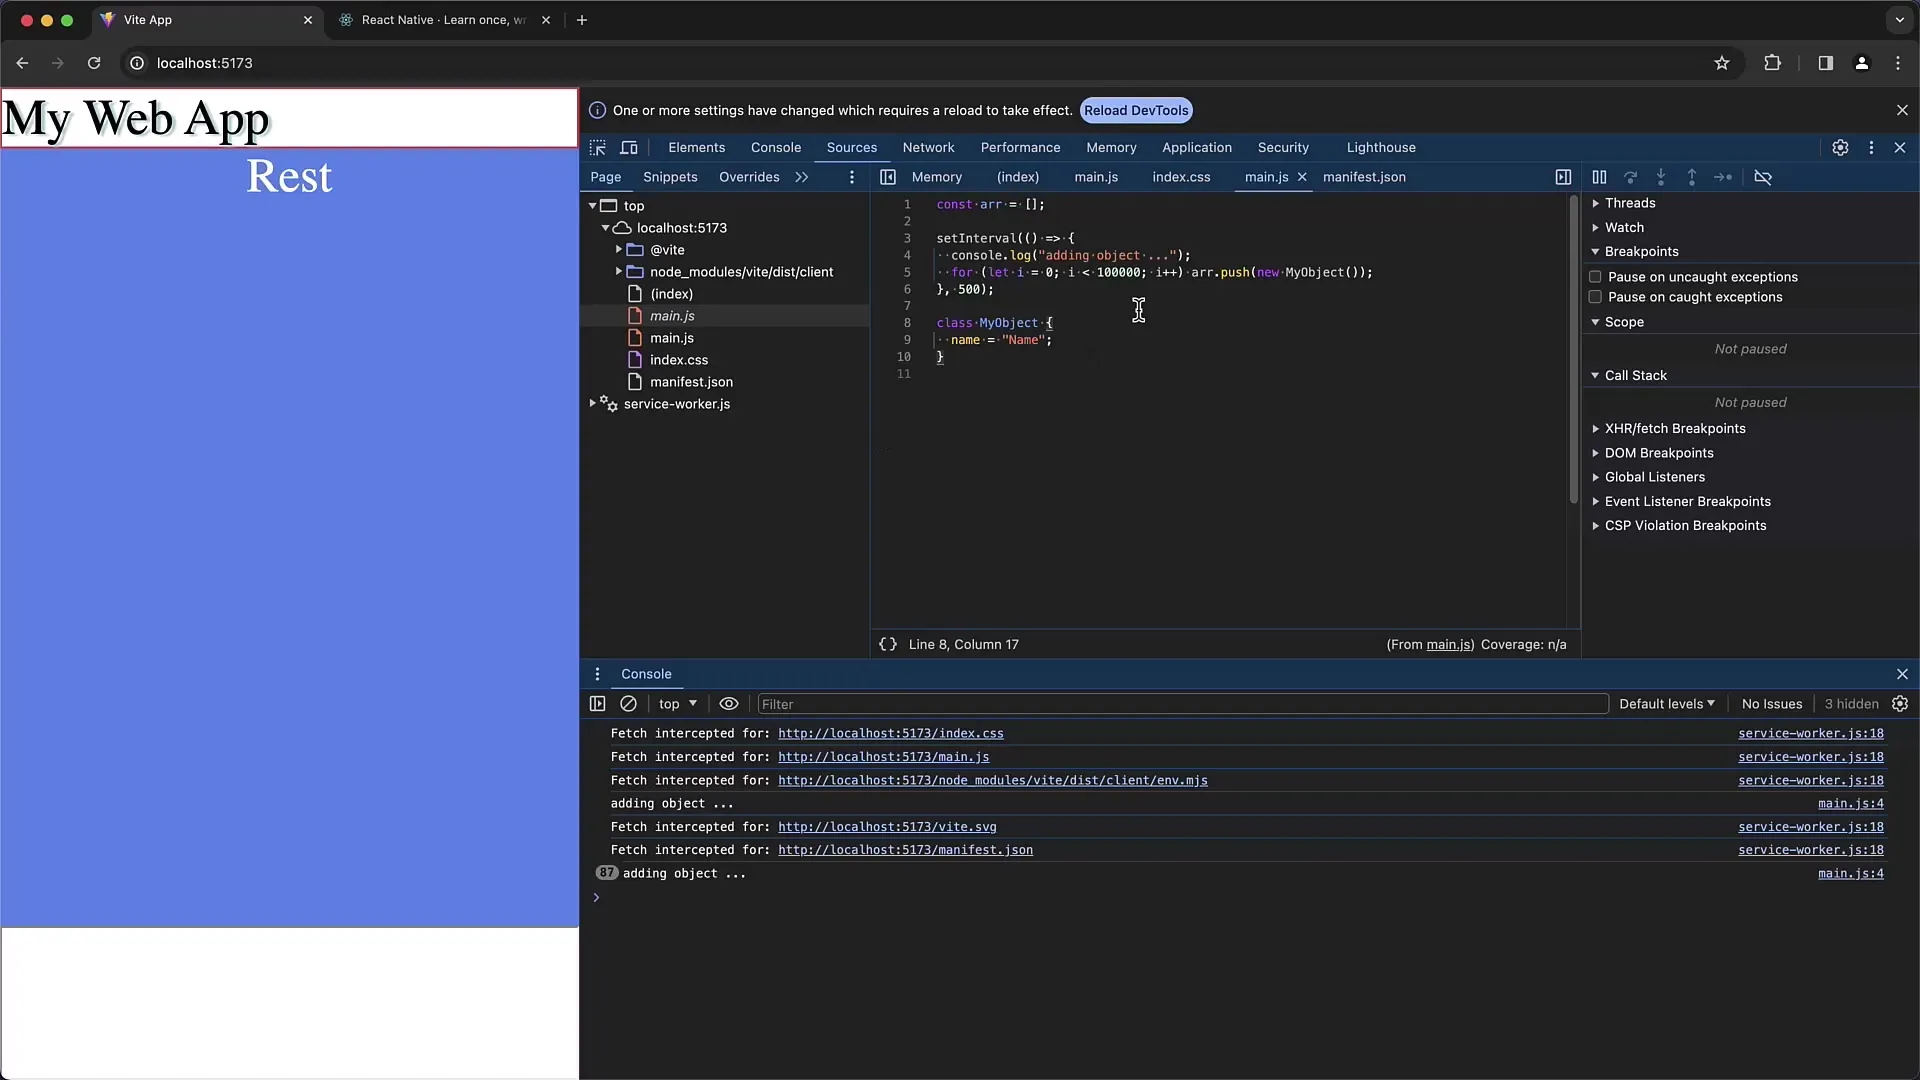
In the settings, you can also enable whitespace characters. This can be helpful to display spaces and other invisible characters in your code that could potentially cause issues.
Inline Debugging Options
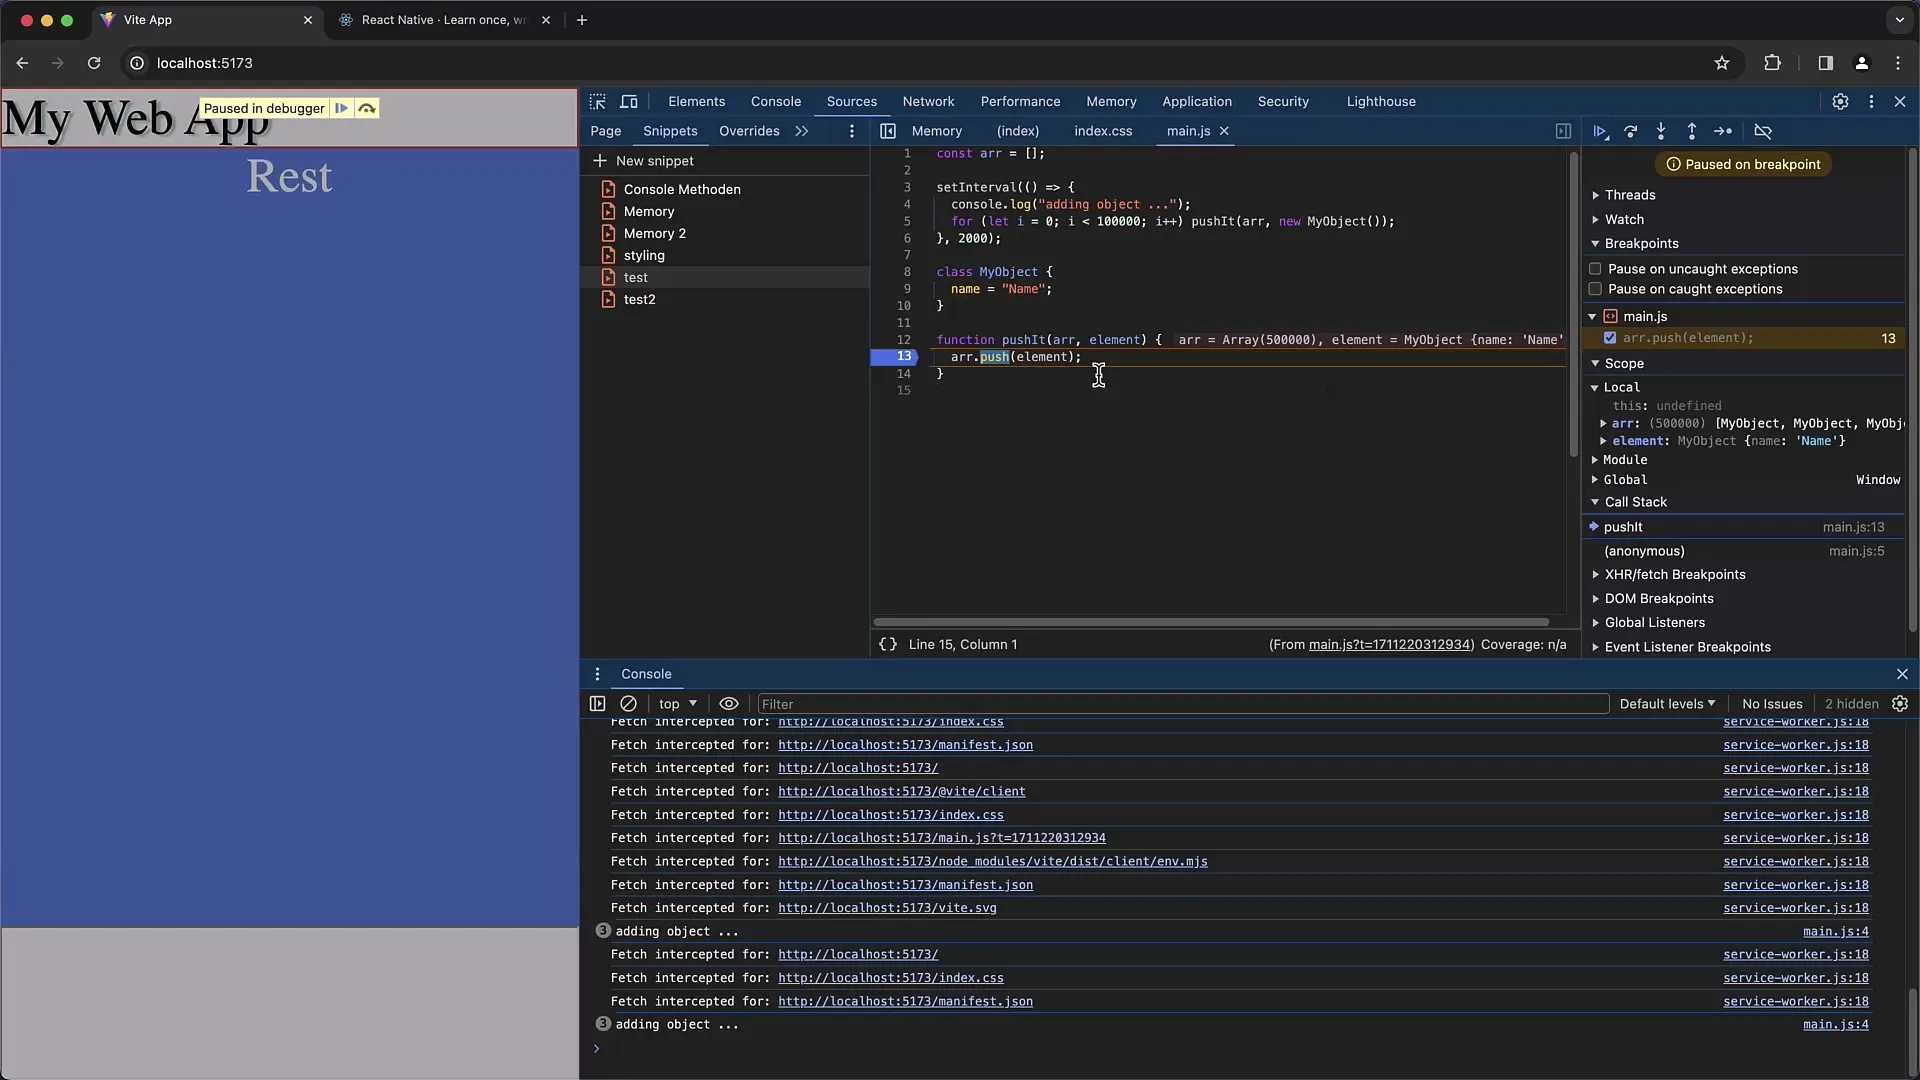
In the "Preferences," there is an option to adjust the display of variable values during debugging. You can enable or disable this display, depending on whether it is useful for you.
Customize Shortcut Keys
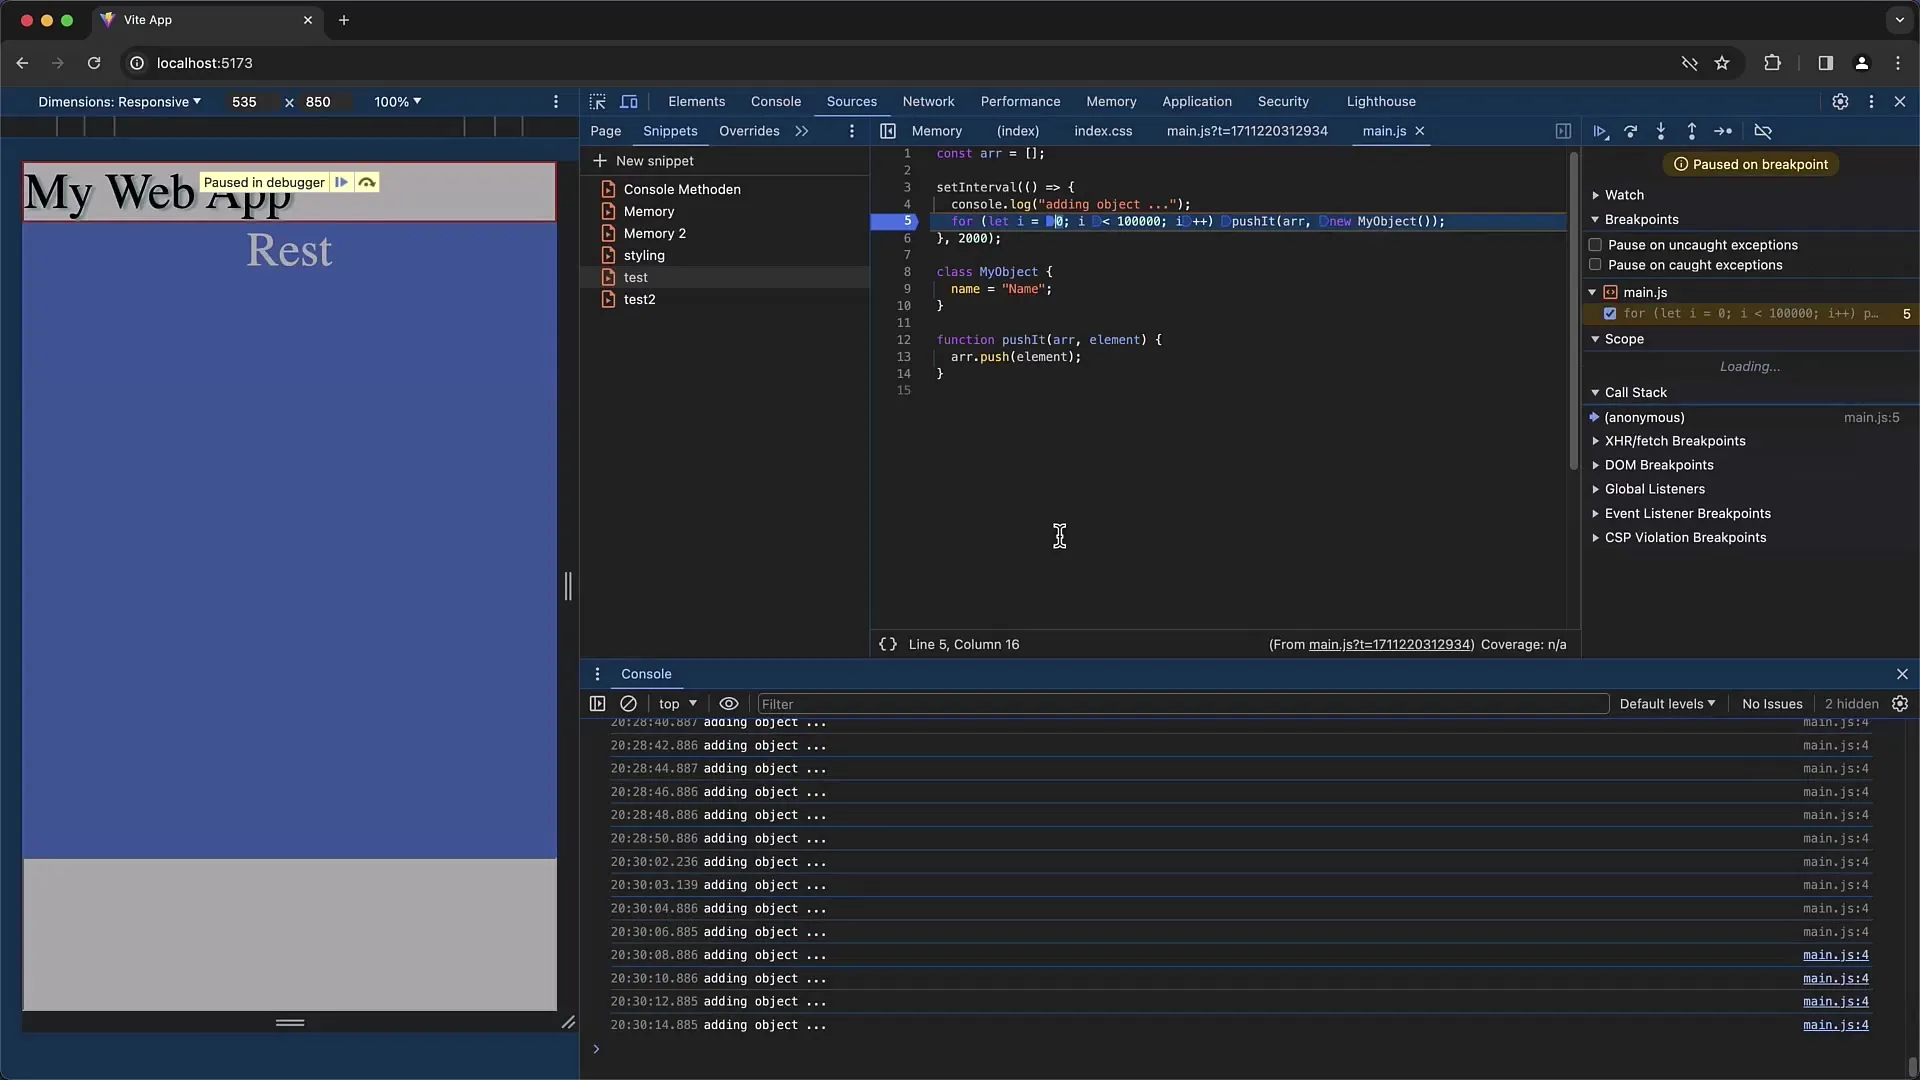
The Chrome Developer Tools also provide the option to customize shortcut keys. If you want to redefine specific keys for functions like "Toggle Breakpoint" or "Step Over," you can do so in the settings under "Shortcuts." These customizations can significantly speed up your workflow.
Experimental Features
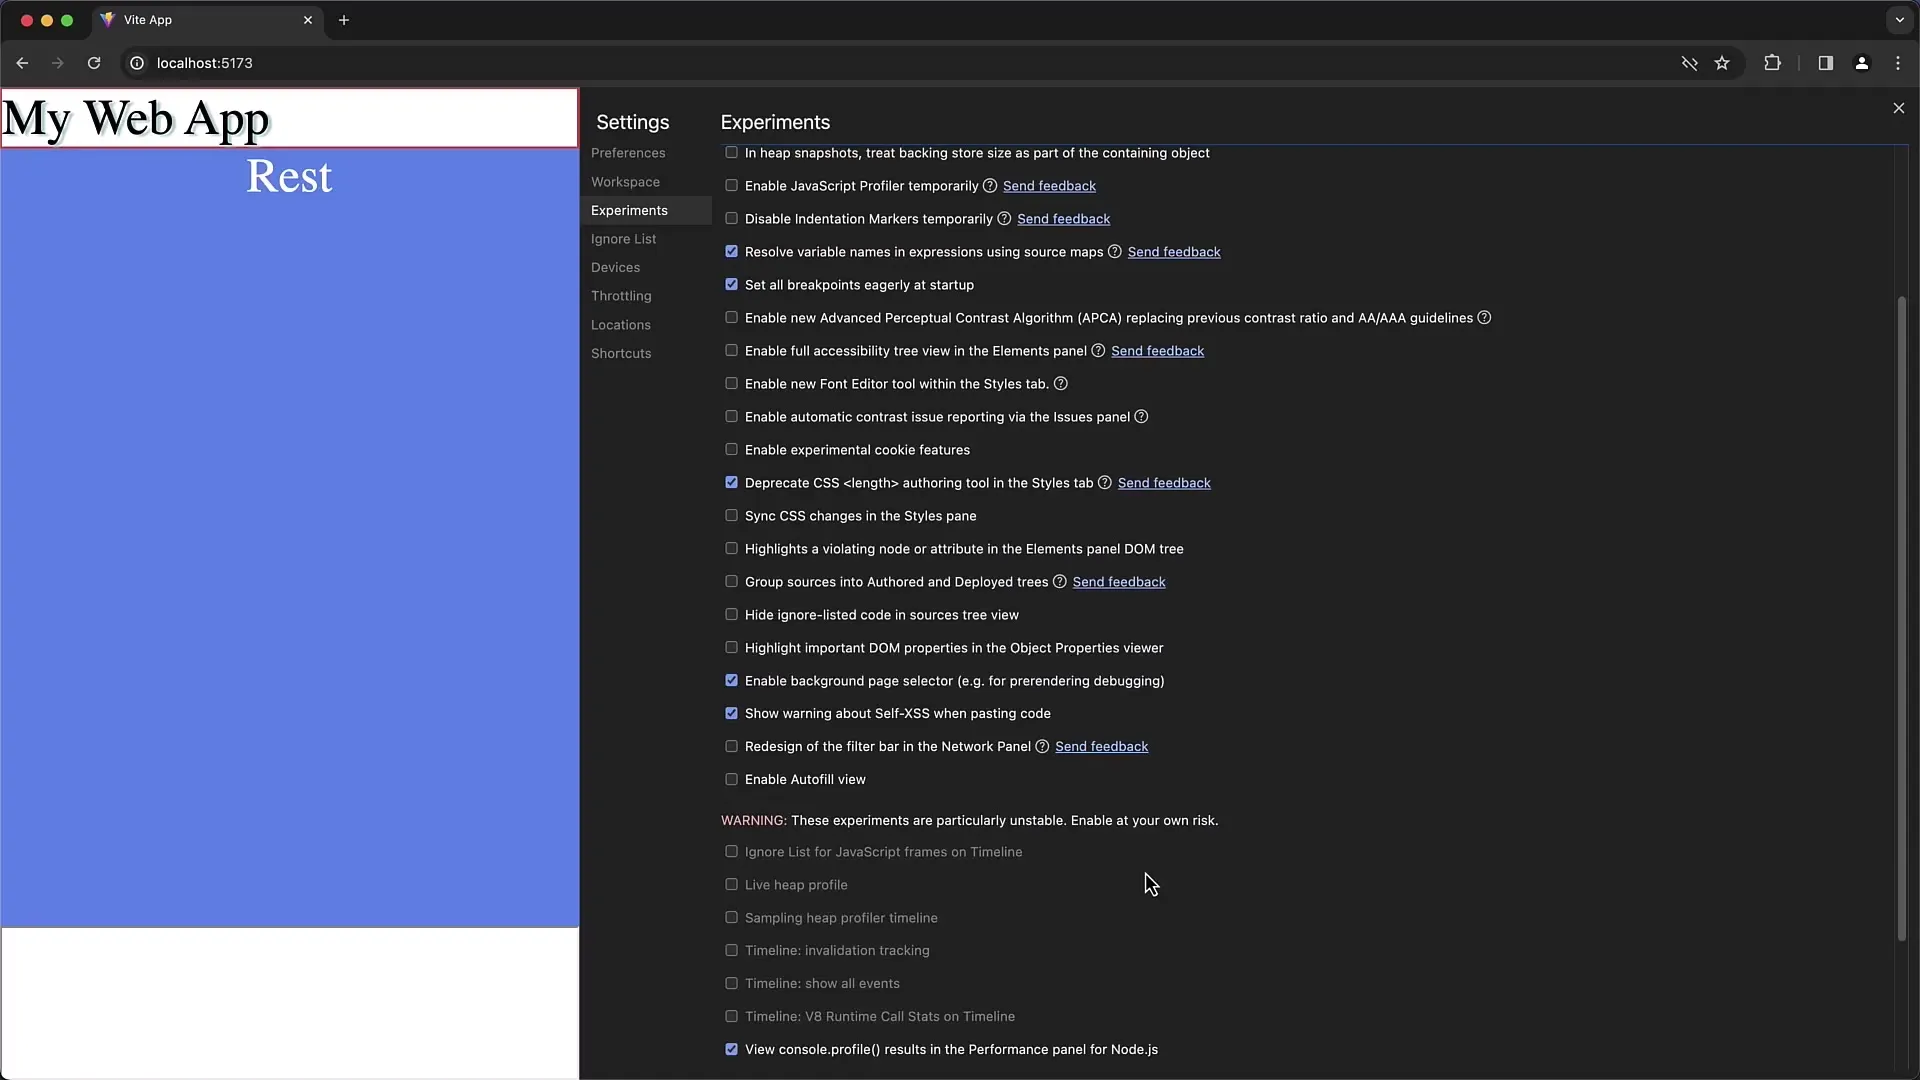
In the settings, there is a section for experimental features. Here you can enable new features that may not yet be stable. Be careful, as they can sometimes lead to unexpected behavior.
Ignore List Management
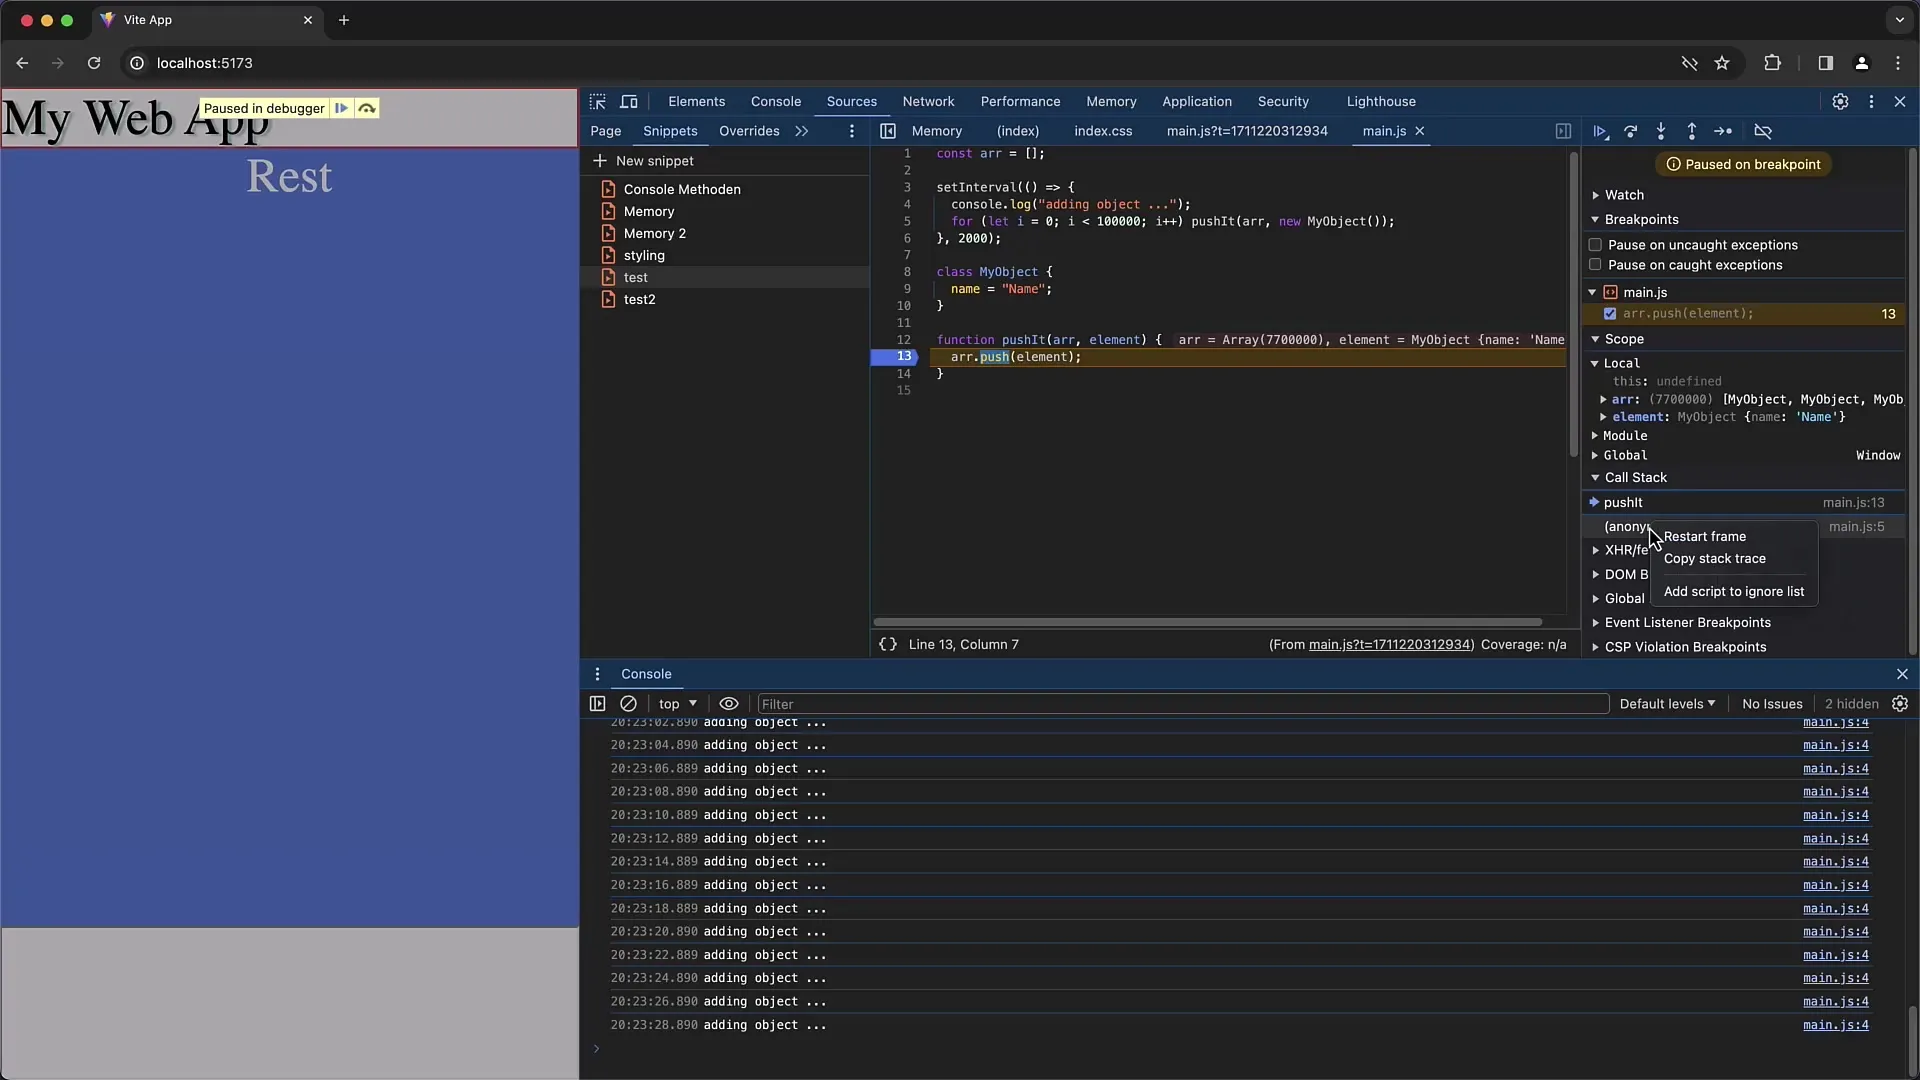
In the ignore list, you can manage specific scripts that should not be considered by the developer tools. You can add or remove scripts here to optimize the debugging experience.
Mobile Device Emulation
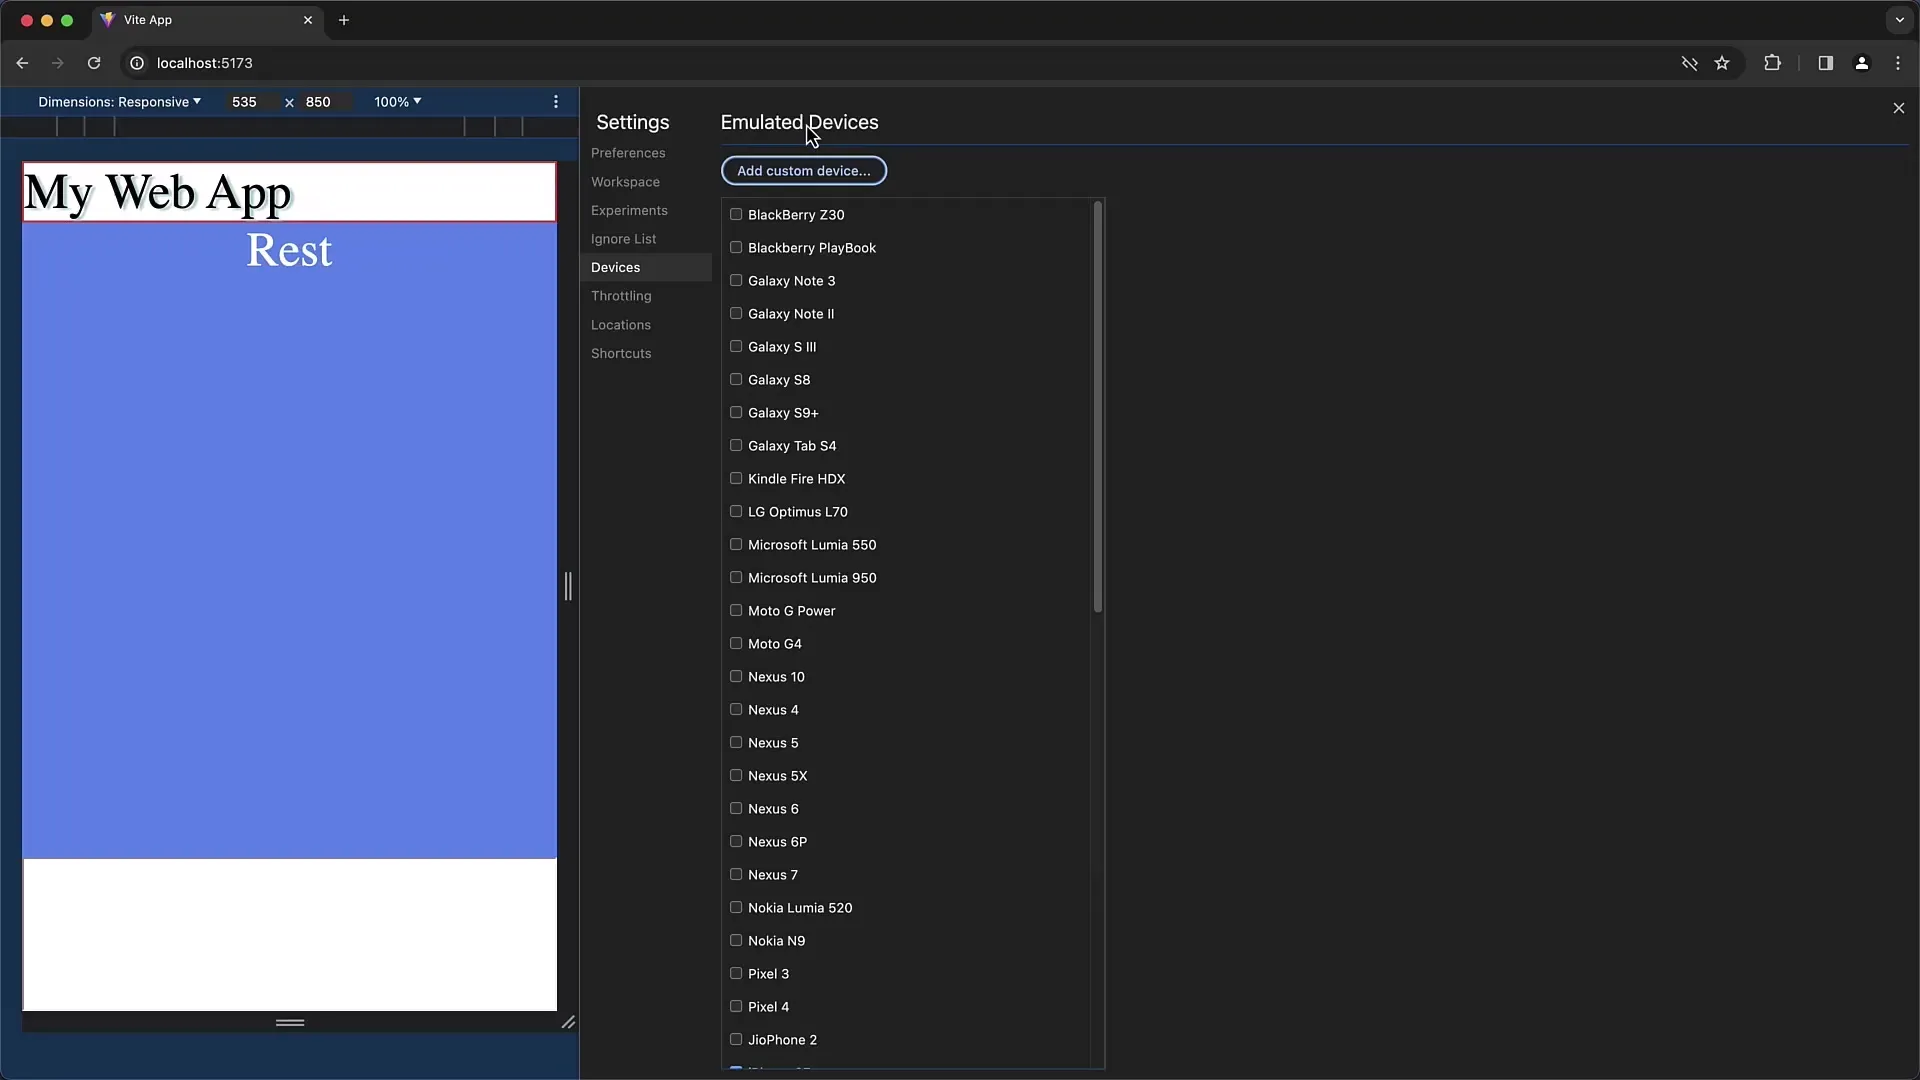
Under the "Devices" section, you can emulate various mobile devices. This is helpful for testing how your application looks on different screen sizes and resolutions.
Summary
In this guide, you have learned how to customize the key settings in Chrome Developer Tools to enhance your workflow. From changing the appearance to specific debugging options, you now have the tools to work more productively. Experiment with different settings to find your perfect workflow.


