Chrome Developer Tools are an indispensable tool. It is important to understand the various functions and methods that can help you efficiently debug your code and provide valuable information. In this tutorial, I want to introduce you to some less common, yet extremely useful Console methods that will help you optimize your work.
Main Discoveries
- assert(): Check if a condition is true and provide an error message if it is not.
- count(): Count how many times a specific method has been called and reset the count if needed.
- time() and timeEnd(): Measure the time a specific block of your code takes to run.
- trace(): Track where your code was executed to simplify debugging processes.
Step-by-Step Guide
First, you should open the Chrome Developer Tools. You can do this by right-clicking on a webpage and selecting "Inspect" (or pressing F12). Now that the console is open, we can try out different Console methods.
Using assert()
A very useful tool is the method assert(). This method is used to ensure that a specific expression is true. If you pass an expression that is false, you will see an "Assertion Failed" error in the console. Let's try it out.
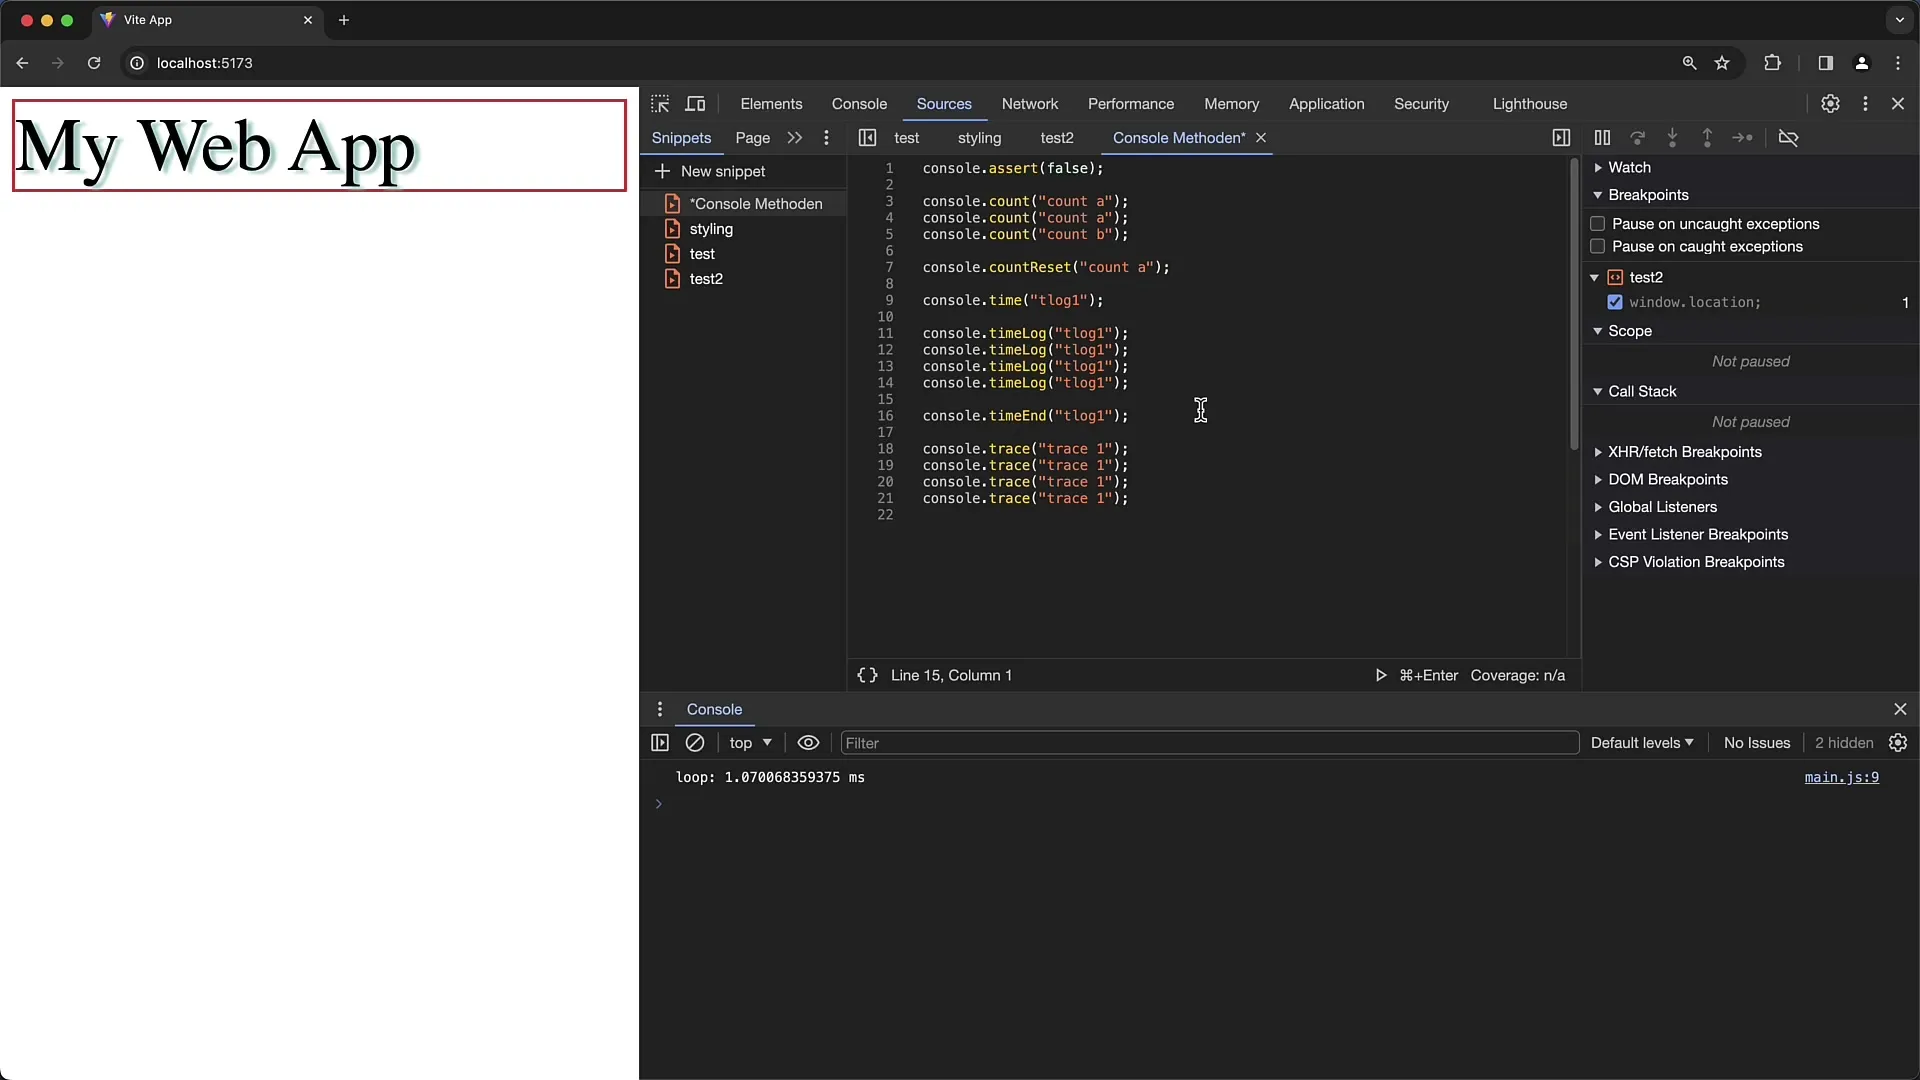
Here I have prepared a simple example for assert(). I pass an expression and if it does not hold true, the console will display an "Assertion Failed" error. This can be helpful in ensuring that variables or states exhibit your desired behavior.
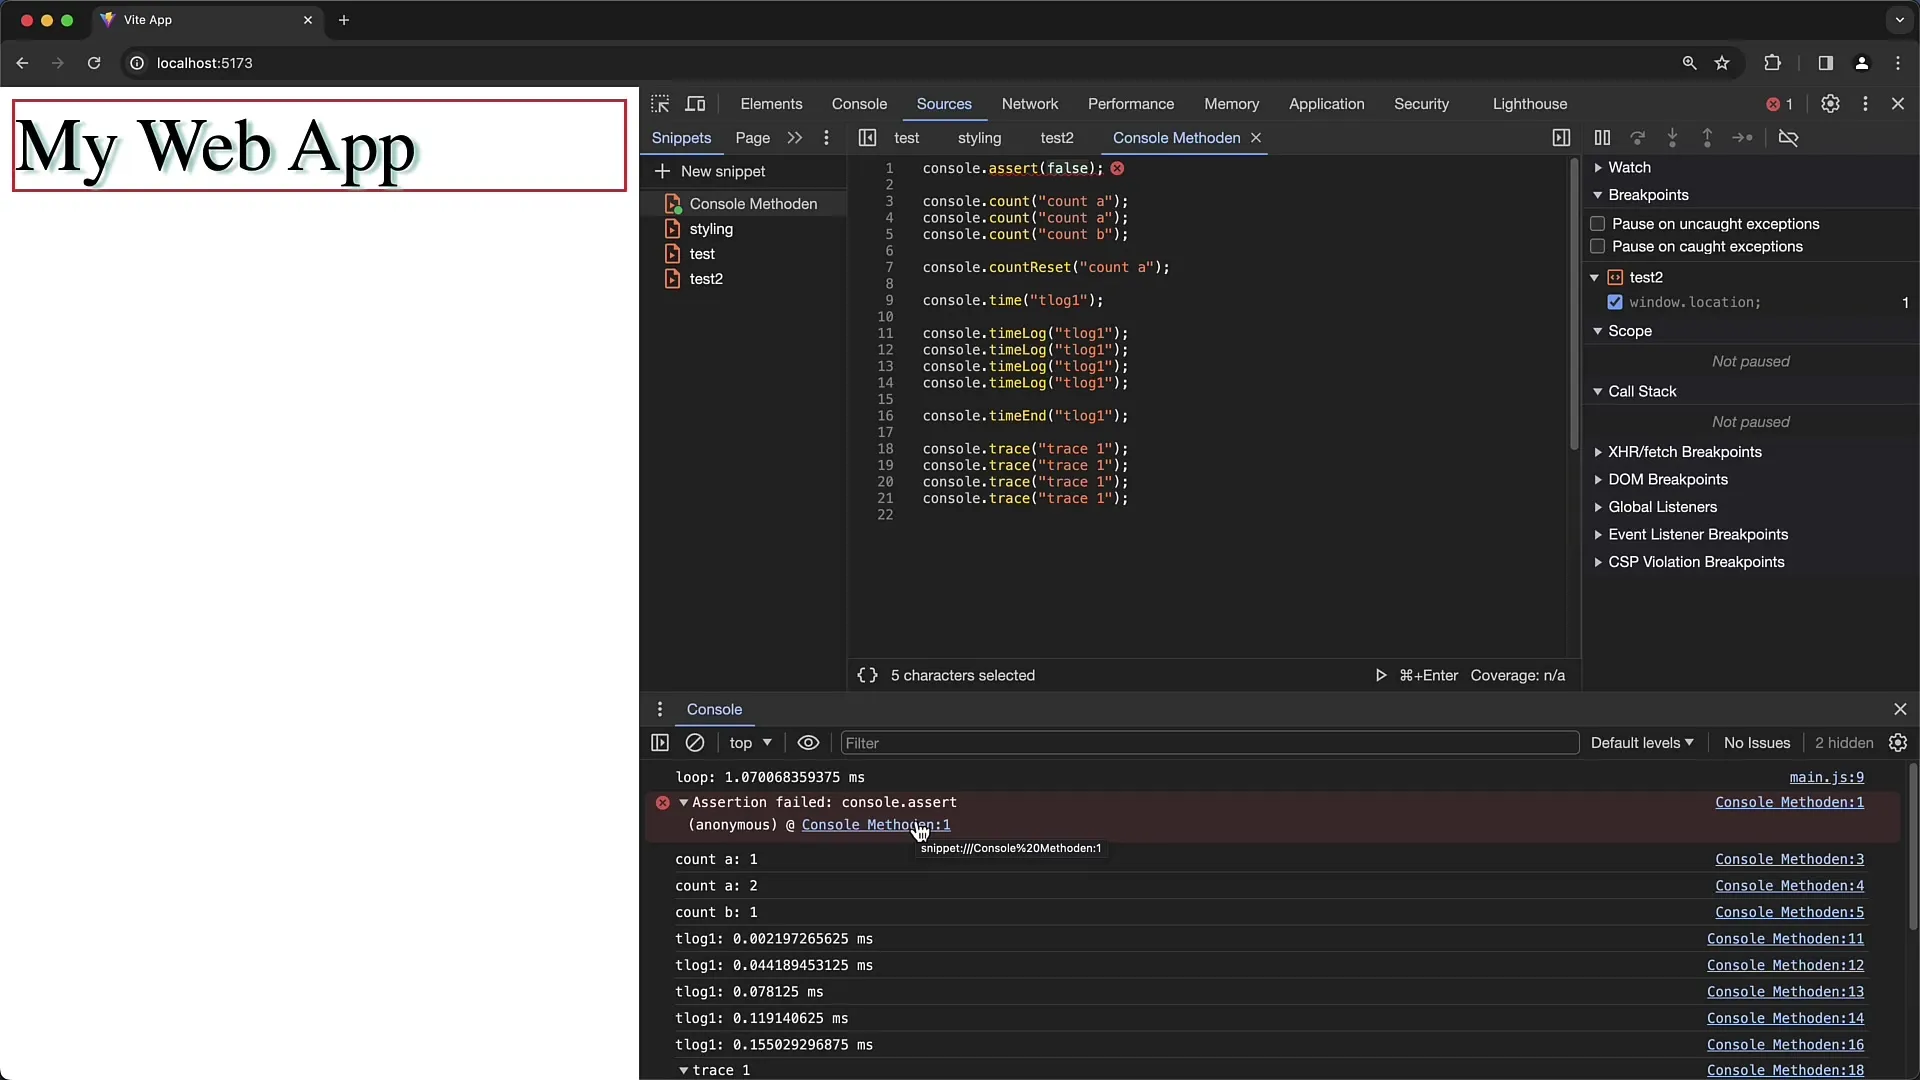
What's special about it is that you can hover over the error in the console to get more details on where the error occurred. This is particularly useful for more complex applications.
Counting with count()
The next method is count(). With this method, you can count how many times a certain function or line of code has been called. This can be useful, for example, when monitoring function calls. Let's take a closer look at this.
Here, I'm using count with an ID so I can see how many times a function is being called. Every time I trigger the function, the number automatically increments. If you want to know how many times you are at a specific point in the code, count() is extremely helpful.
Additionally, there is also countReset() to reset the count back to zero. Utilizing count() and countReset() can bring you many advantages, especially when debugging complex logic.
Measuring Time with time() and timeEnd()
Another important tool is the functions time() and timeEnd(). With time(), you can set the start of a time measurement and with timeEnd(), you can capture the endpoint to find out how much time has passed. Let's look at an example here too.
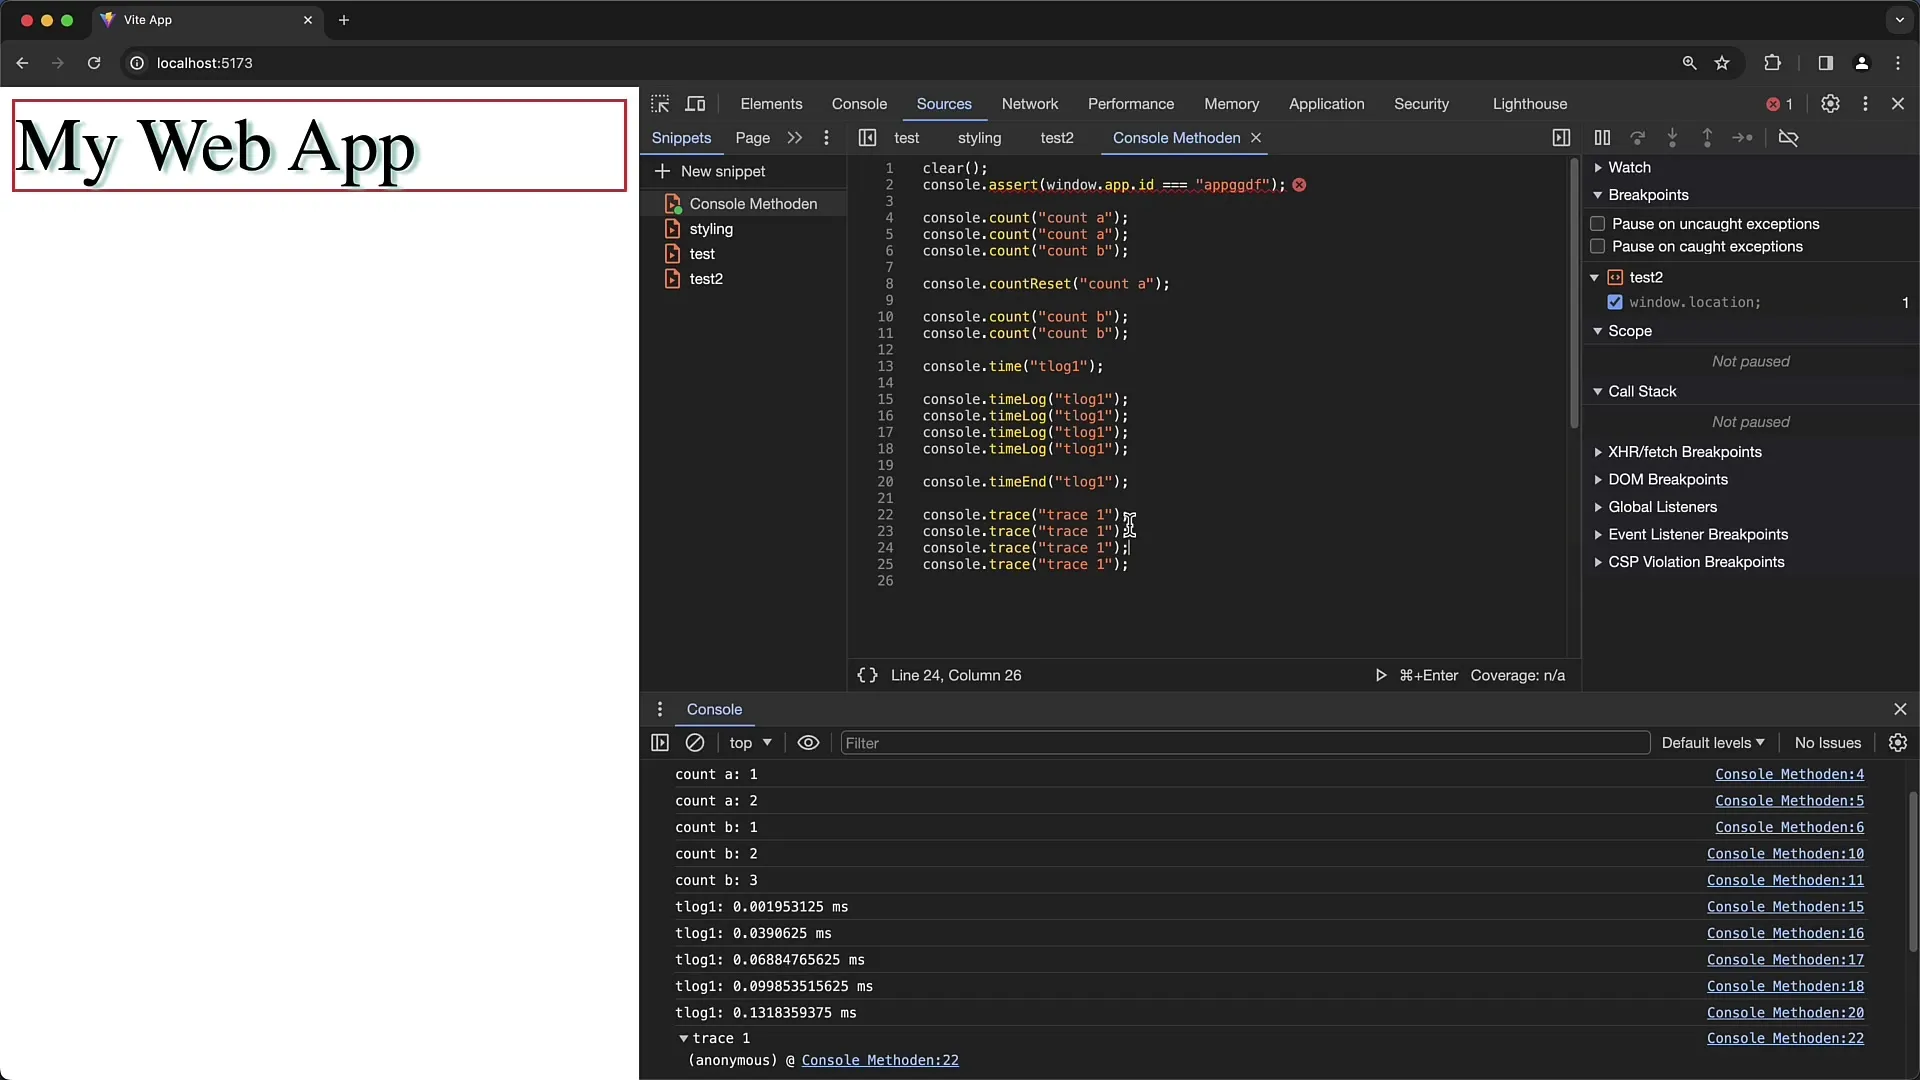
I use time() at the beginning of my code and then after a specific section to find out how long that code segment took. The output is in milliseconds, which helps you analyze the performance of your code.
These time measurement methods are especially useful when you need to identify and analyze code that needs optimization.
Tracking with trace()
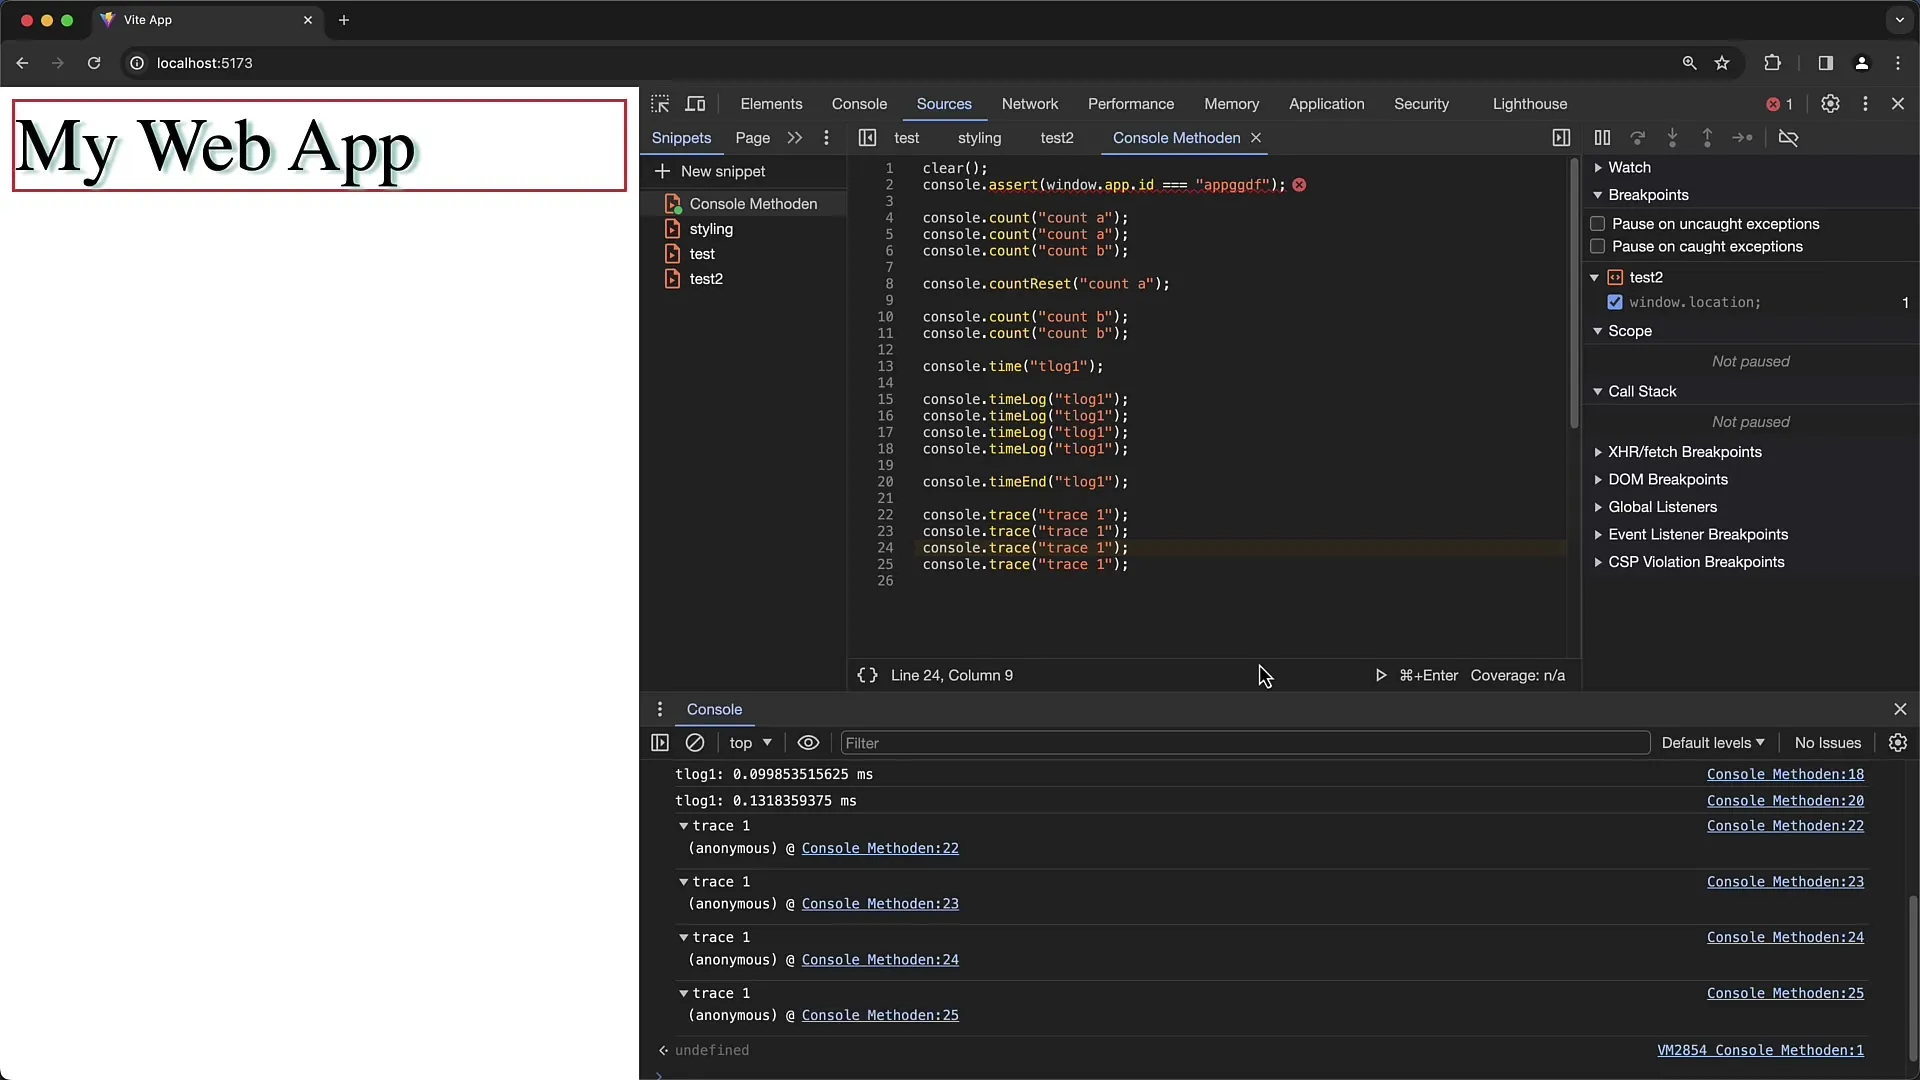
The last, but equally important method is trace(). This method allows you to view a history of all the places where trace() was called in the code. It helps you better understand the flow of your code and identify areas that could be causing multiple calls.

Here, you can see how I used trace() to track where I am in the code. By opening the call stack, I can jump immediately to relevant places in the code. This is particularly useful for debugging.
Finally, it is important to point out that you should avoid using these debugging methods in your production code to optimize performance and minimize unwanted console outputs.
Summary
In this guide, we have discussed some powerful console methods of Chrome Developer Tools that can greatly benefit you in your everyday web development activities. With functions like assert(), count(), time(), and trace(), you are well-equipped to effectively monitor your code, identify errors, and optimize performance. Remember that effective debugging is an essential part of any software development.
Frequently Asked Questions
What does the assert() method do?assert() ensures that an expression is true and throws an error if it is not.
How does the count() method work?count() counts how many times a function is called and can also be reset.
What can I do with time() and timeEnd()?Using these methods, I can measure the time my code takes, which helps me evaluate performance.
Why should I use the trace() method?trace() helps me track the execution order of my code and identify potential debugging issues.
Do I need to keep these methods in my production code?It is recommended to remove these debugging methods from the production code to optimize performance.


