The Firefox Developer Tools are an excellent tool for developers to analyze and debug websites. In this guide, I will explain how you can effectively use the Developer Tools in Firefox. I will cover the similarities and differences to the Chrome Developer Tools to show you how to navigate the user interface quickly and utilize the key functions. Even though there are some differences, you will notice that the basic principles are similar.
Key Takeaways
- The Firefox Developer Tools can be opened via F12 or the context menu.
- There are some differences in the user interface, especially in the Web Storage and Application areas.
- Using the Console, Debugger, and Network Analysis is similar in Firefox to Chrome.
- The Performance Analysis offers various options to examine loading times and resource usage.
Step-by-Step Guide
To facilitate the entry into the Firefox Developer Tools, I have created a step-by-step guide that shows you how to use the key functions.
Open the Developer Tools
To open the Developer Tools in Firefox, you can press the F12 key. Alternatively, you can use the key combination Command + Option + I (Mac) or Control + Shift + I (Windows). Another option is to right-click on an element and select "Inspect." These commands open a window where you can use the tools.
Explore the User Interface
Once the Developer Tools are open, you will find that the user interface offers a range of tabs that provide you with various functions. These tabs range from "Inspector" to "Console" and "Debugger." There are slight differences compared to the Chrome Developer Tools, but the basic functions are similar.
Use the Inspector
The Inspector tab allows you to view and modify the HTML and CSS structure of a webpage. You can click on elements with the mouse to analyze their properties. Below the Inspector, you will find the Console, which you can also show or hide with the Escape key. Here, for example, you can call the currently selected element with the command $0.

Debugging with the Console
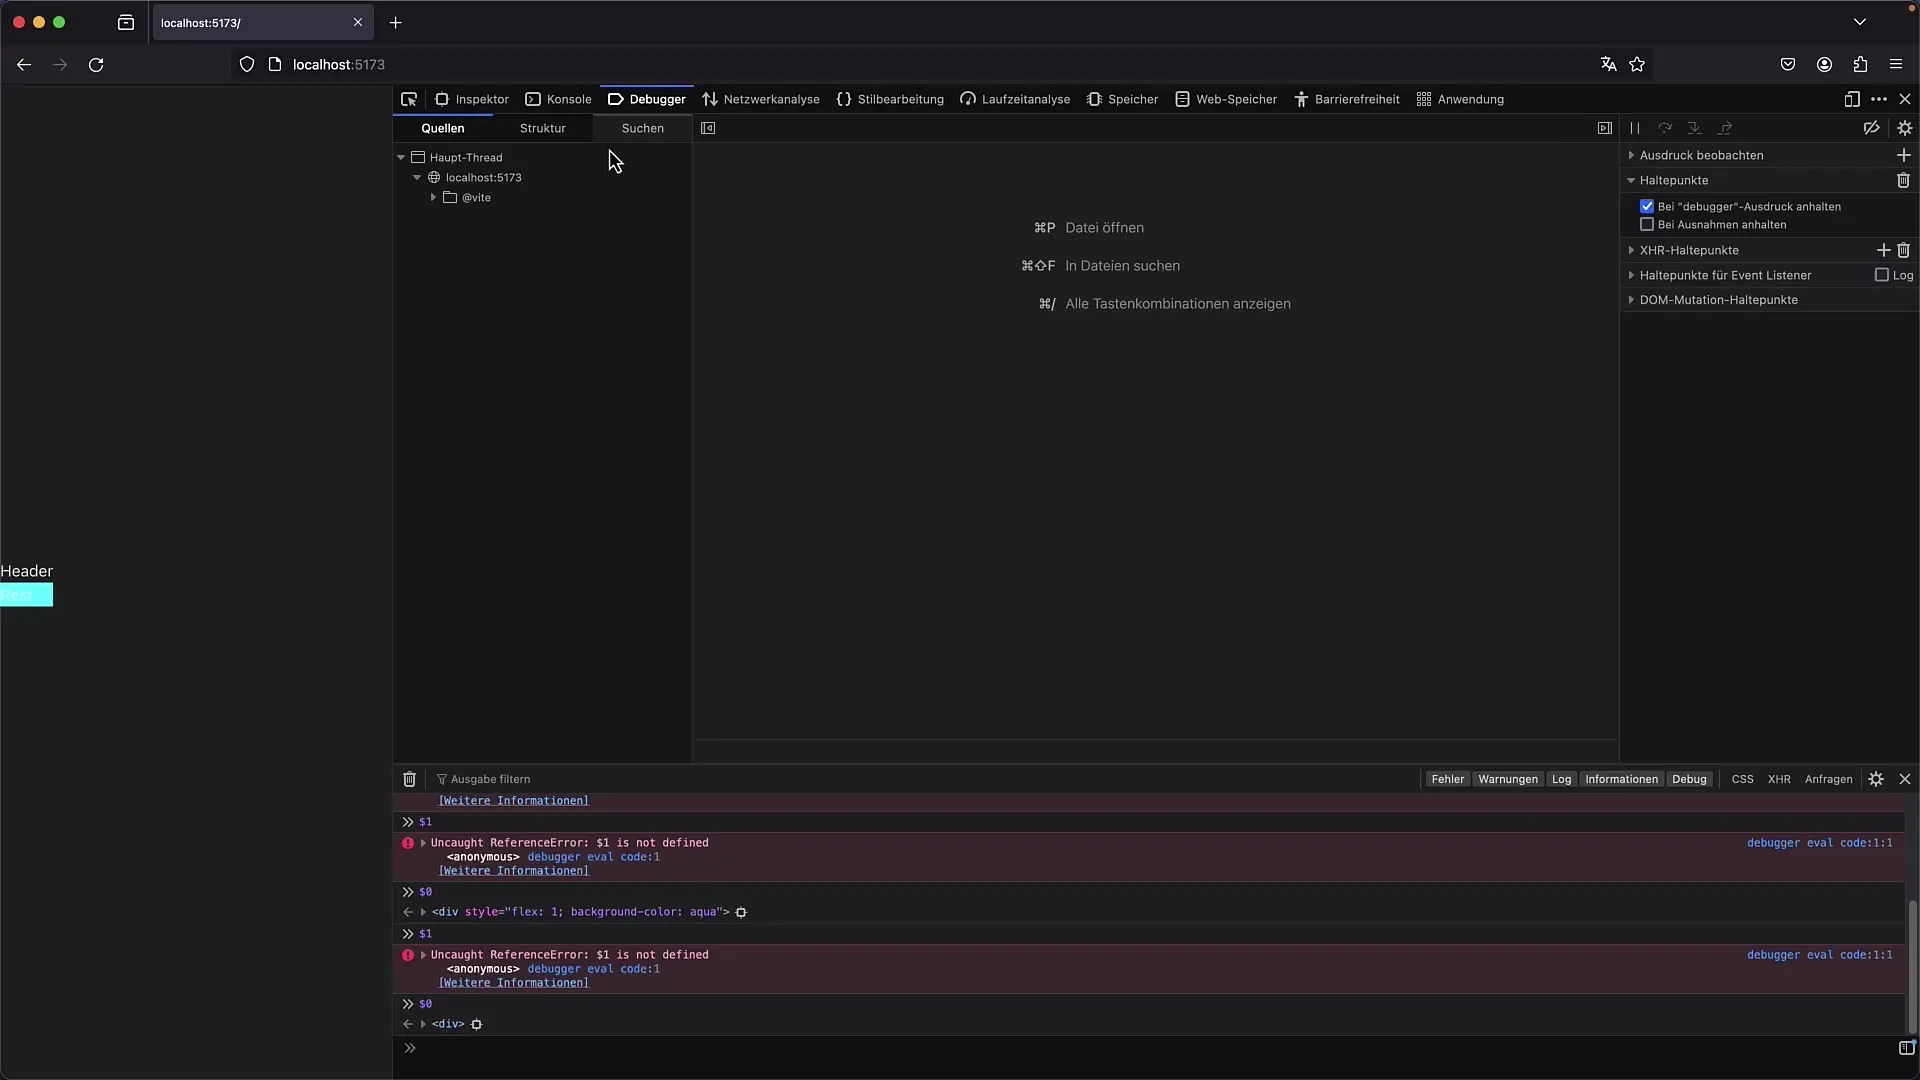
The Console allows you to execute JavaScript commands and see error logs. You can set breakpoints to stop script execution and analyze the current state. To set a breakpoint, simply click on the line number of the script. After a reload, you will be paused at the point where you set the breakpoint. The benefits are similar to Chrome: you can step through the execution and check variable values.
Perform Network Analysis
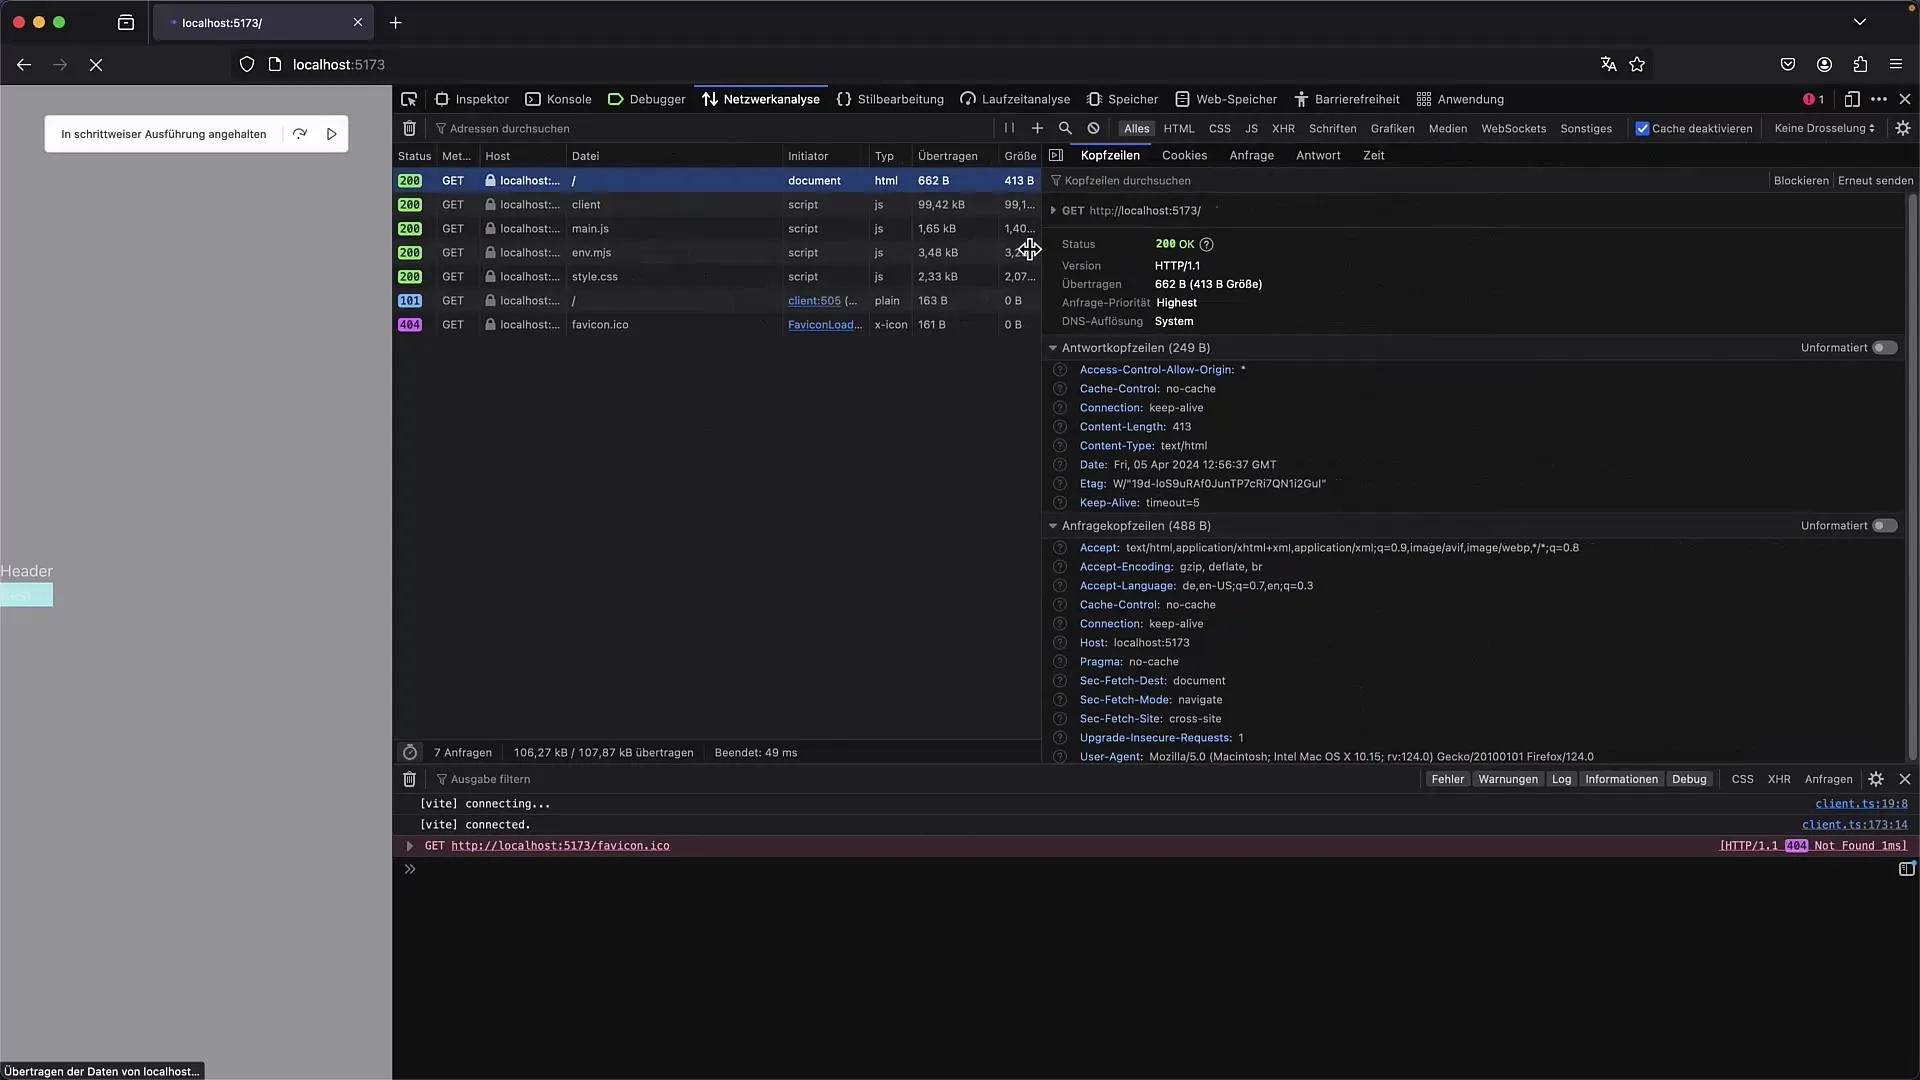
The "Network" tab is crucial for monitoring load times and requests to your server. Here, you can click on entries to see details about errors, response headers, and request headers. This view is very similar to that in Chrome, so you will quickly navigate through it. This information is crucial for verifying if all resources are loaded correctly and identifying potential performance issues.
Perform Performance Analysis with the Profiler
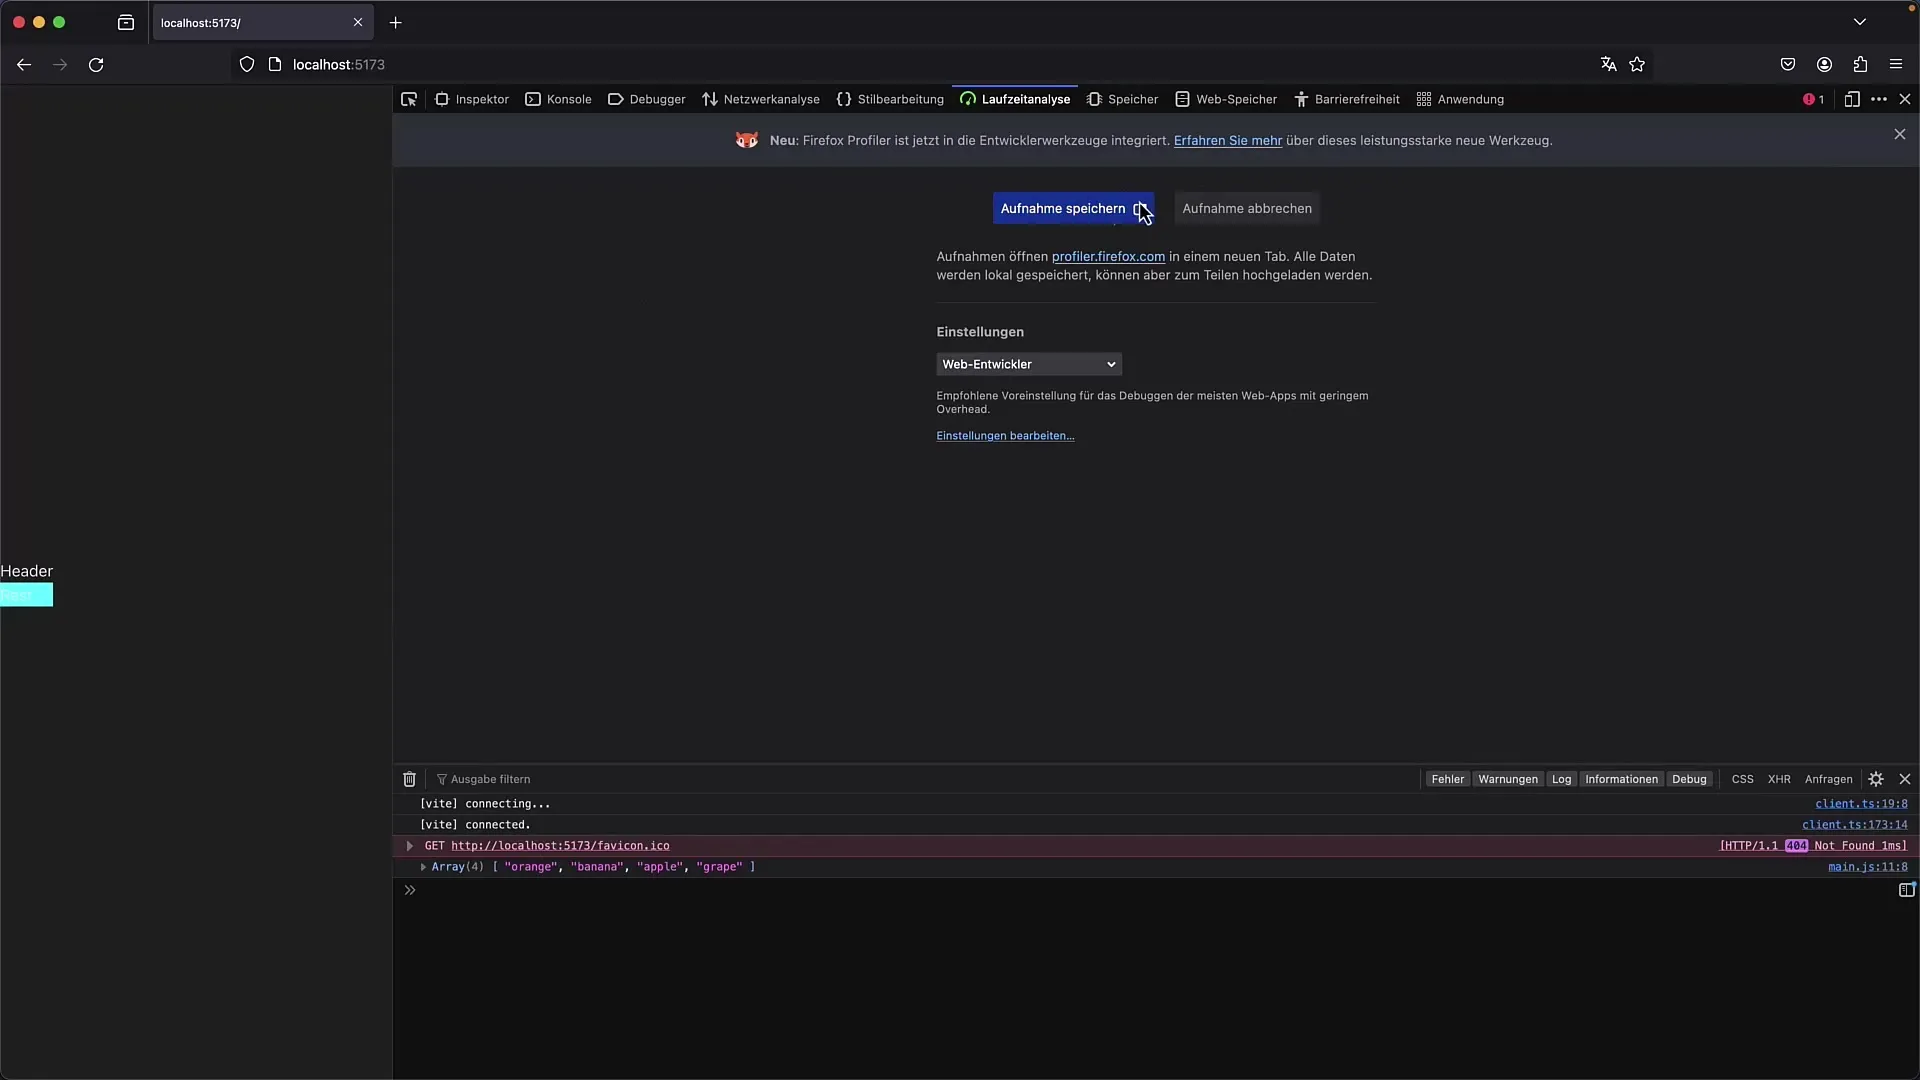
The Performance Analysis in Firefox also provides various tools to track your website's speed. You can start a recording and analyze the different calls and their durations. Note that the Profiler opens in a separate view, offering you detailed insight into your page's performance. This is particularly useful for identifying bottlenecks and optimizing your website.
View Web Storage
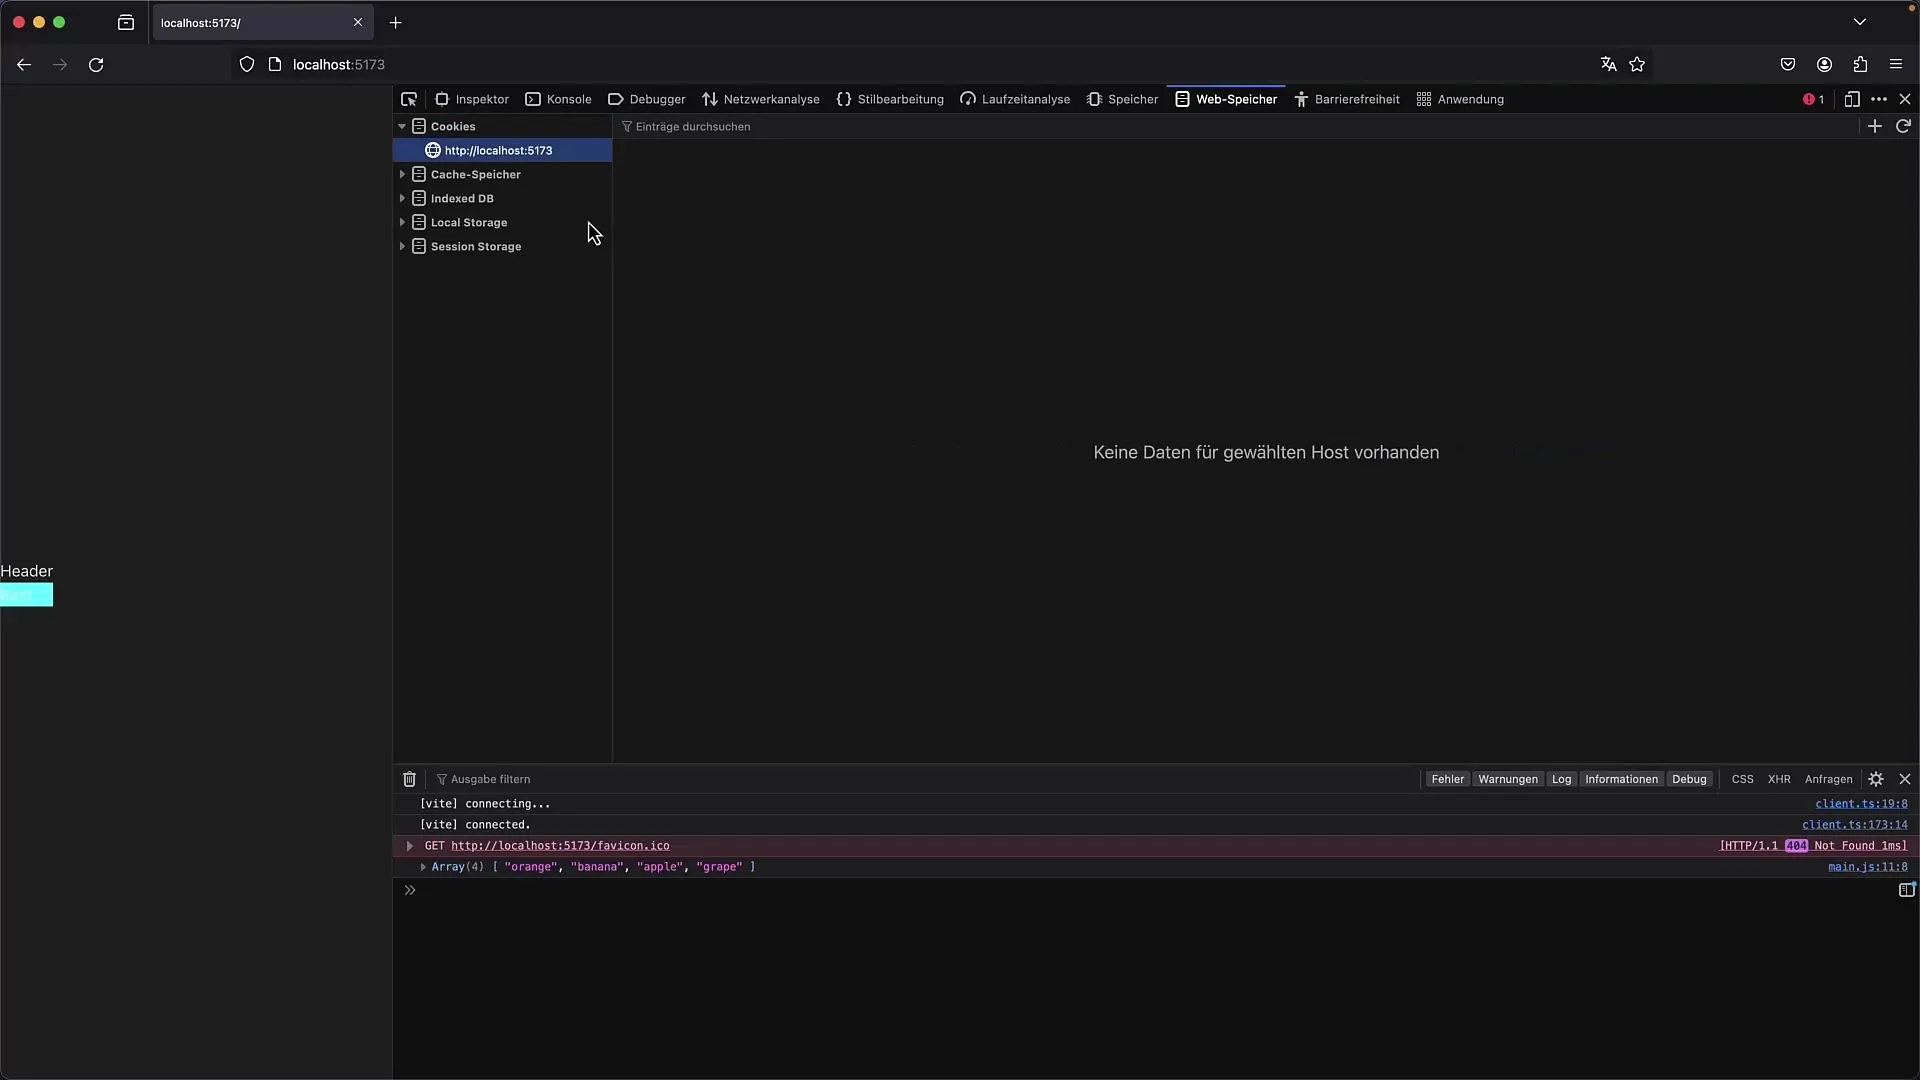
In the "Web Storage" tab, you will find information that is typically stored under "Application" in the Chrome Developer Tools. Here, you can view cookies, local storage, and IndexedDB. You can also add new entries and display existing ones to manage your data. This is helpful for developments where data is stored locally.
Checking Accessibility
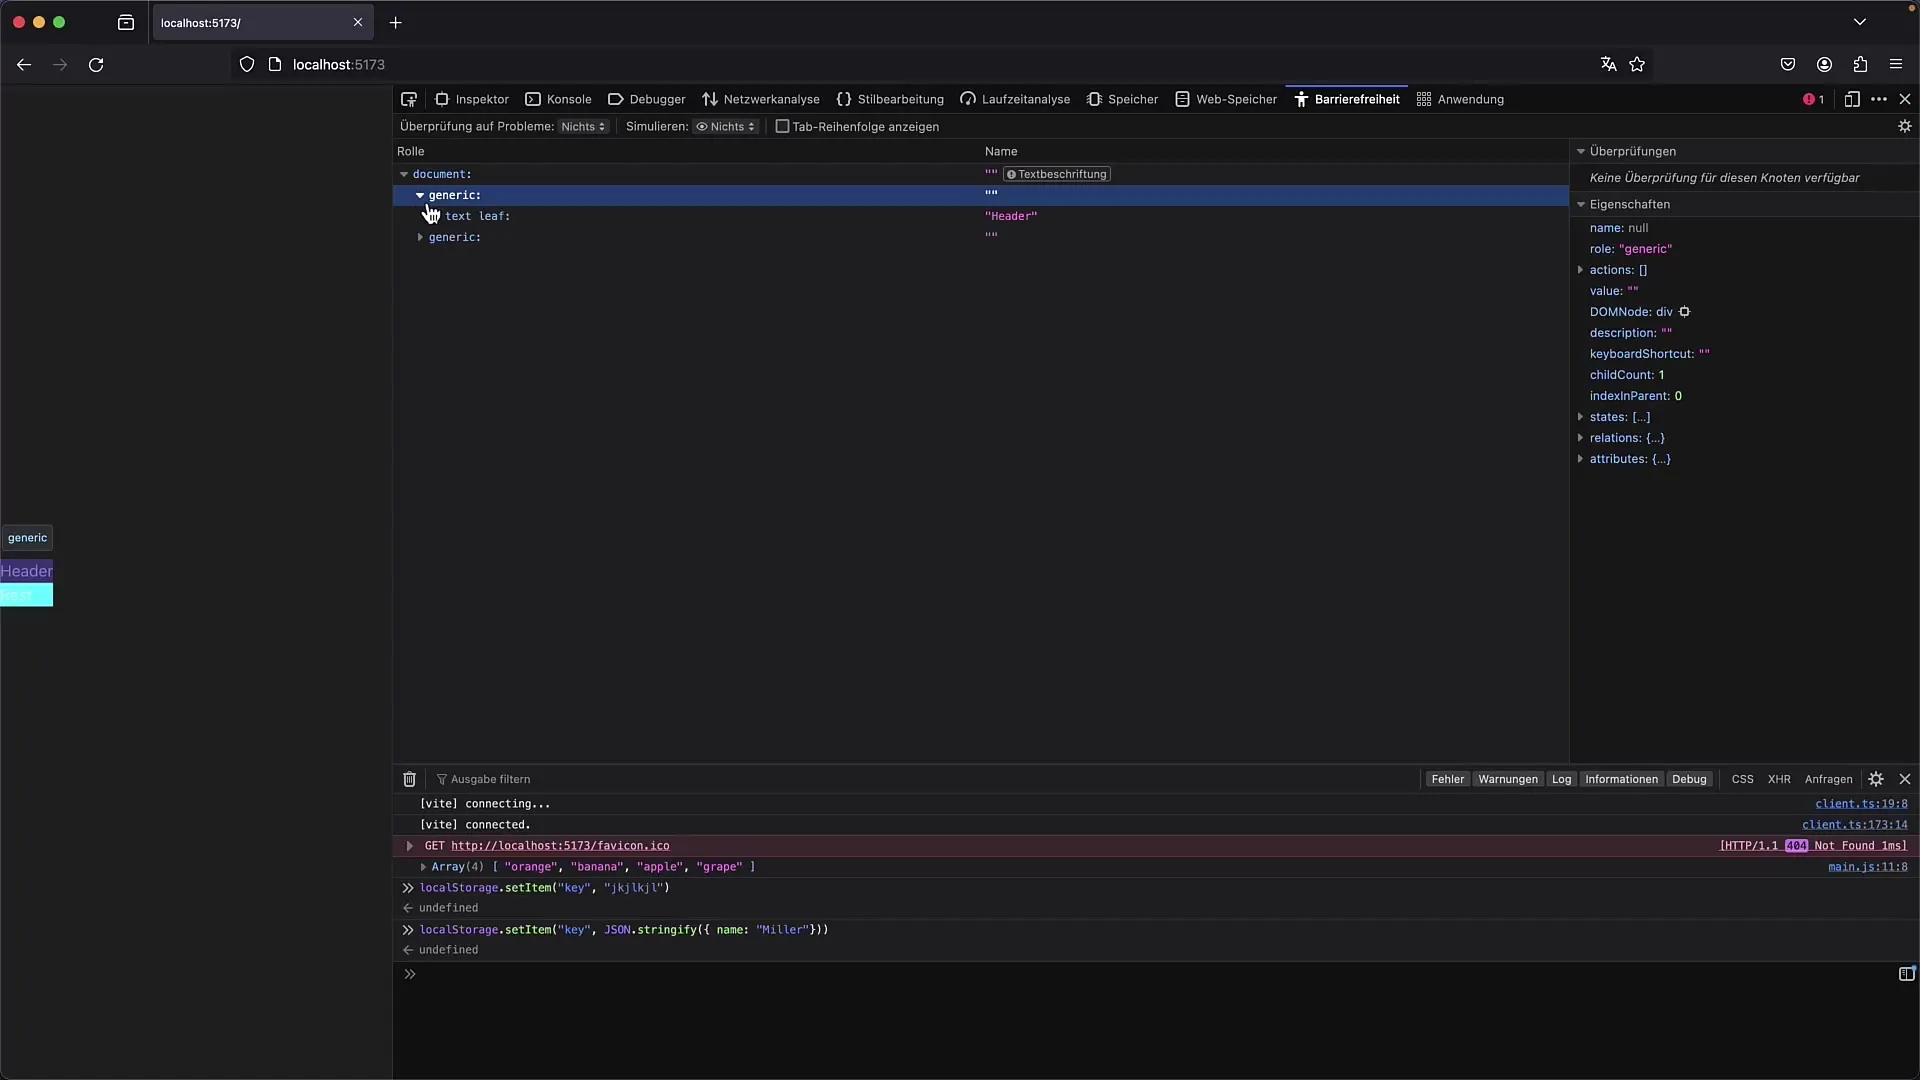
The Accessibility tab allows you to check whether your website meets the relevant standards. This feature helps you ensure that the website is accessible to all users. Here you will see information about ARIA roles and color contrasts that could indicate possible issues. It is important to integrate these tests into your development process to improve usability.
Managing changes in the user interface
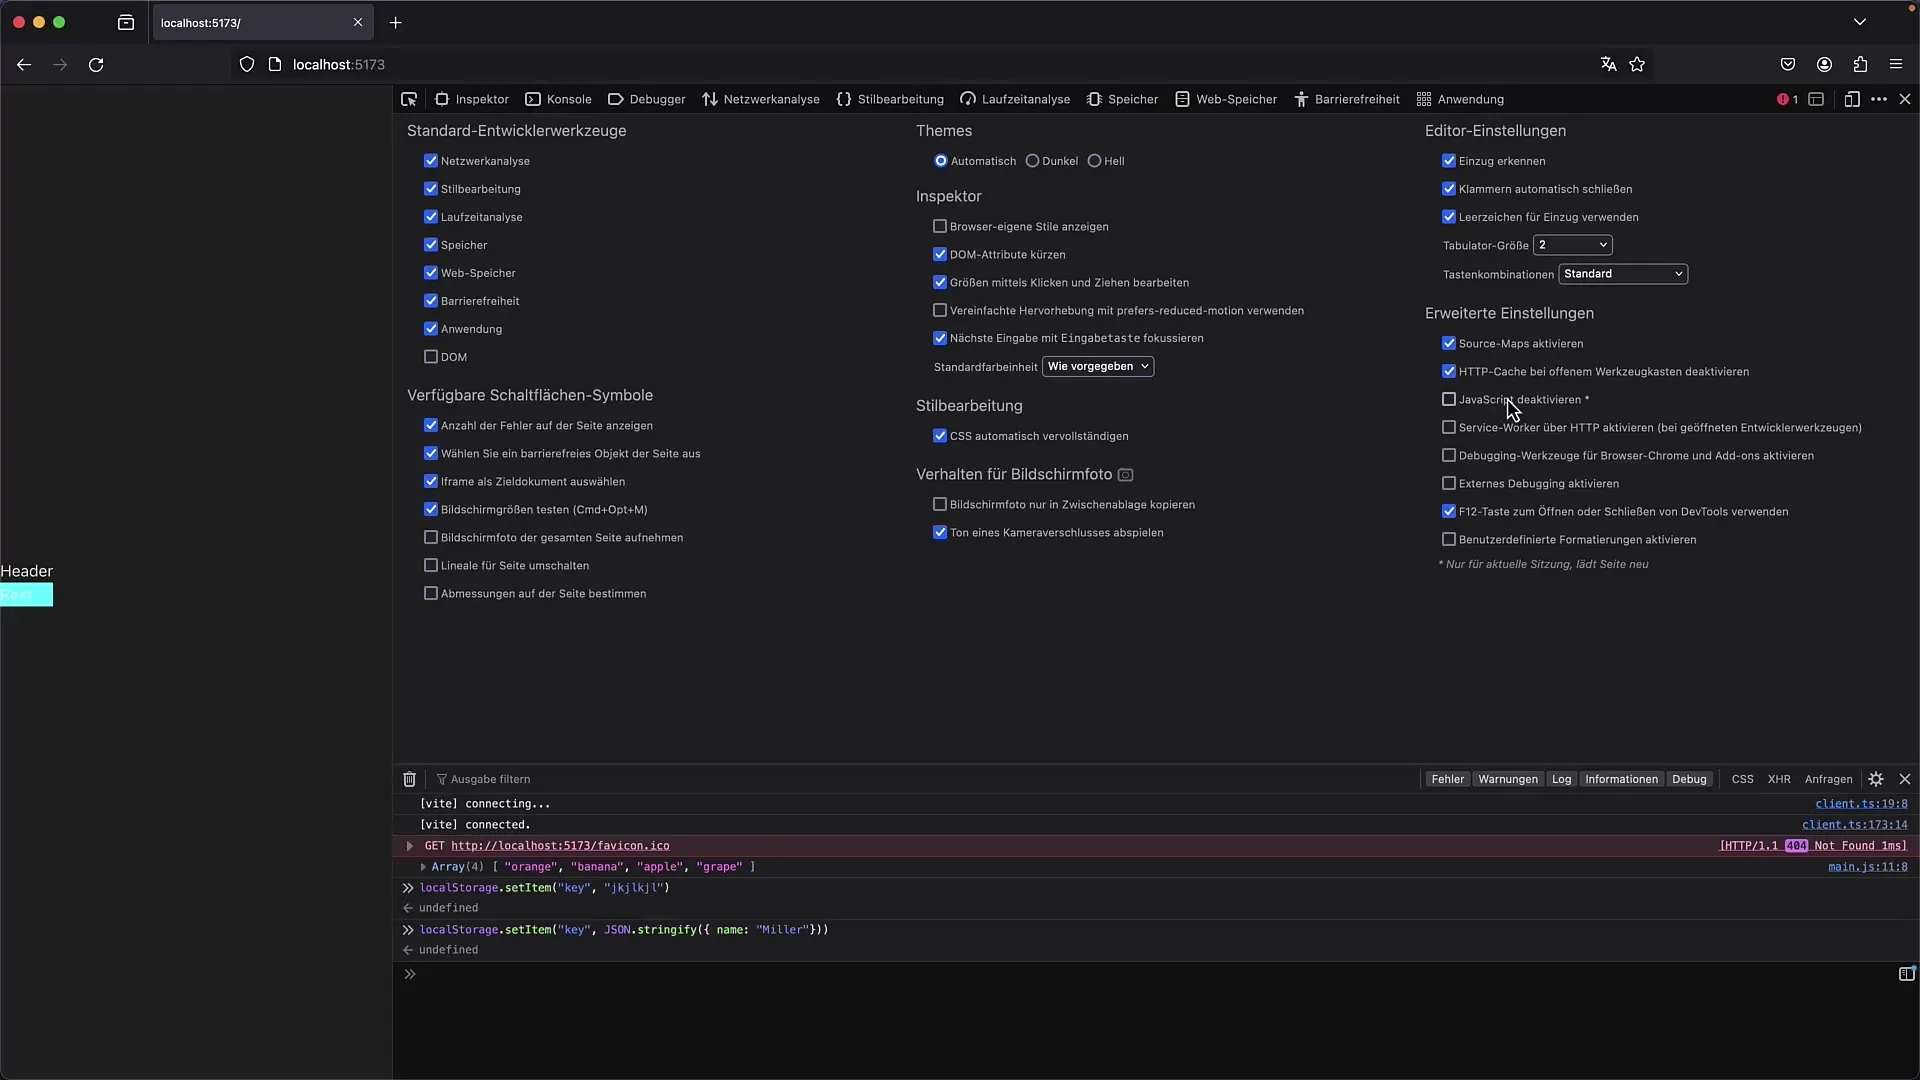
The settings and layout of the Developer Tools are slightly different in Firefox. You can open the tools in a separate window or dock them to the sides of the browser. Additionally, you can customize specific settings for the DevTools, such as enabling or disabling JavaScript. It's worth experimenting a bit here to find the best working conditions for your development projects.
Summary
In this guide, you have learned how to make the most of the Firefox Developer Tools. From exploring the user interface to specific functions such as debugging, network analysis, and performance checking, you have learned the key aspects. Despite some differences from Chrome Developer Tools, most features are similar and provide you with the necessary tools to successfully develop and test your web applications.
Frequently Asked Questions
How can I open the Developer Tools in Firefox?You can open the Developer Tools by pressing F12 or right-clicking on an element and selecting "Inspect."
Are the Firefox Developer Tools identical to those of Chrome?They are very similar, but there are some differences in the user interface and specific tabs.
How do I set a breakpoint in the debugger?To set a breakpoint, simply click on the line number in the debugger.
Can I monitor network traffic in Firefox?Yes, in the "Network" tab, you can view all network activities and their details.
Is there a way to check the accessibility of my website?Yes, in the Accessibility tab, you can check if your page meets the relevant standards.


