In this guide, I want to give you a deep insight into using the Developer Tools of Safari. Although the developer tools in Safari have some differences compared to those in Chrome and Firefox, the basic principle remains the same. You will learn how to activate the developer tools, use the different areas and functions, and implement essential debugging processes. Let's start directly with the key findings.
Key Findings
- The developer tools in Safari are not as easily accessible as in other browsers, as they need to be activated through the settings.
- The user interface and functions of the developer tools are similar to those of other browsers, but specific implementations vary.
- Debugging on iOS devices is possible with Safari by connecting the device via USB.
Step-by-Step Guide
1. Activating the Developer Tools in Safari
To activate the developer tools in Safari, you need to adjust the Safari settings. Start Safari and go to the menu bar. Choose "Safari" and then "Preferences".
Switch to the "Advanced" tab all the way to the right. There you will find the option "Show Develop menu in menu bar". Activate this option to enable the developer tools.
2. Accessing the Developer Tools
Once the developer tools are activated, you can open them through the "Develop" menu in the menu bar or by using specific key combinations. Direct access via keys F12 or Alt-Cmd-I does not work, but you can right-click on an element and choose "Inspect Element".
You can also use the key combination Cmd+Option+C to open the console and switch between different views.
3. Navigating Through the Developer Tools
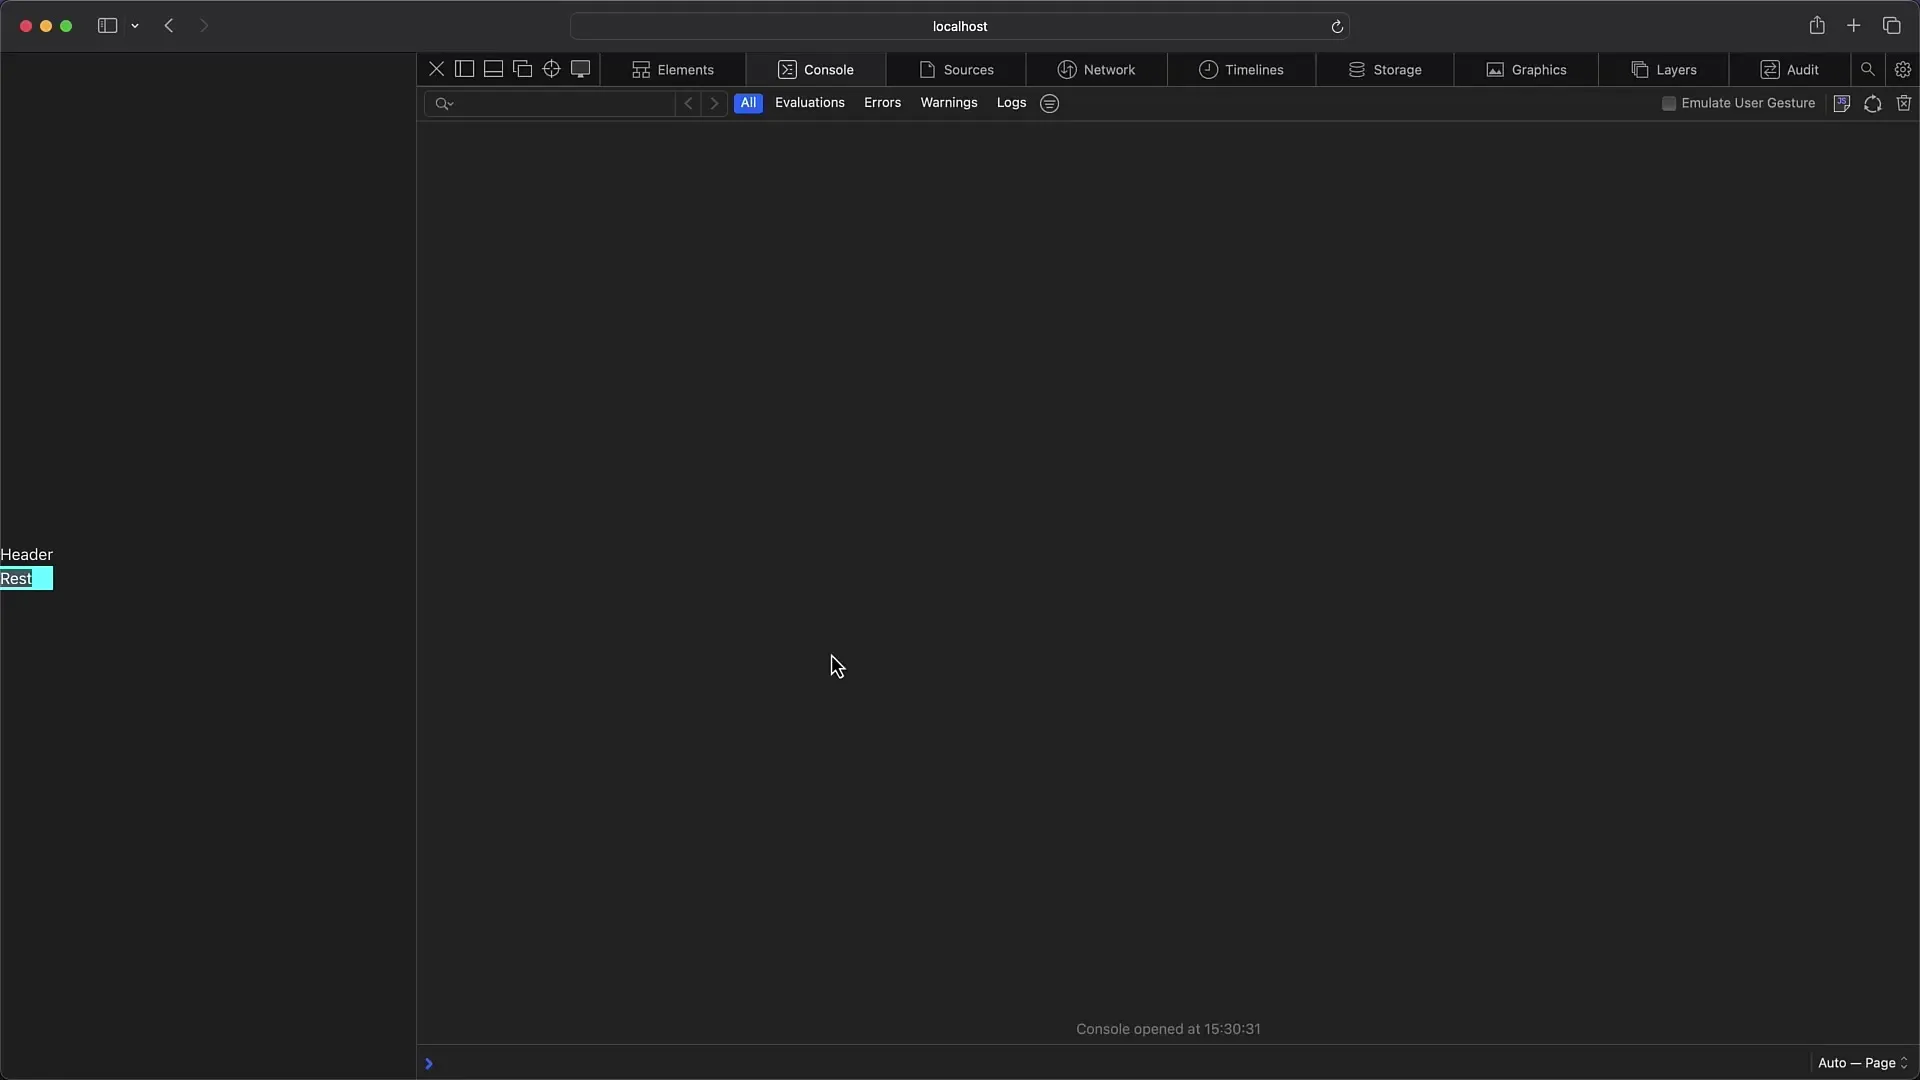
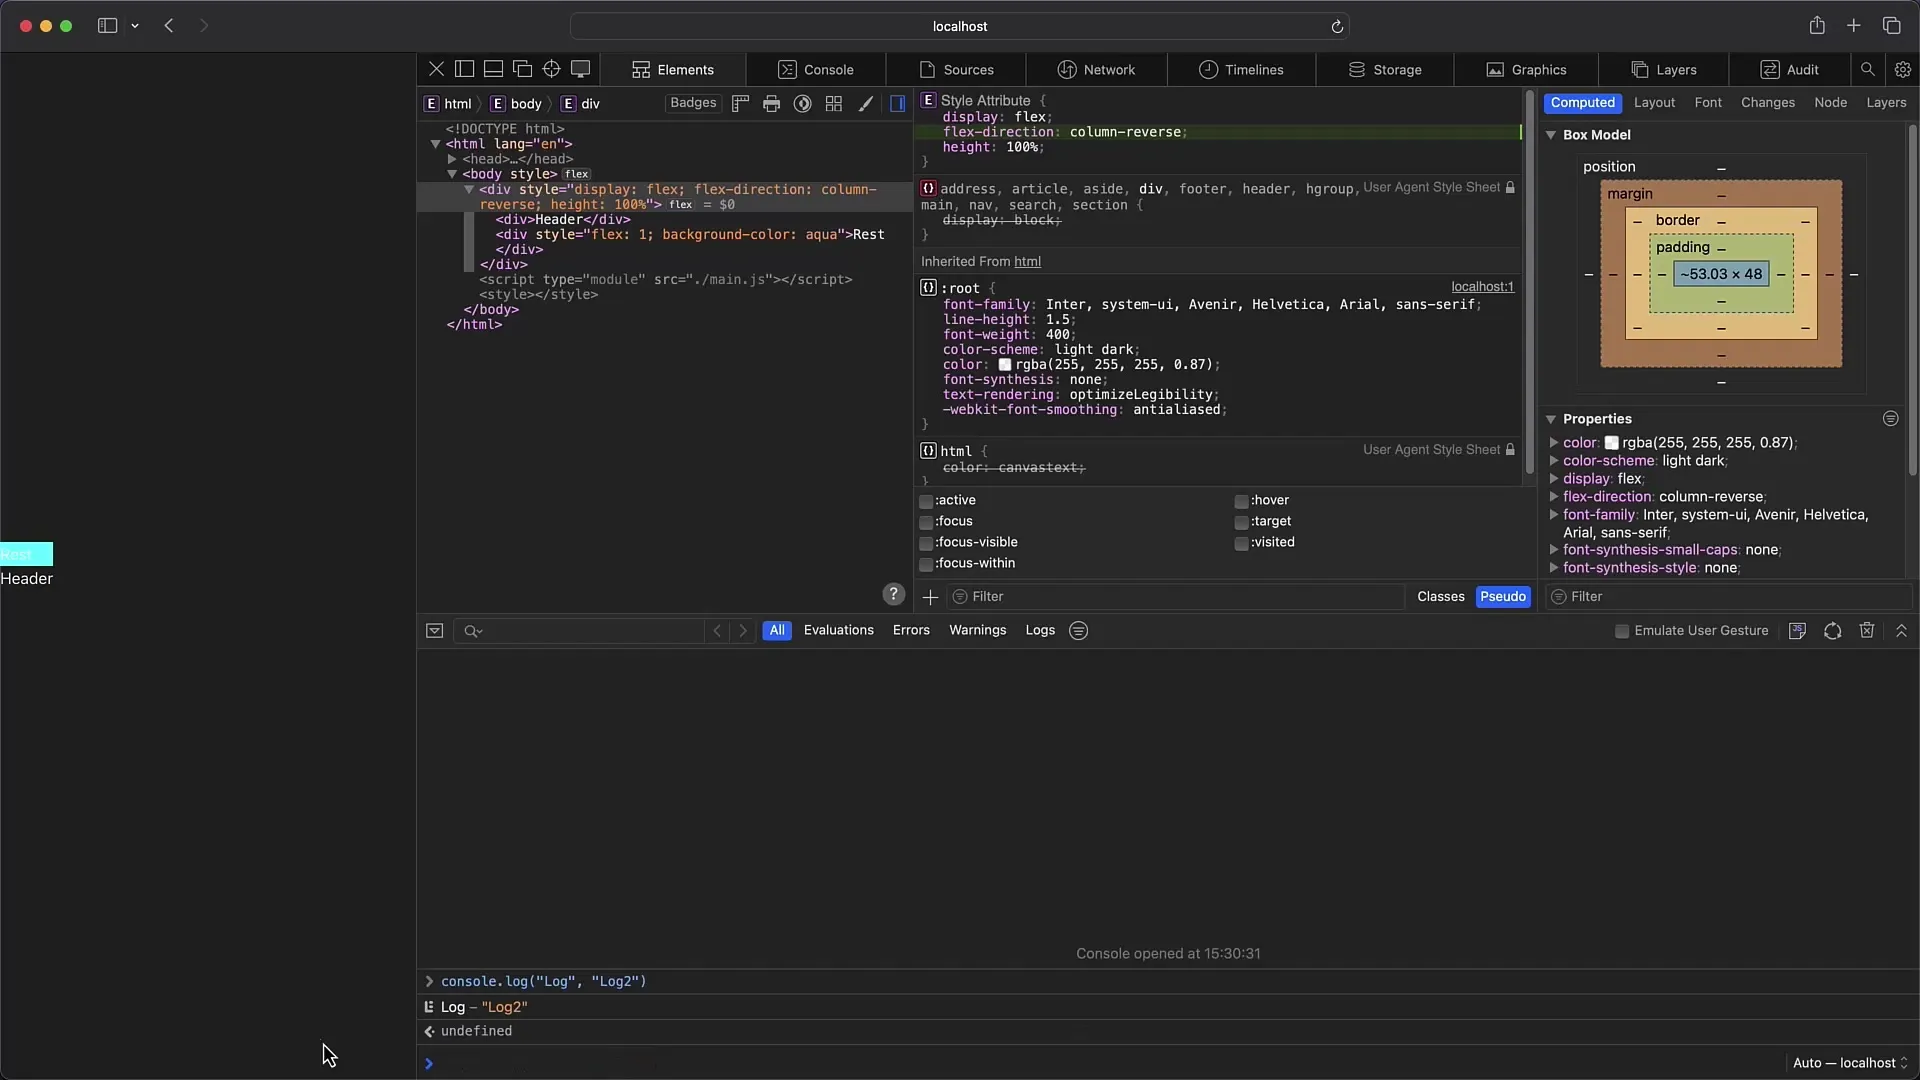
While the user interface of the developer tools looks similar to what you are used to from other browsers, there are some specific deviations. In the left sidebar, you can switch between tabs such as "Elements", "Console", "Sources", "Network", and others.
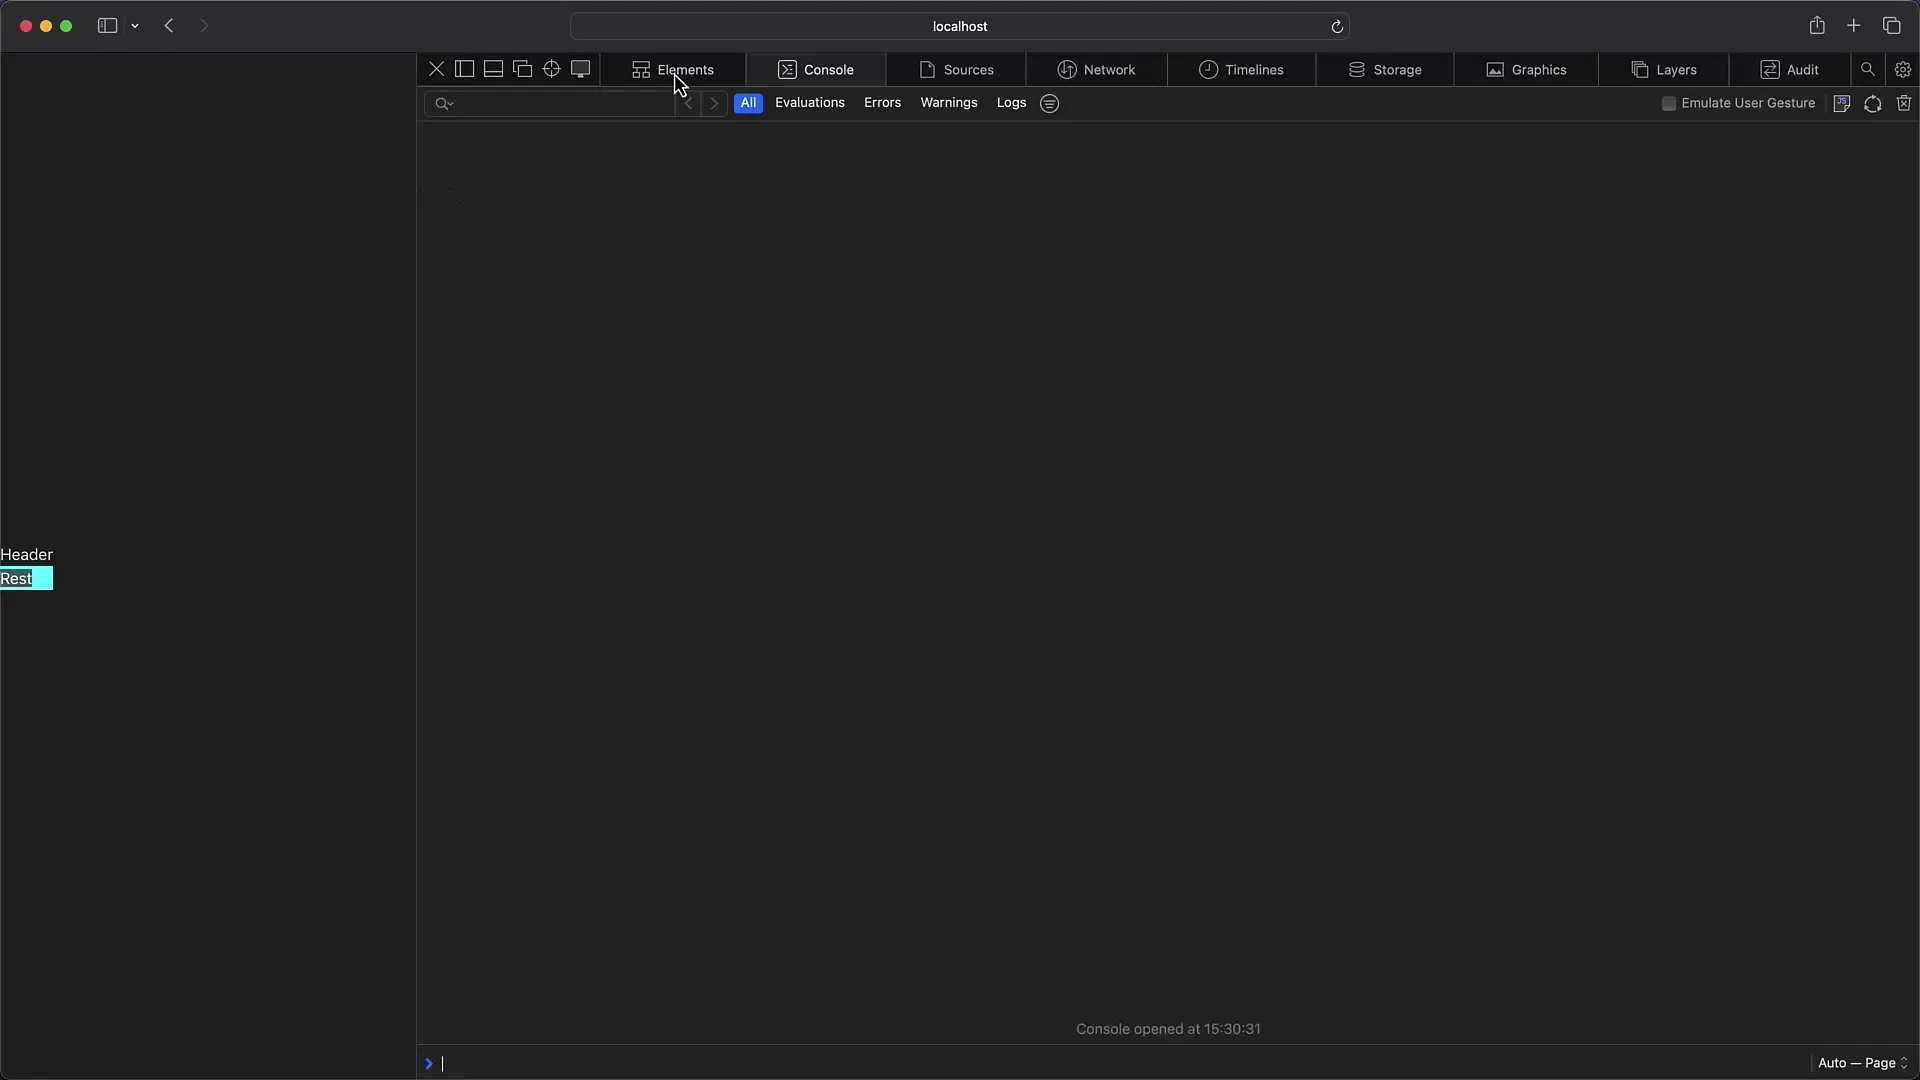
Here you can learn more about the elements of the website to view and edit their styles and layouts. You can edit any style by simply clicking on the corresponding CSS rules.
4. Working with the Console
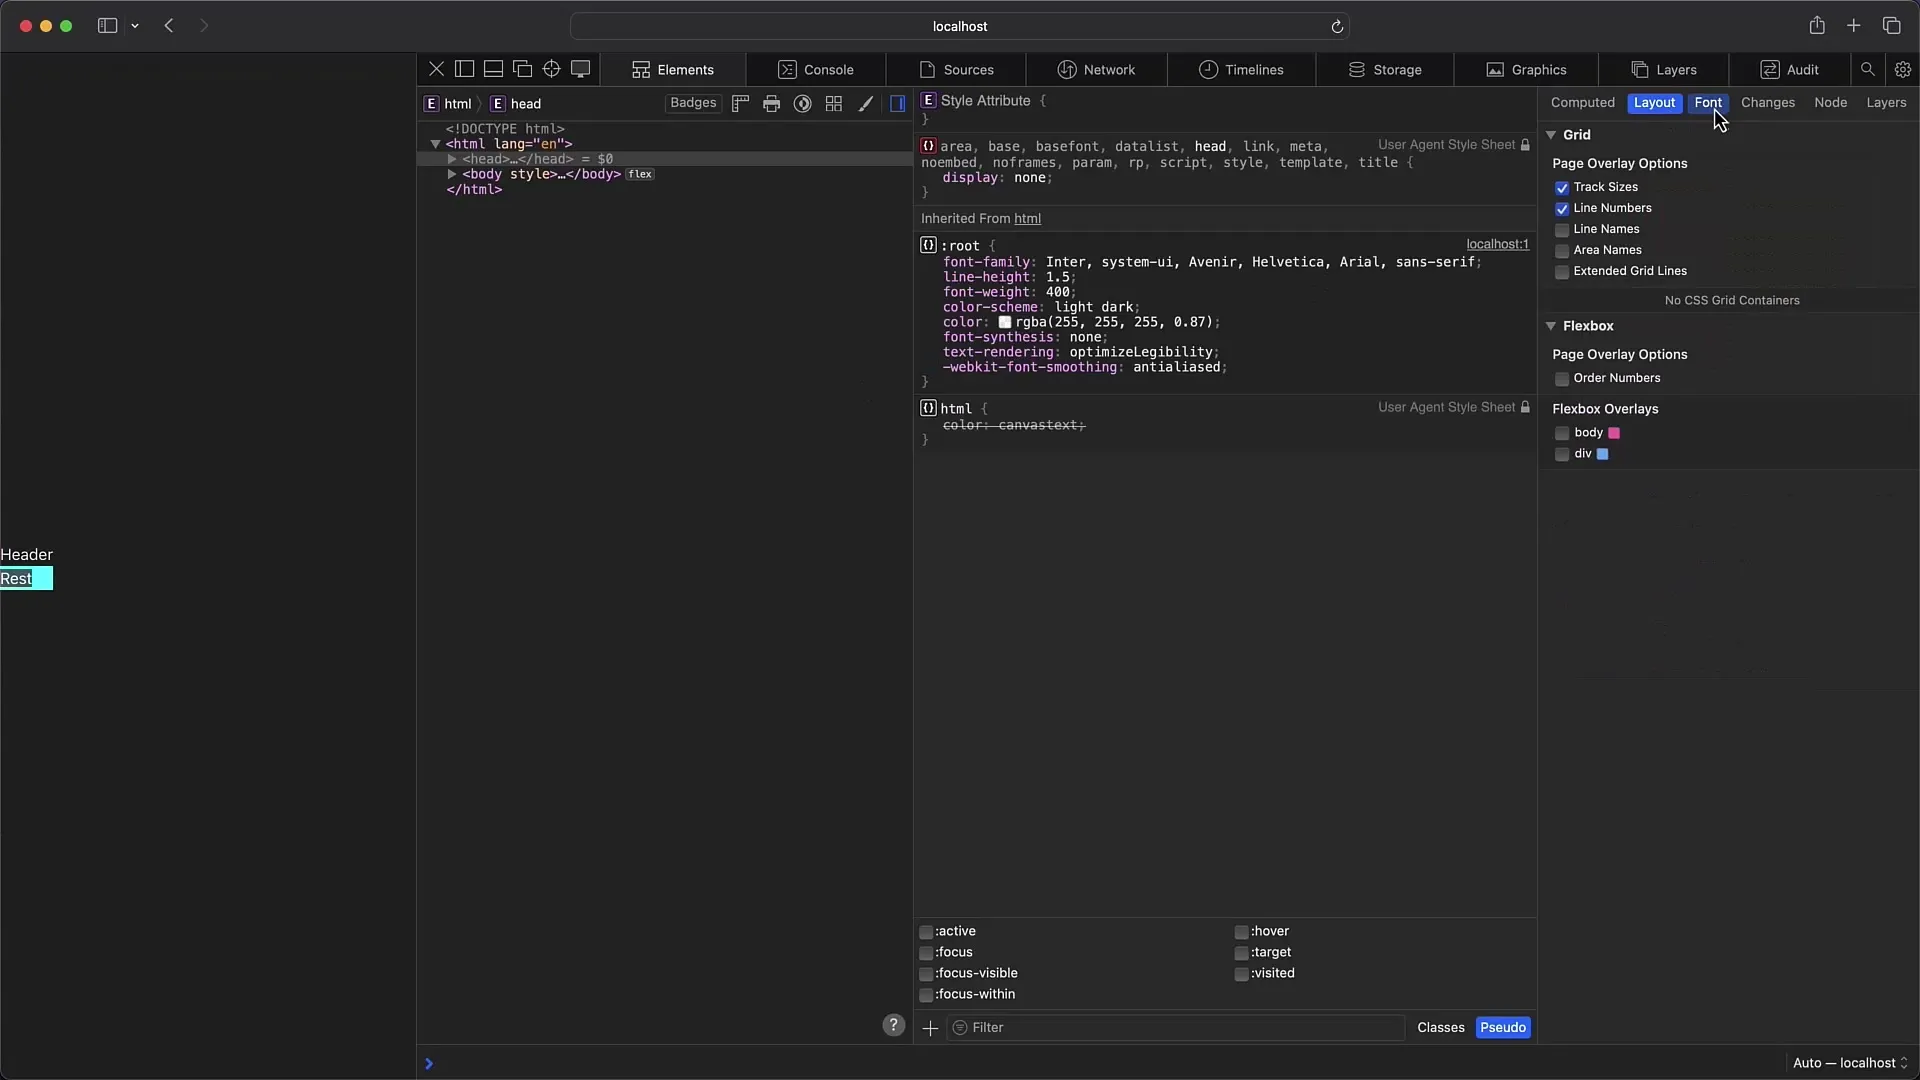
The console in Safari allows you to execute JavaScript code and display the desired outputs. An interesting aspect is that the formatting of the outputs here is different. The first argument is output as text, while all subsequent arguments are presented as JavaScript objects.
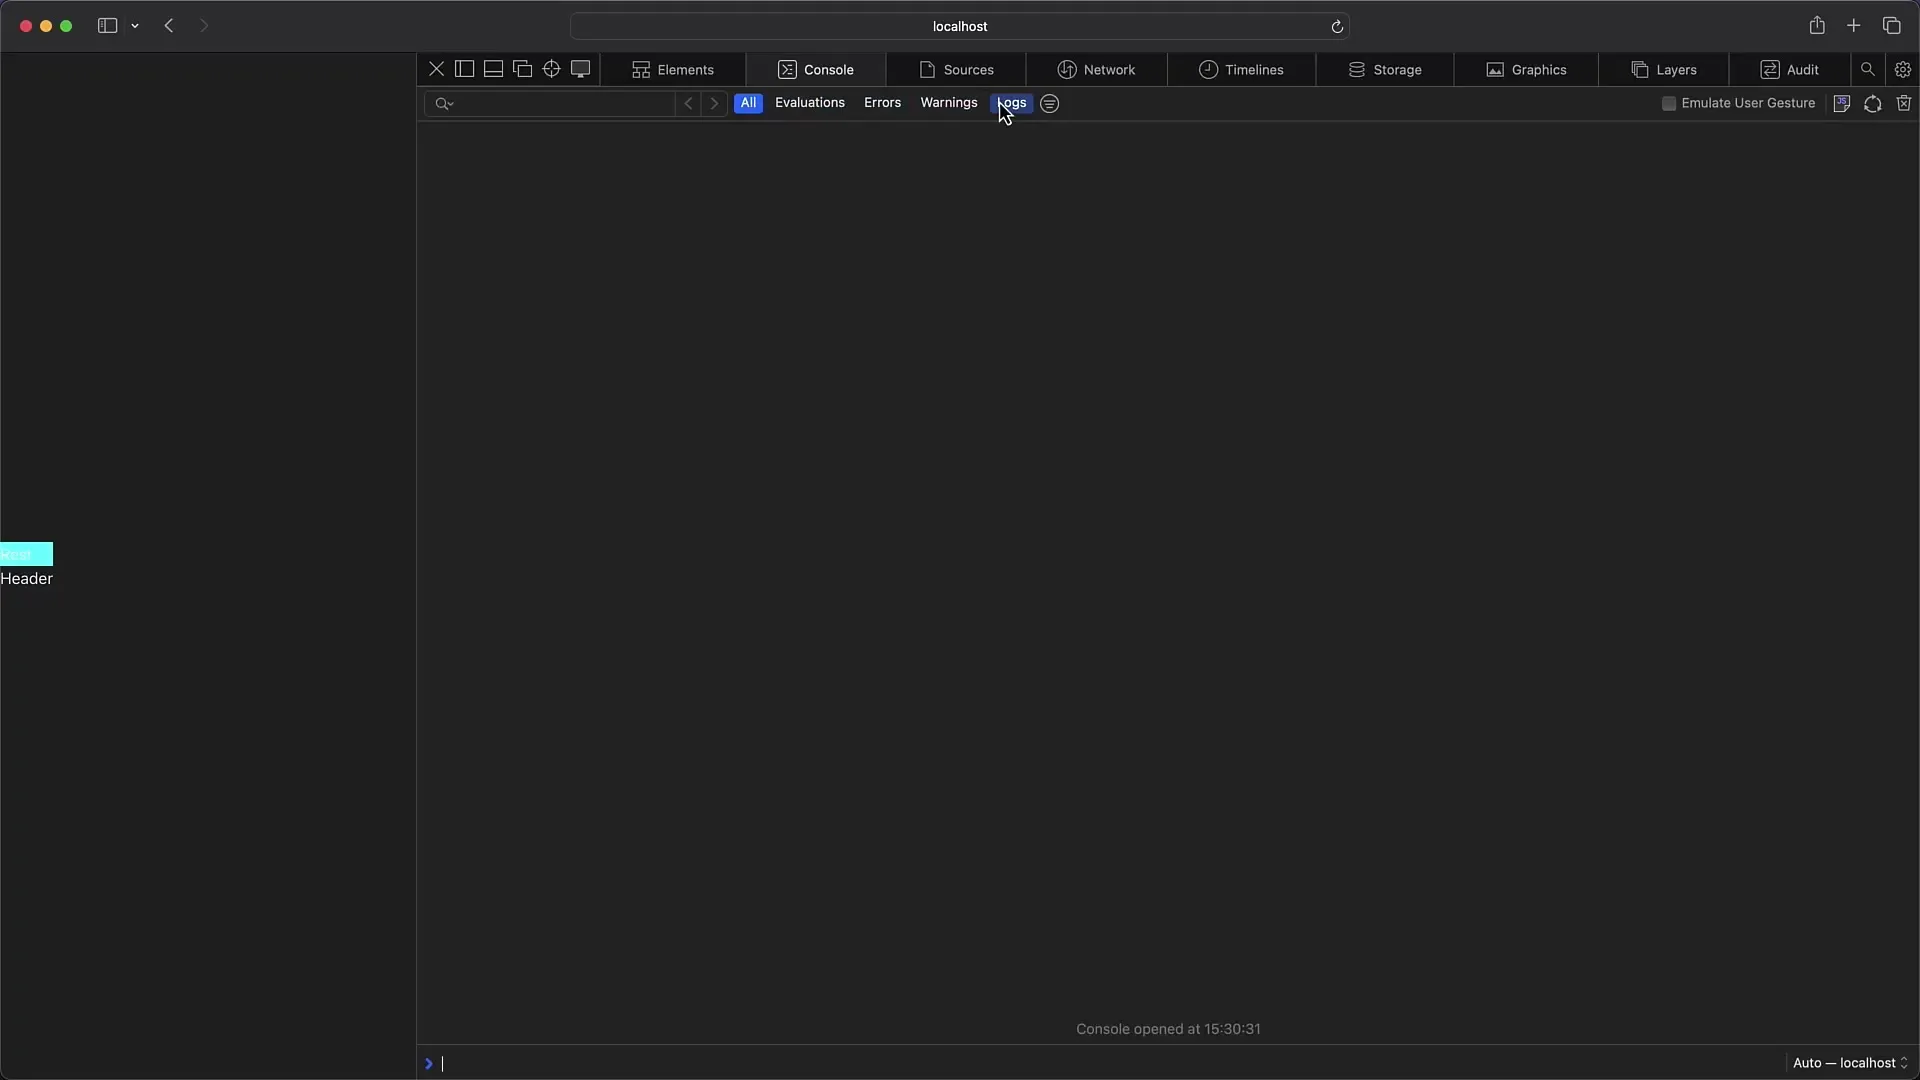
When outputting additional log messages, make sure the display does not have spaces between the individual arguments, but is separated by dashes. This could be important to avoid misunderstandings during debugging.
5. Setting Source Code and Breakpoints
In the "Sources" tab, you can view the original and transpiled files of your website. Here, it is also possible to set breakpoints to facilitate debugging. Simply click on the corresponding line of code.
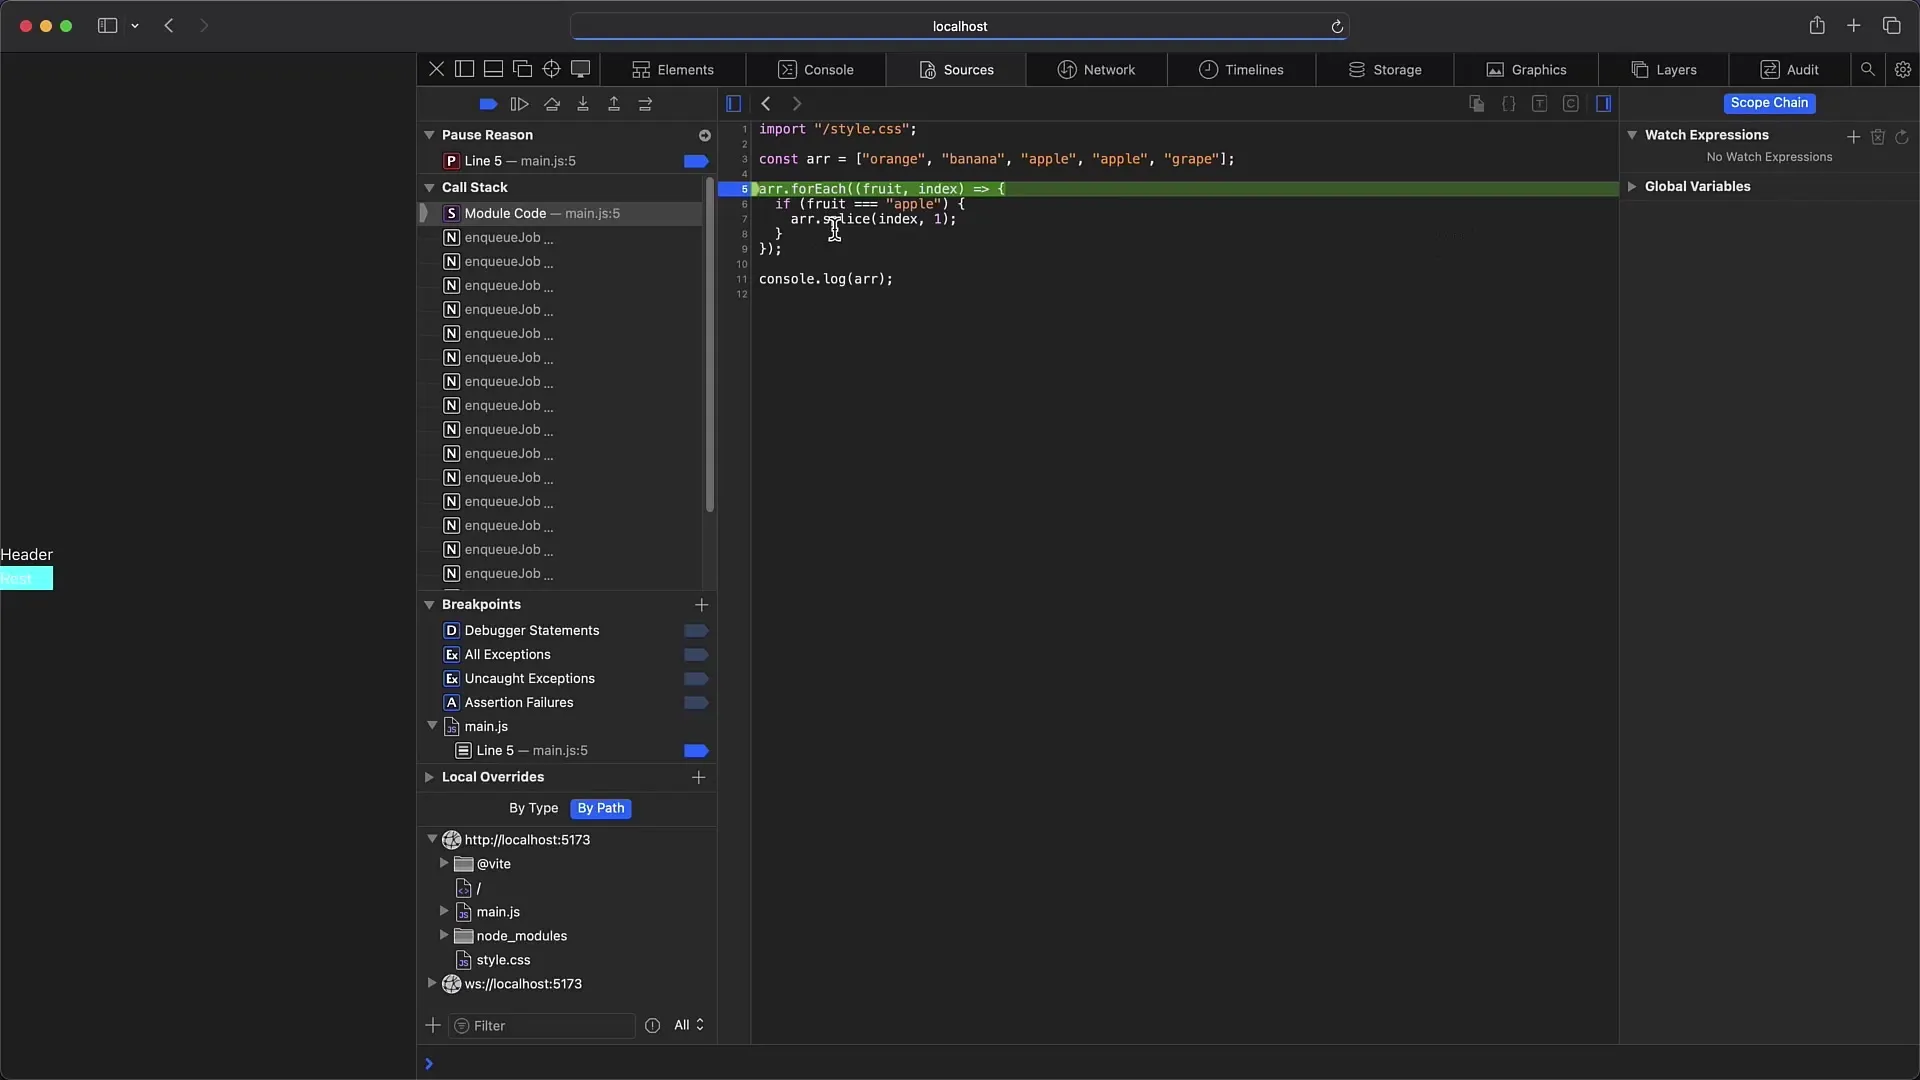
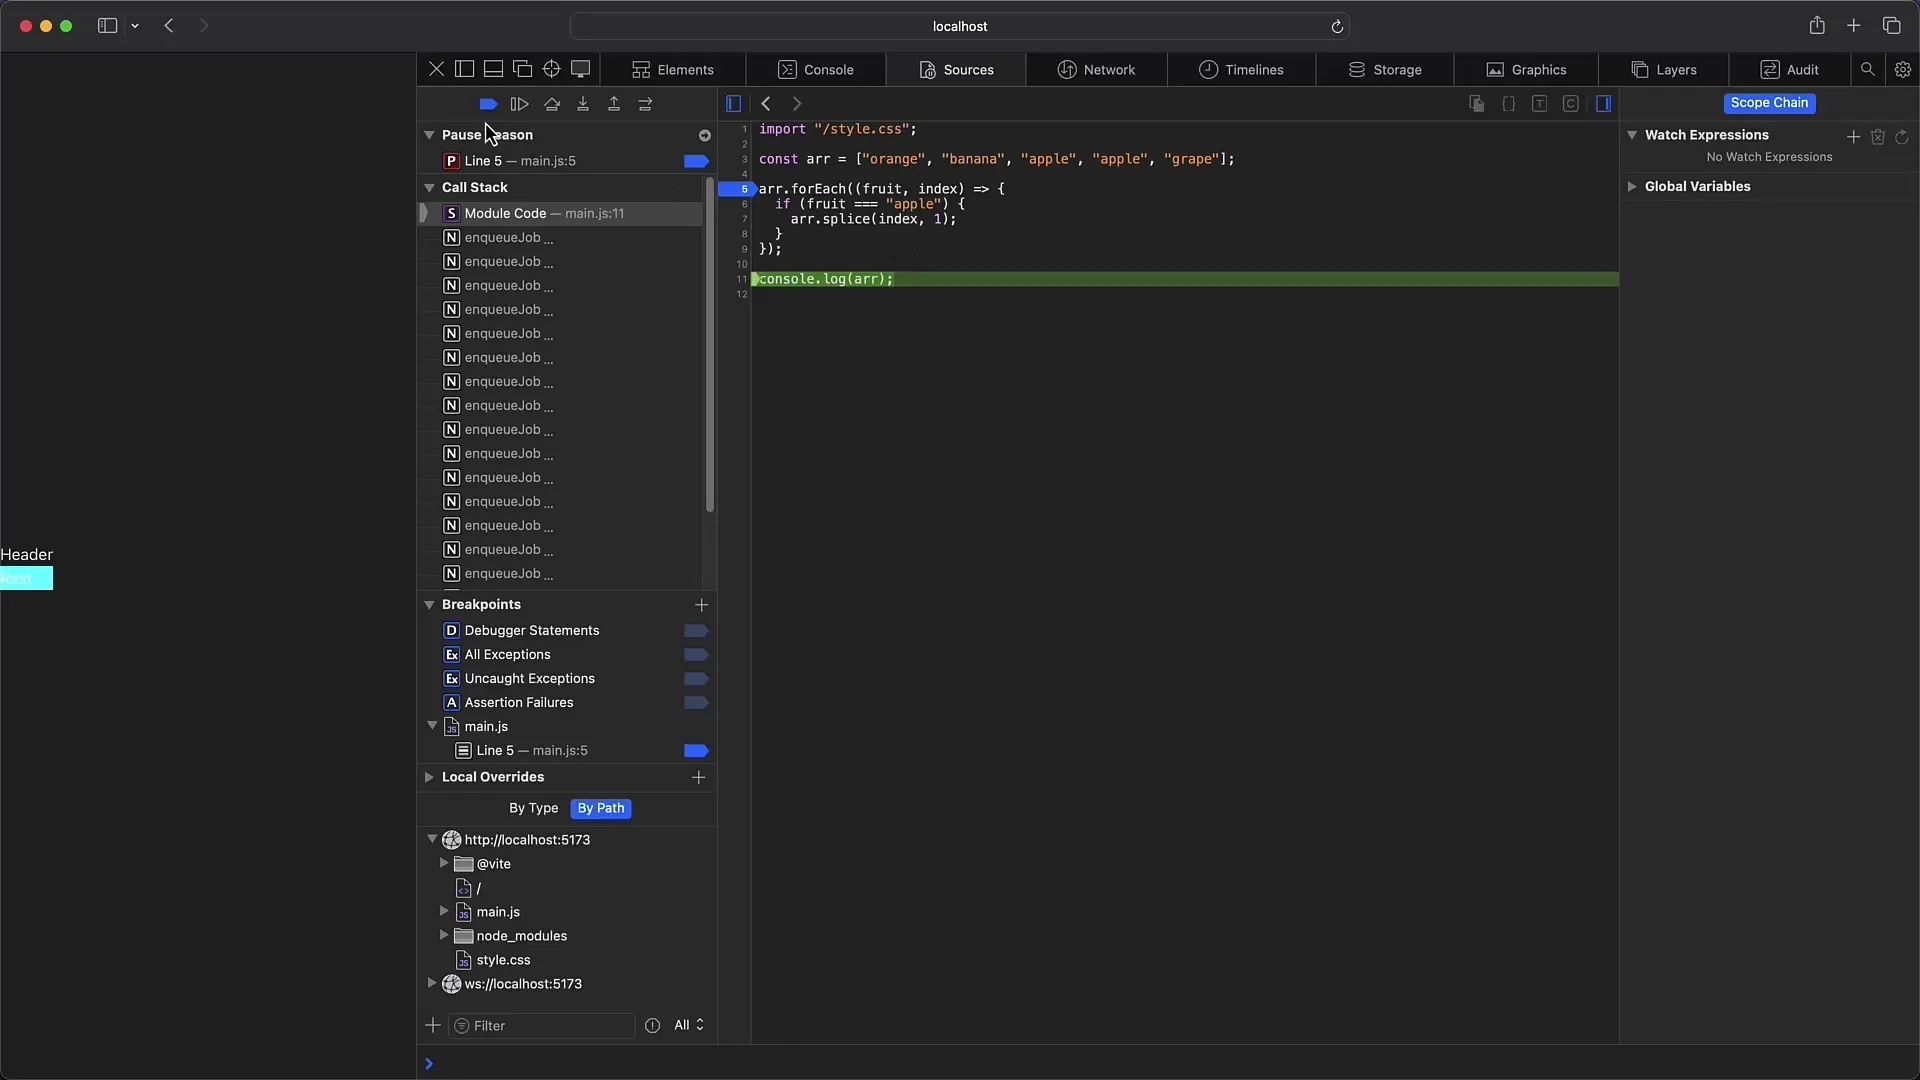
Don't forget to use the various controls to make stepping through the code easier. In Safari, the shortcut for stepping is different; instead, you use specific symbols.
6. Conducting Network Analysis
The "Network" tab provides comprehensive information on all requests made by your site during its loading time. Here you can see the requests sent and received, as well as their headers and previews.
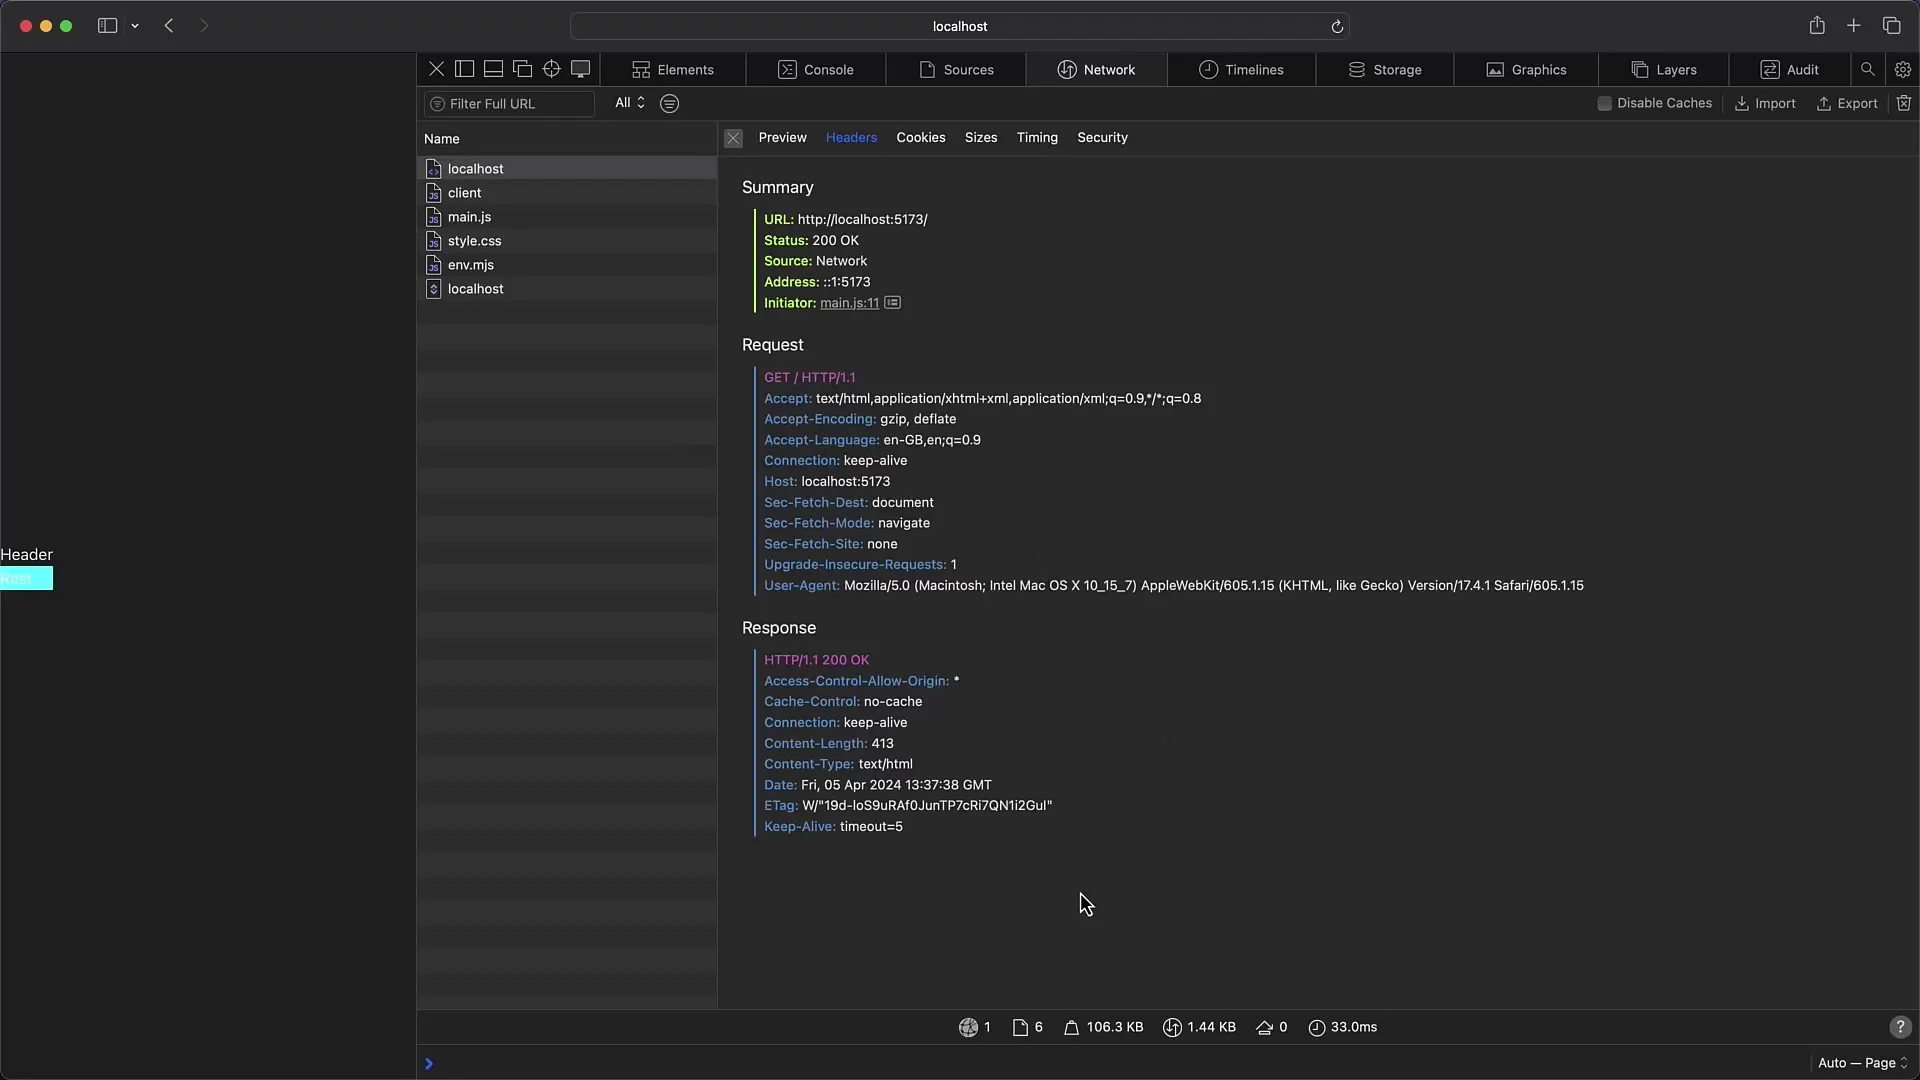
An interesting feature here is the distinction between the headers and the timings, which give you a deeper insight into the performance of your site.
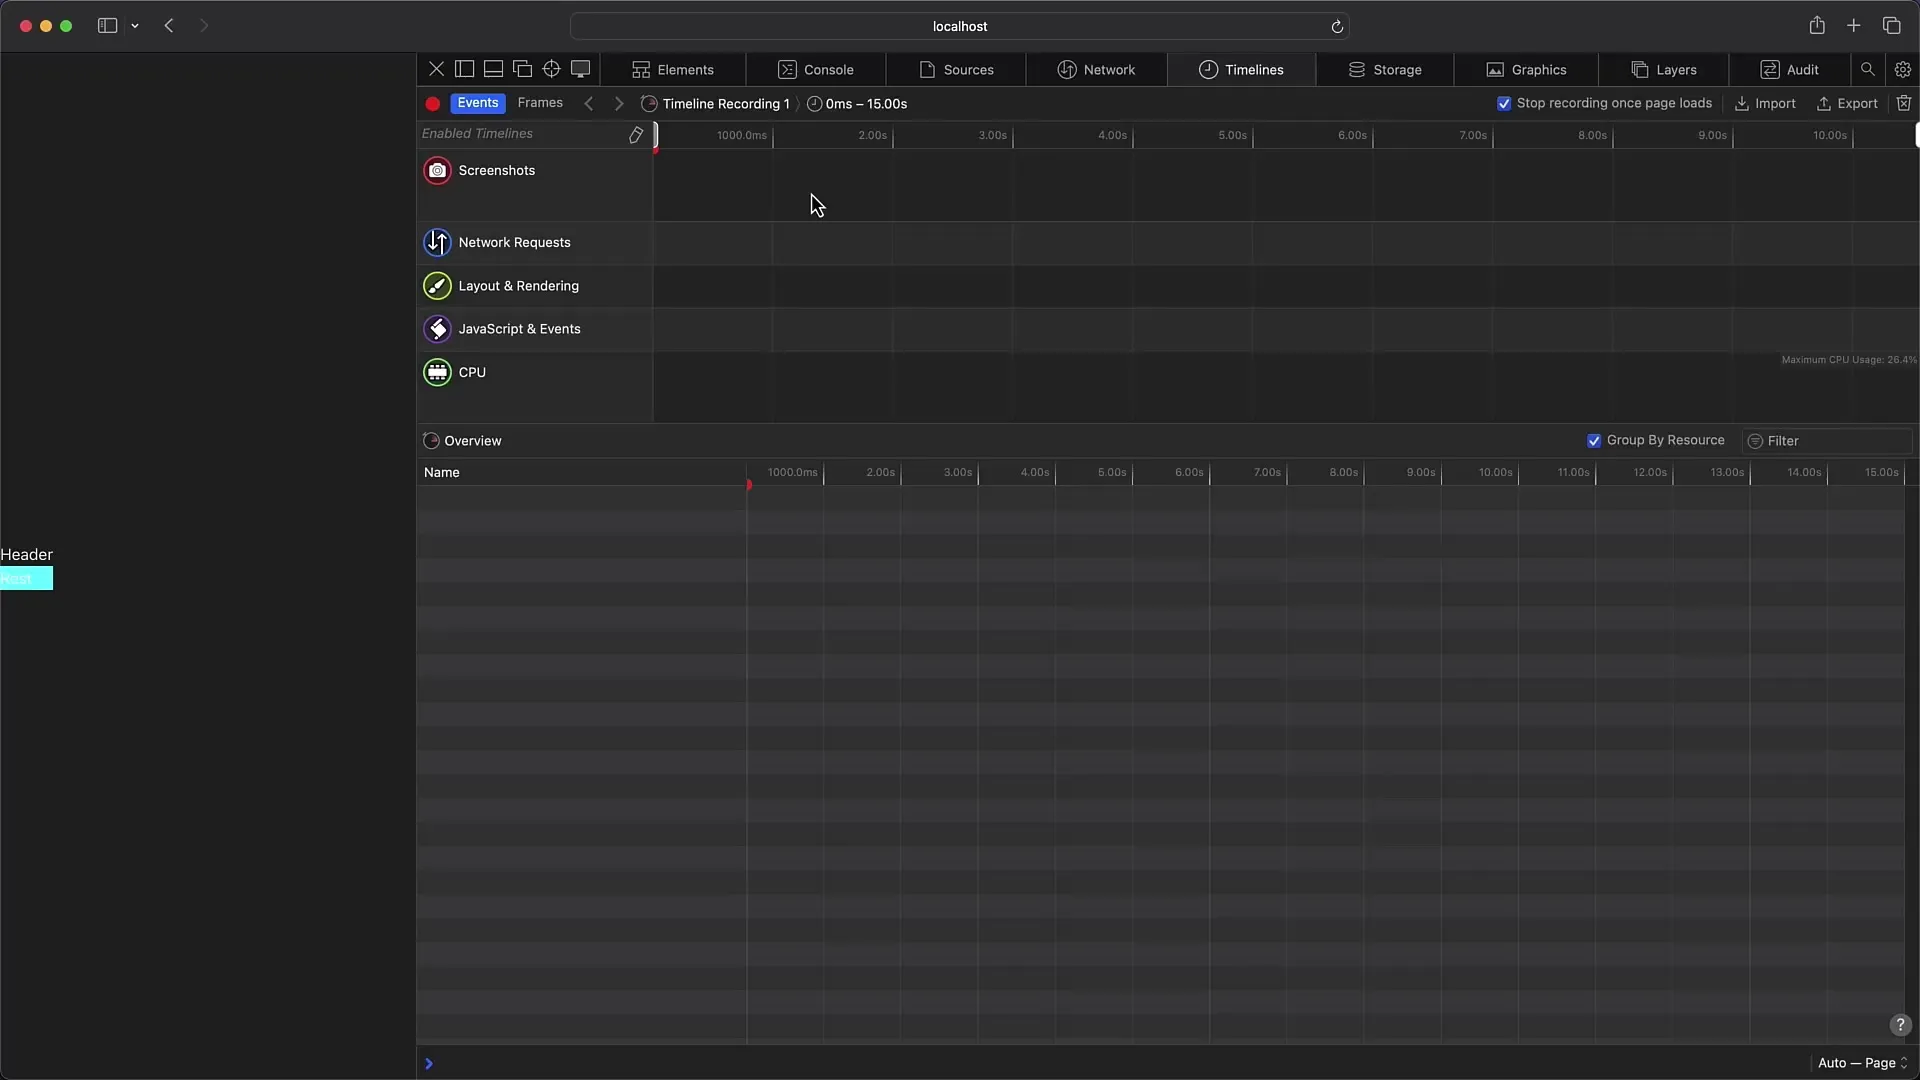
7. Using Performance Measurements and Timelines
In the "Timelines" tab, you can conduct comprehensive performance analyses and make recordings to better understand the speed and processes on your site.
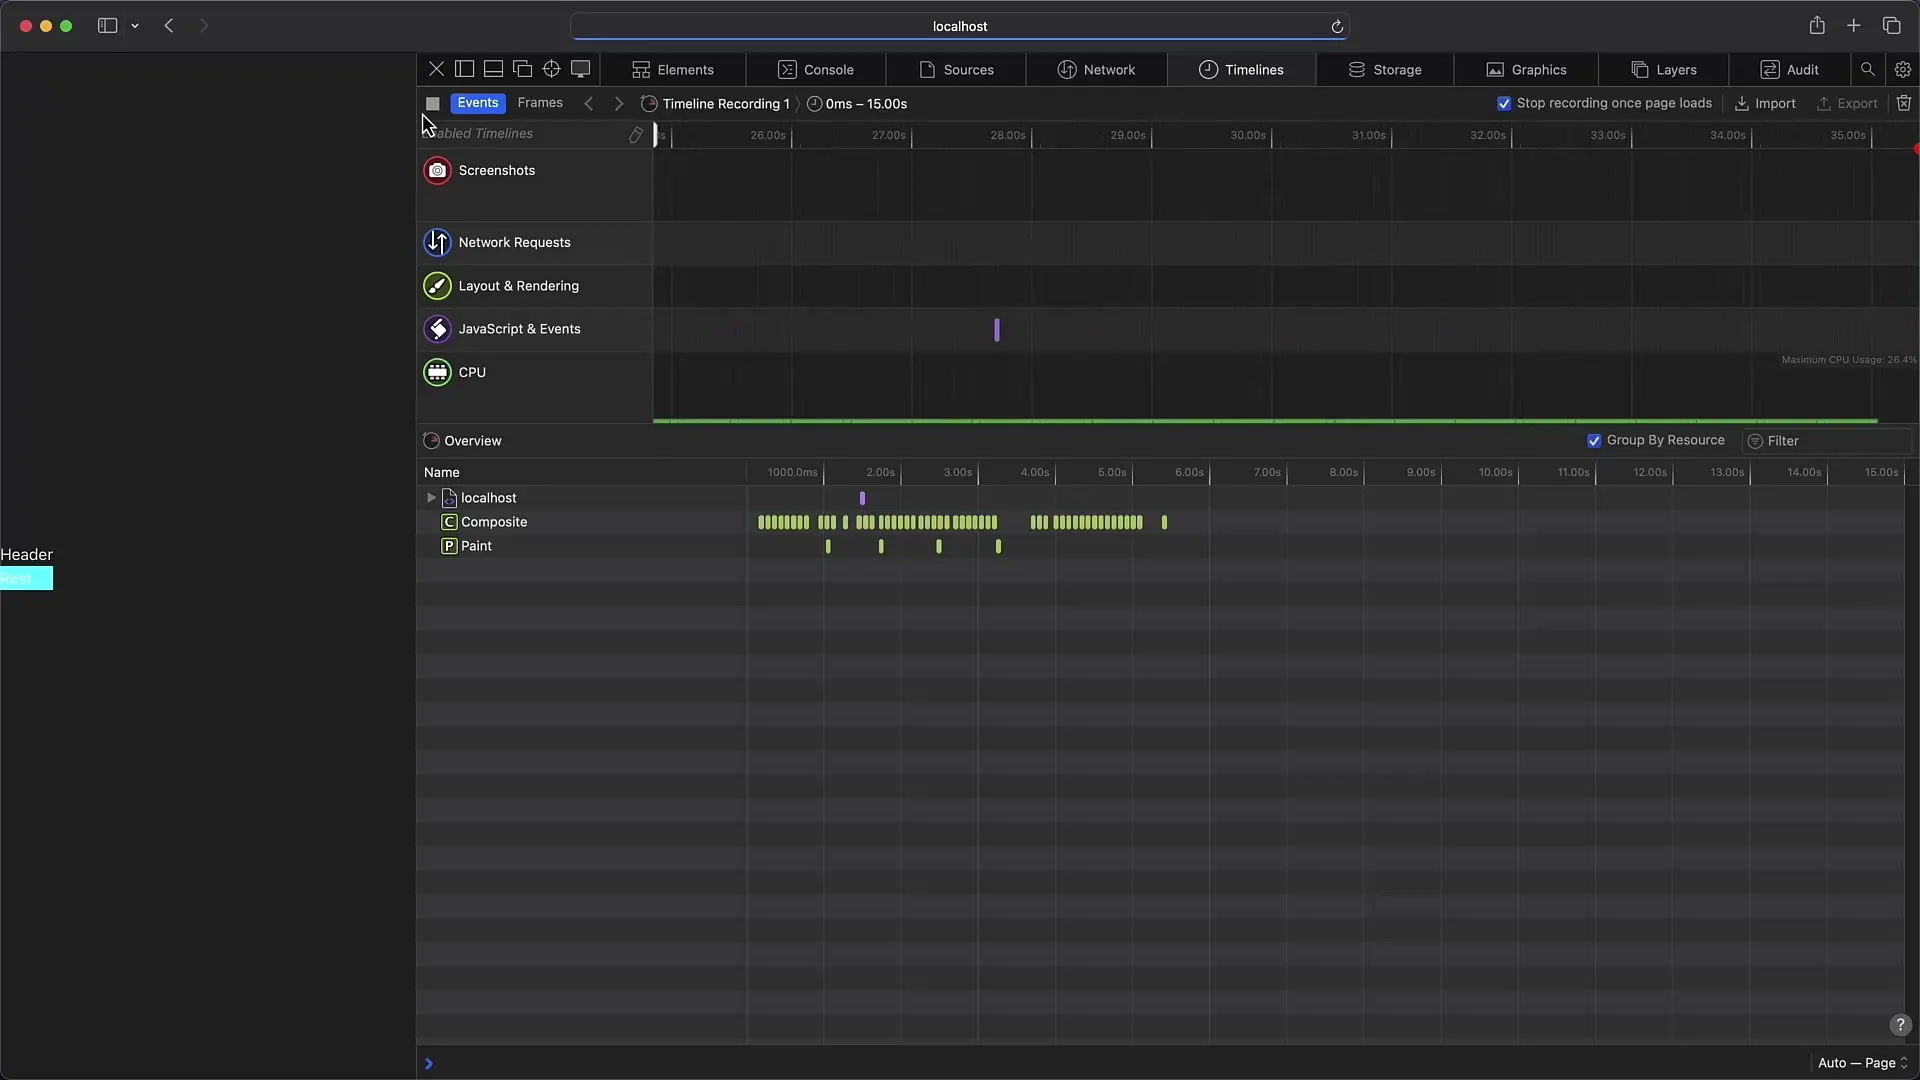
This function works similarly to the performance profiles in other browsers, but you may need to get accustomed to some differences in presentation and naming.
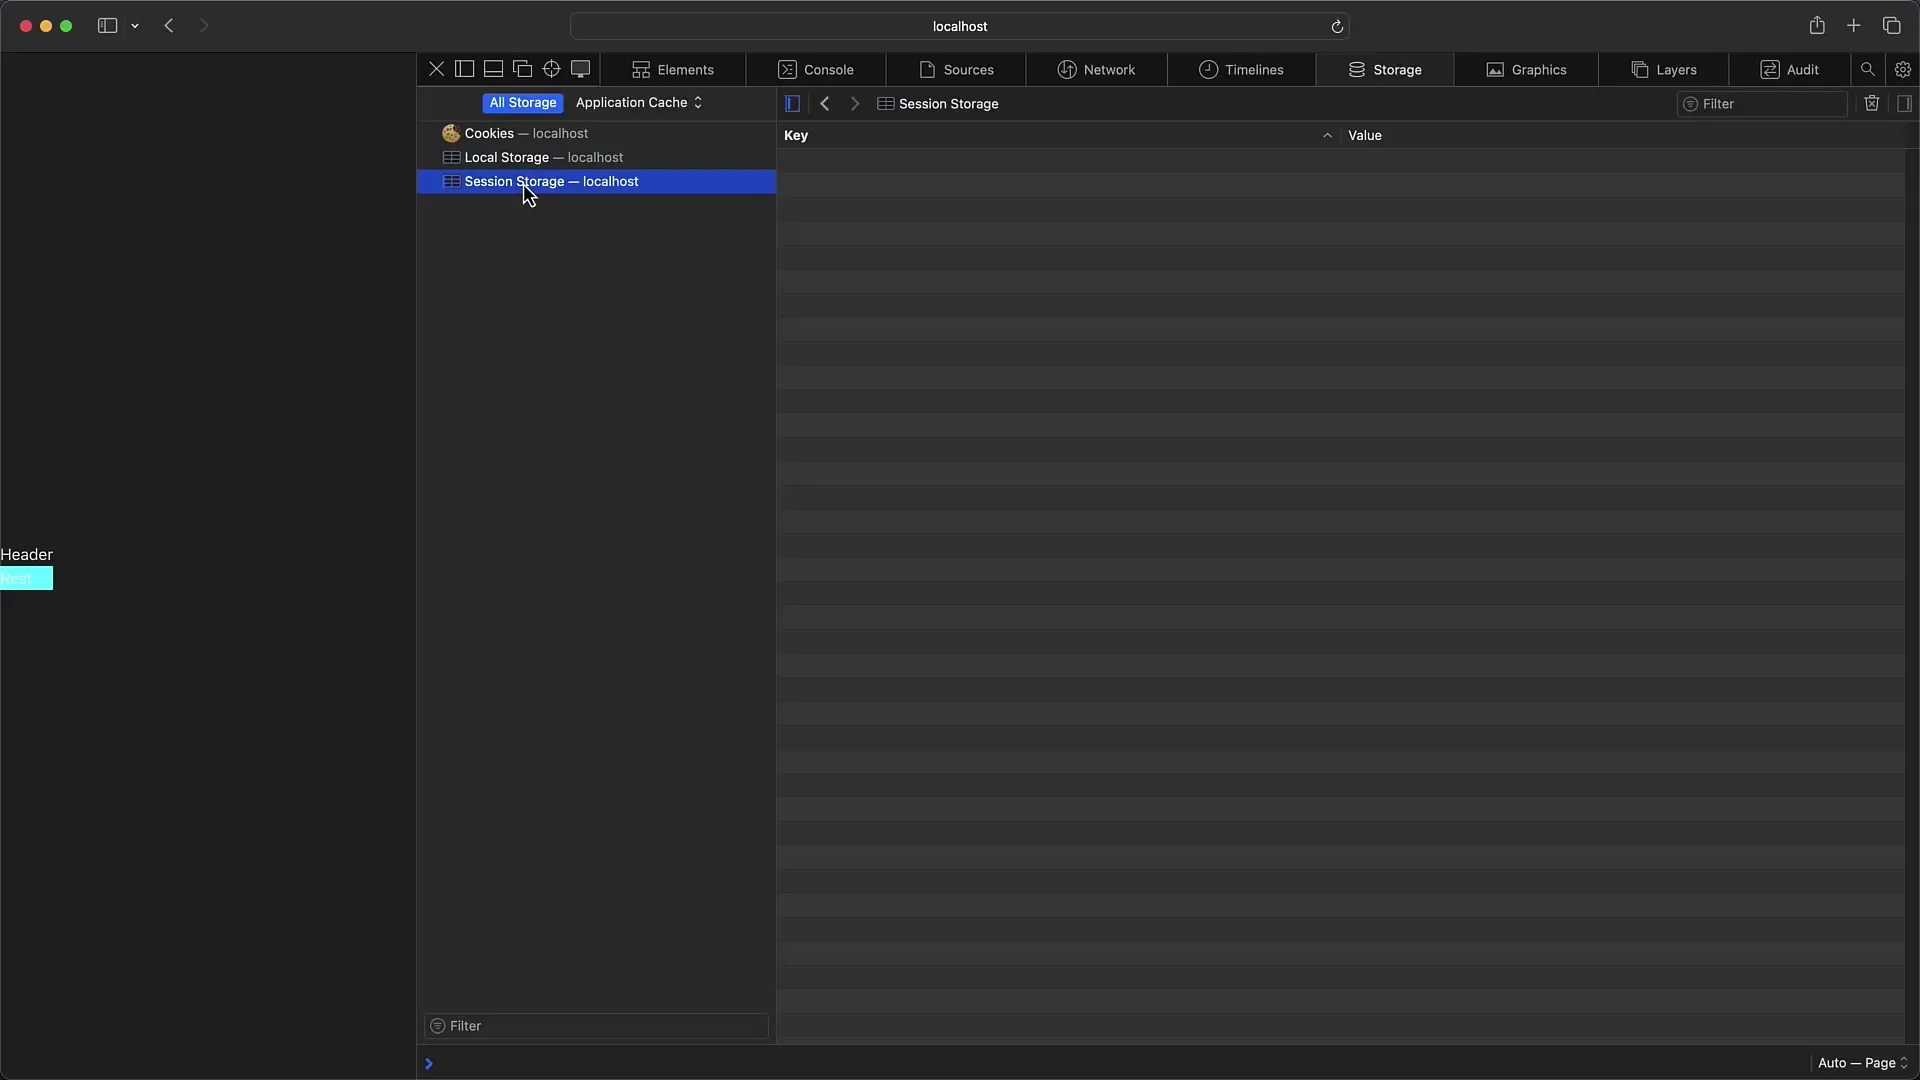
8. Debugging on Mobile Devices
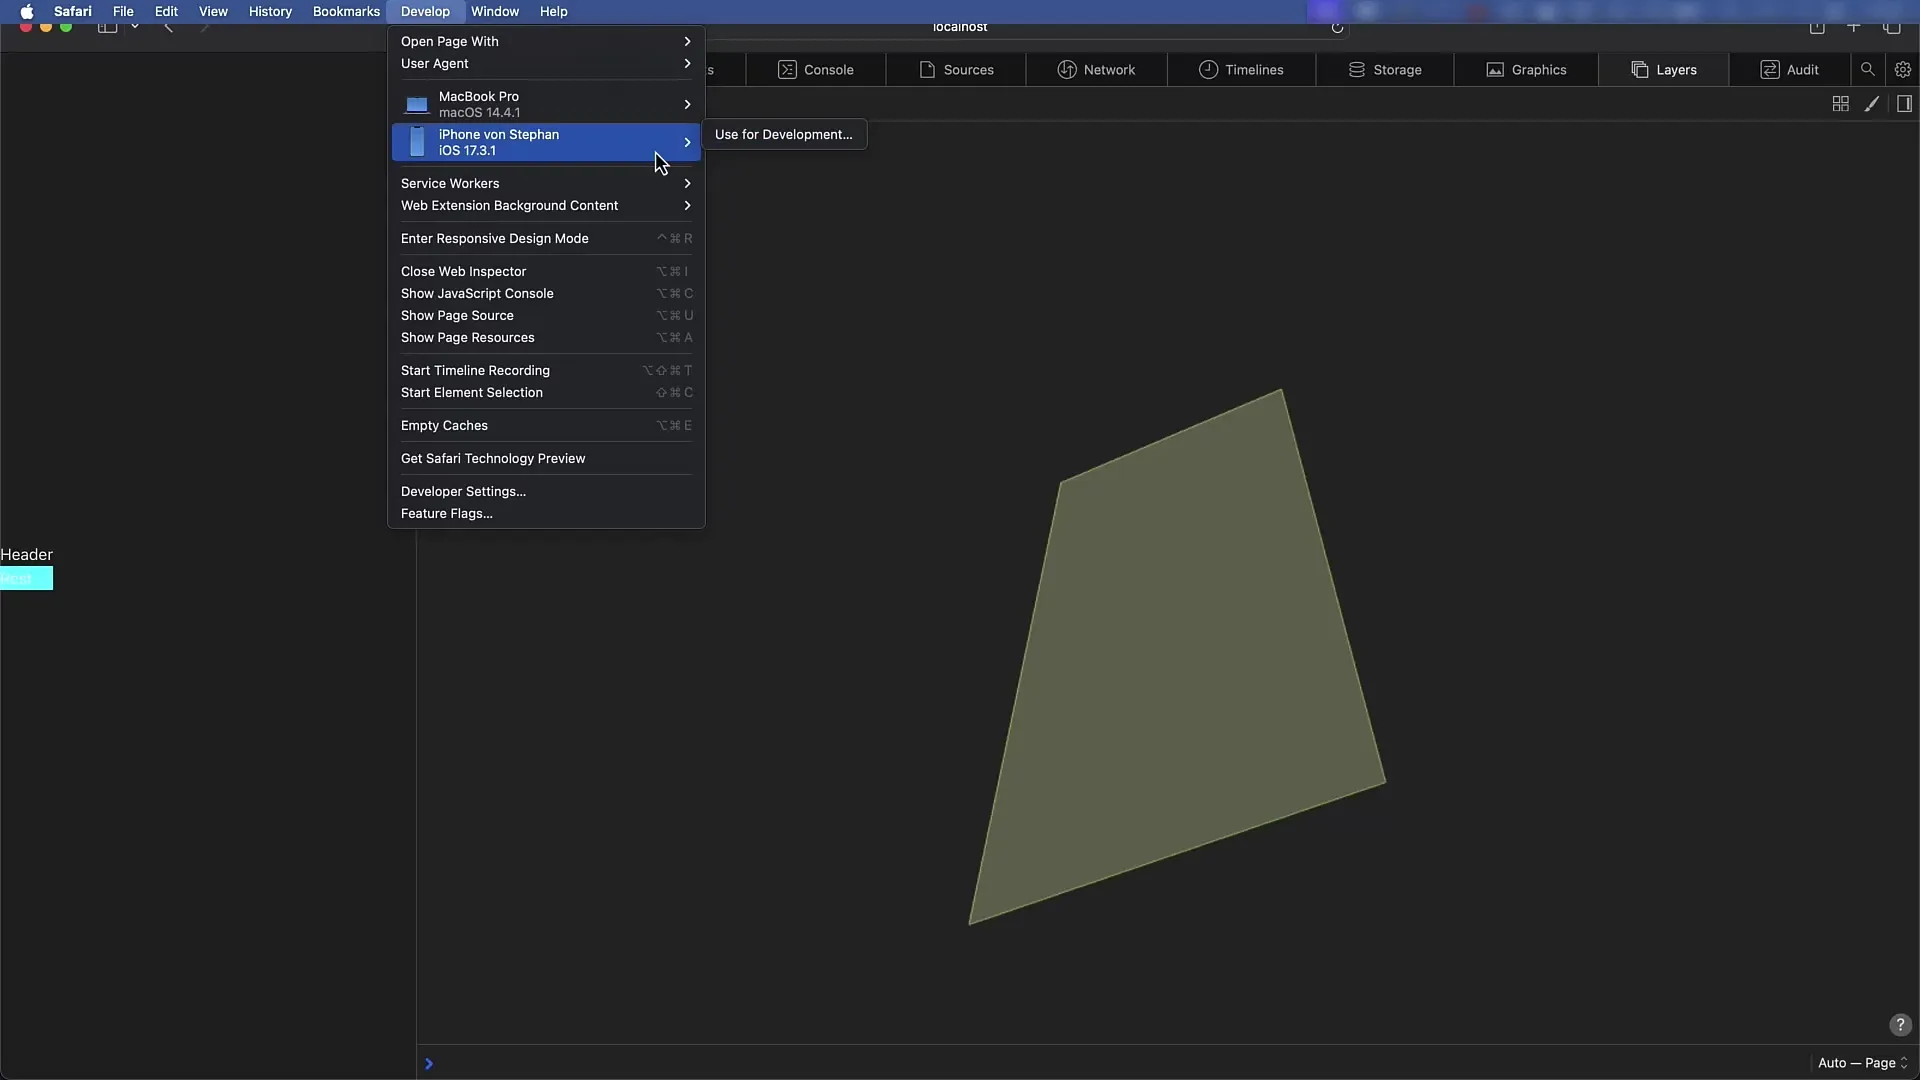
A special highlight of the Safari Developer Tools is the ability to debug websites on your iPhone or iPad. Connect your device via USB and activate the corresponding debugging options in the device settings.
Then go to the "Develop" menu and select your connected device to access the open windows and their Developer Tools.
Summary
In this comprehensive guide, you have learned how to activate the Safari Developer Tools, use the various functions and tabs, and perform debugging on mobile devices. Most functions are similar to the tools in other browsers, but there are specific differences, particularly in the user interface and shortcuts. Once you get familiar with it, debugging in Safari will become quick and easy for you.

