In this guide, you will learn how to efficiently work with the Exception-Breakpoints of the Chrome Developer Tools. Exception-Breakpoints allow you to debug your JavaScript by automatically pausing the program when an exception occurs. This is particularly useful when you want to track and understand errors in the code and where and why they occur. The use of breakpoints is an essential skill for any developer who wants to ensure that their code is error-free. Let's dive straight into the details!
Key Insights
- Exception-Breakpoints pause the program when an exception occurs.
- You can differentiate between "Uncaught" and "Caught" exceptions.
- Inserting the debugger; statement allows you to pause the program at a specific point.
- It's important to remove debugger; statements after debugging is complete to keep the production code clean.
Step-by-Step Guide
1. Activating Exception-Breakpoints
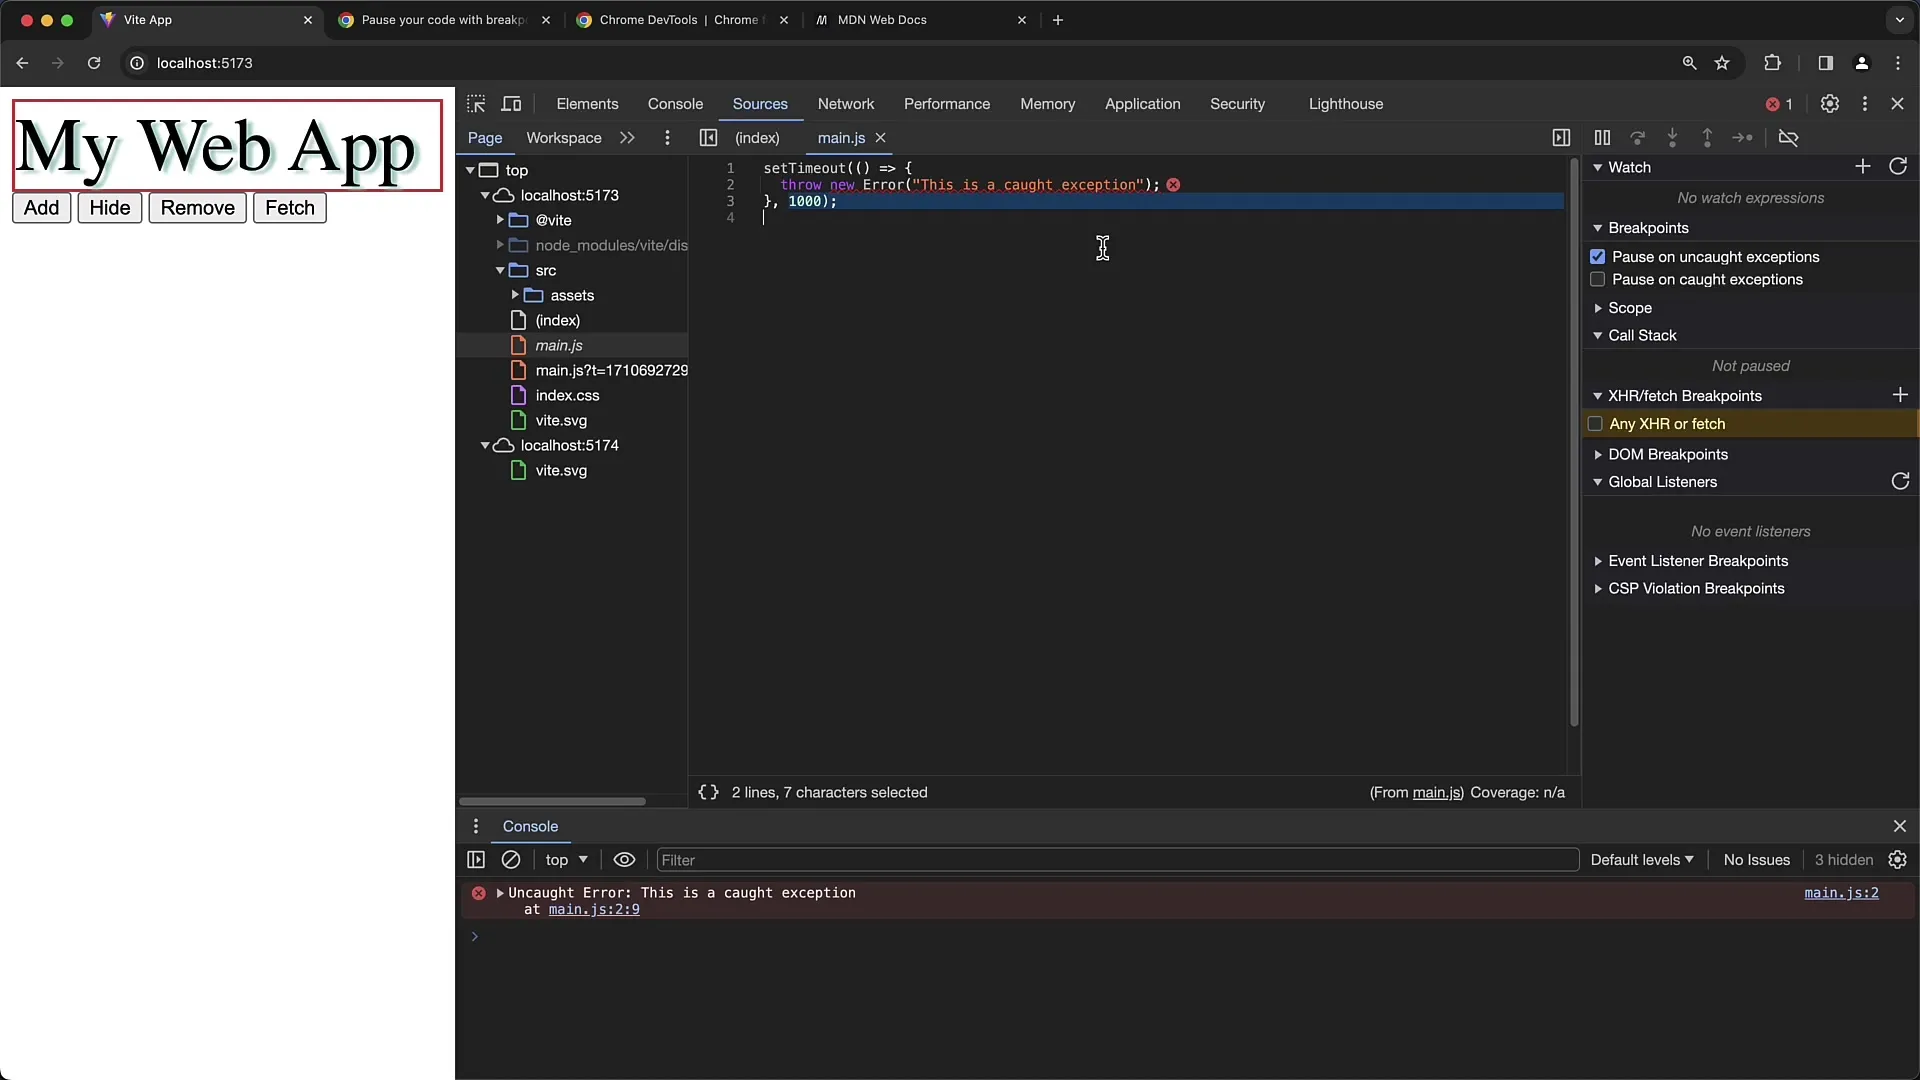
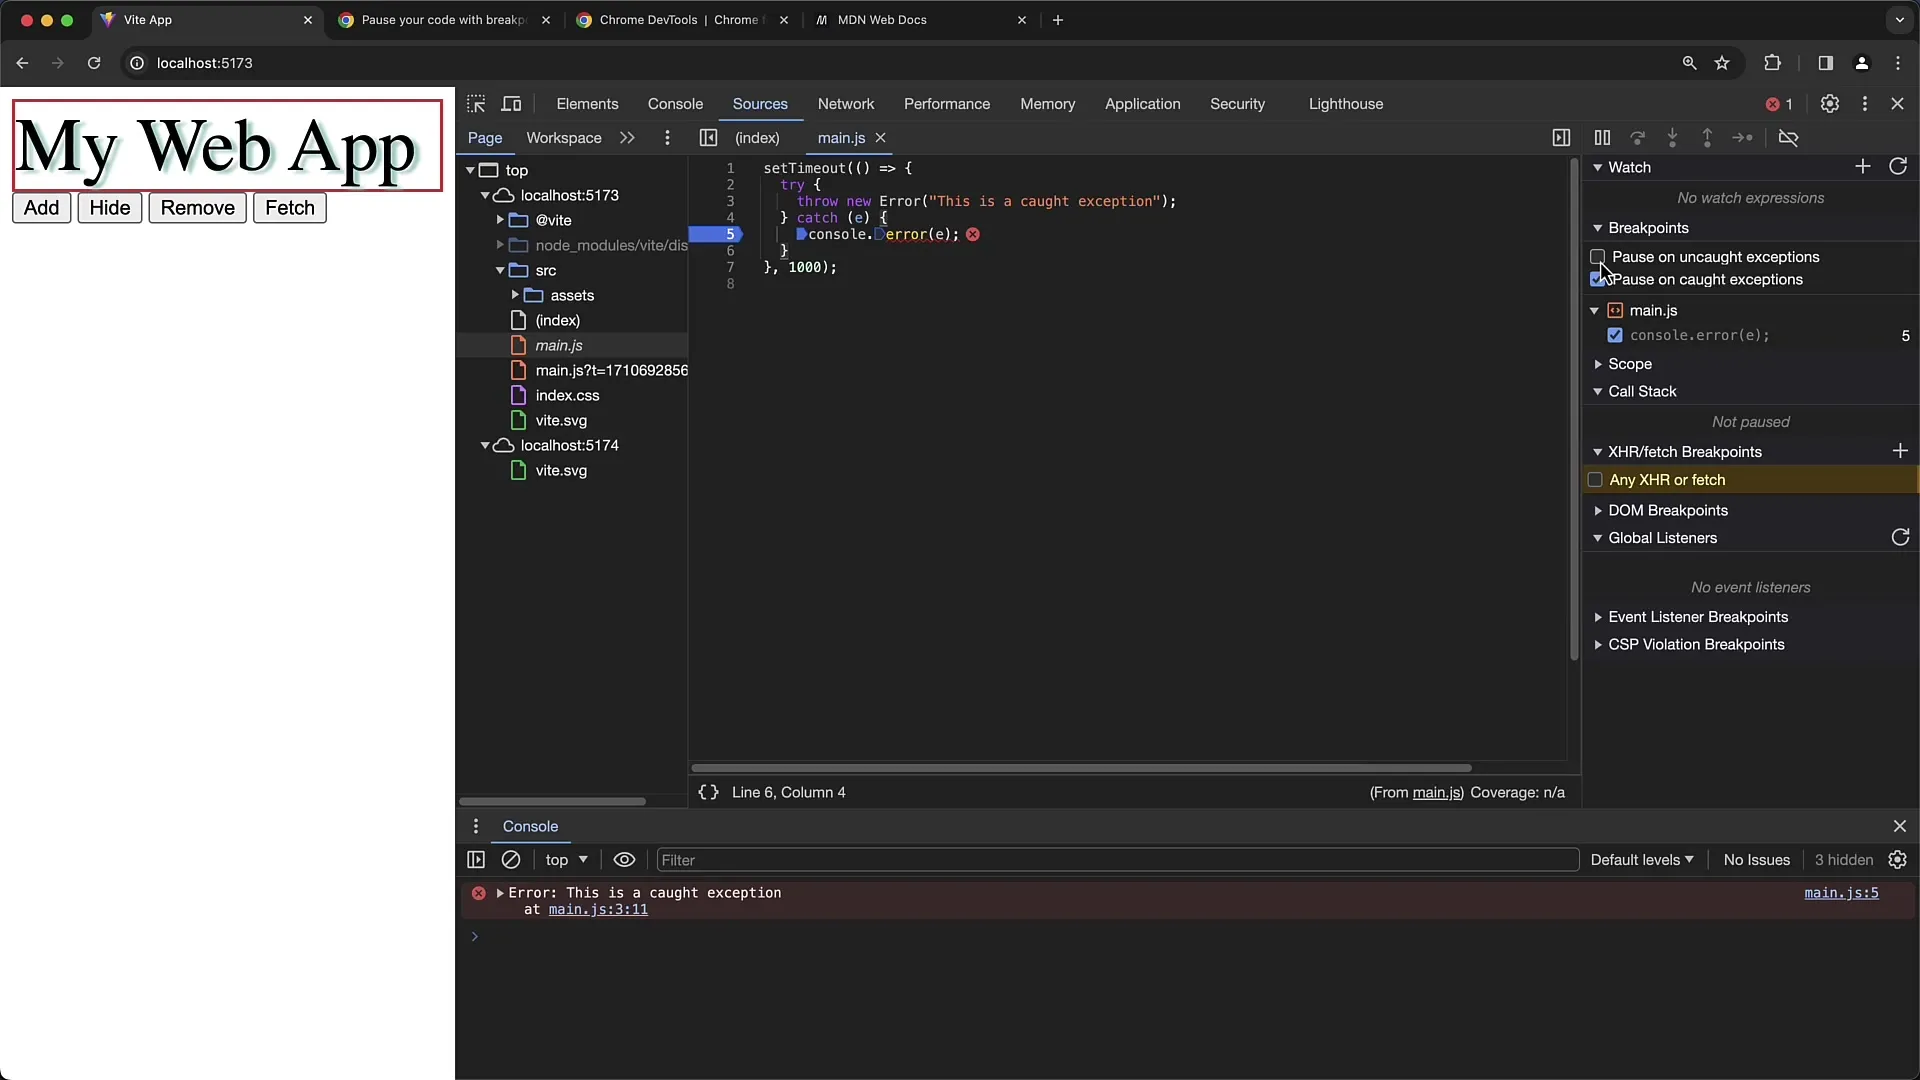
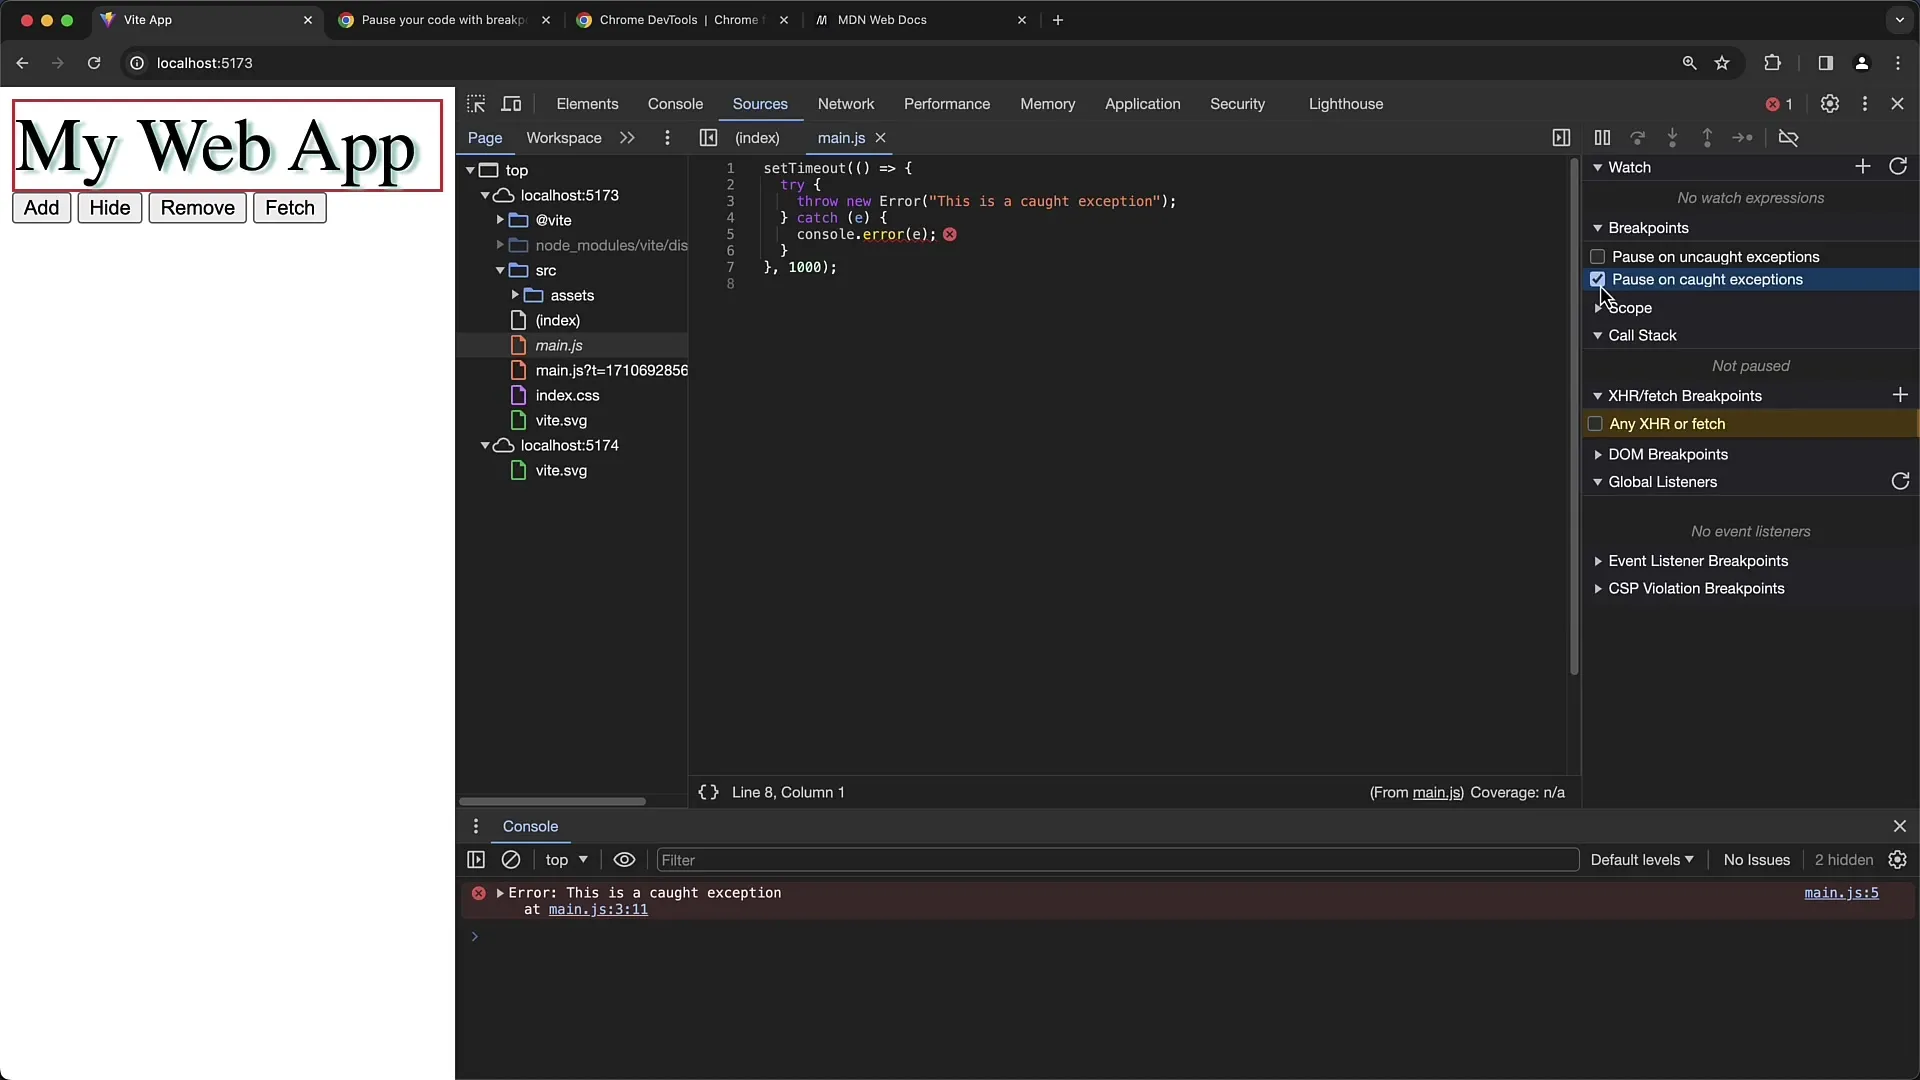
To activate automatic pausing on exceptions, open the Chrome Developer Tools. Go to the "Sources" menu and look for the "Breakpoints" section. Check the boxes for "Pause on Exceptions" and "Pause on Caught Exceptions."
Now, the program will automatically pause when an exception occurs. You can do this by using the following code that triggers a simple exception.
When you execute the code now, the program will pause at the point where the exception is thrown.

2. Handling "Caught" and "Uncaught" Exceptions
If you disable the option for "Caught Exceptions," you will notice that the program does not pause on caught exceptions.
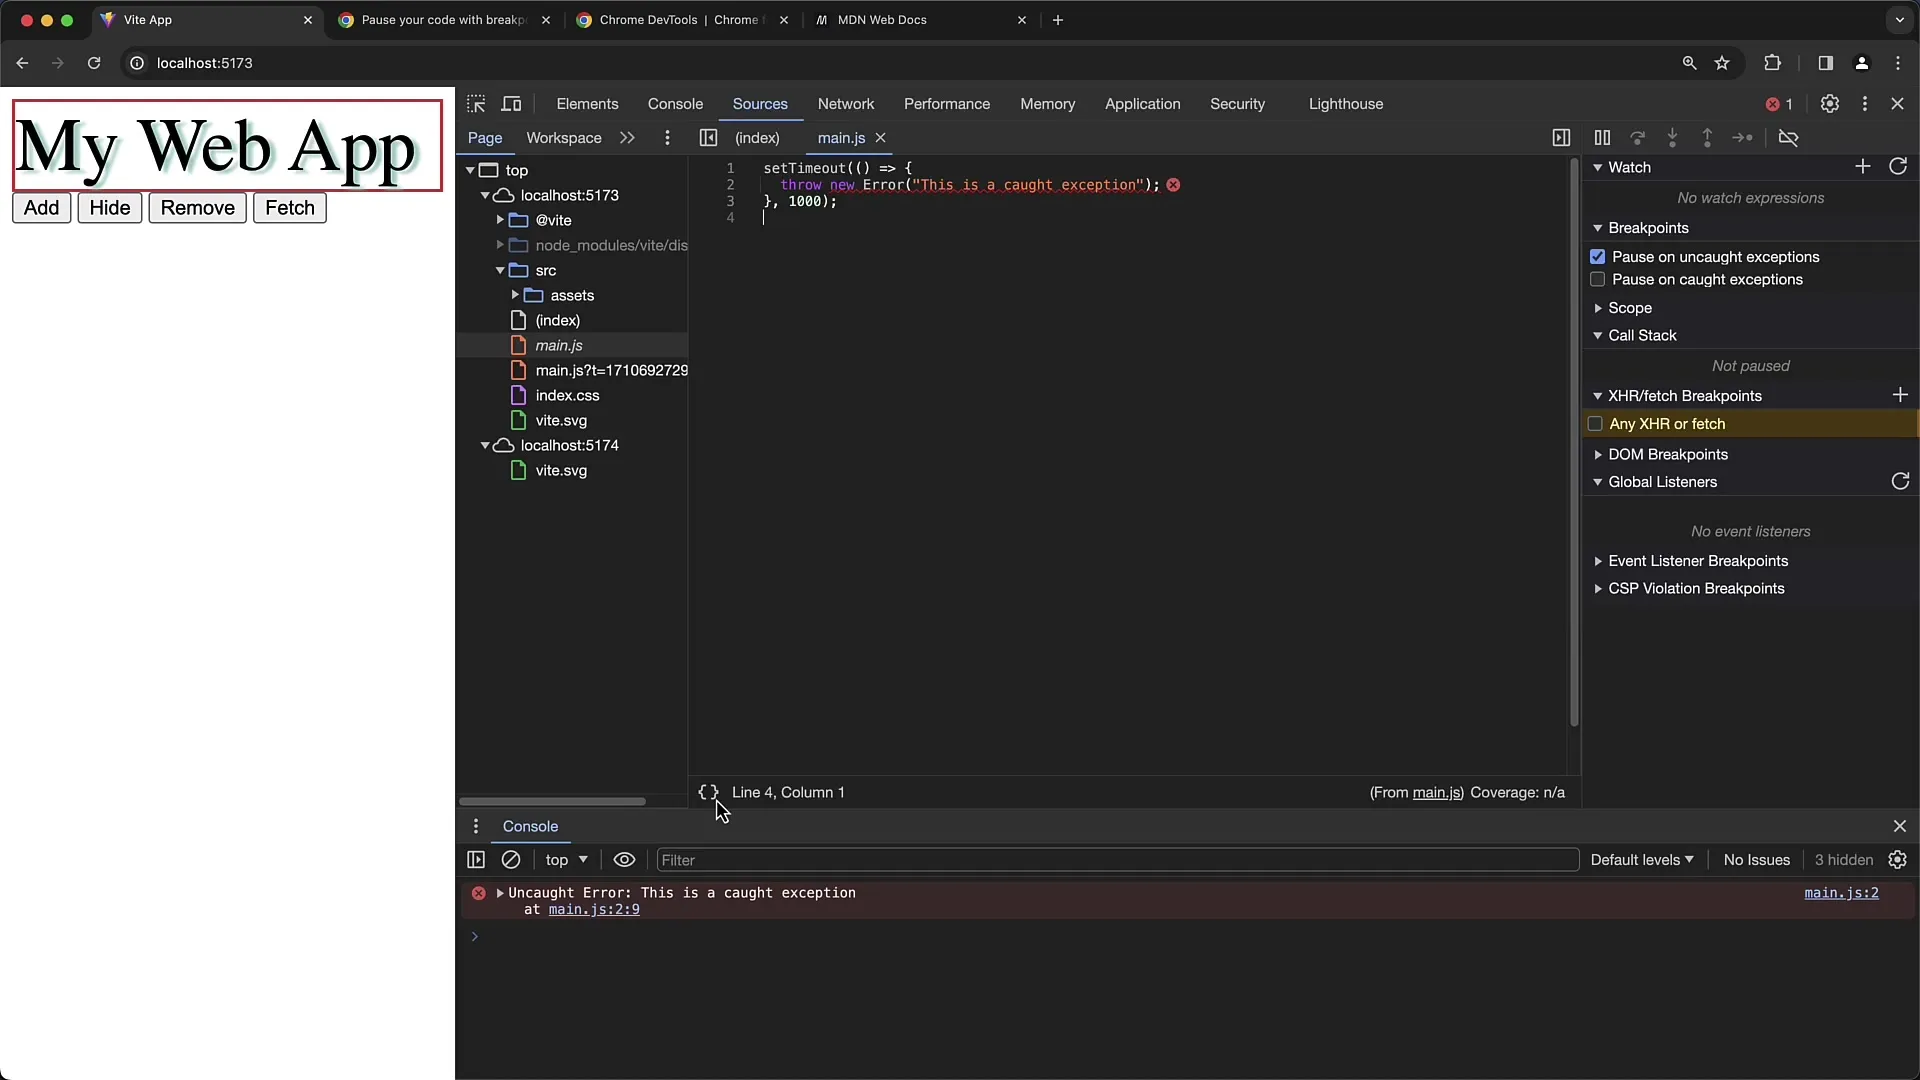
However, if you have an exception in a try-catch block, the exception will be caught in the catch block, and the program will continue there.
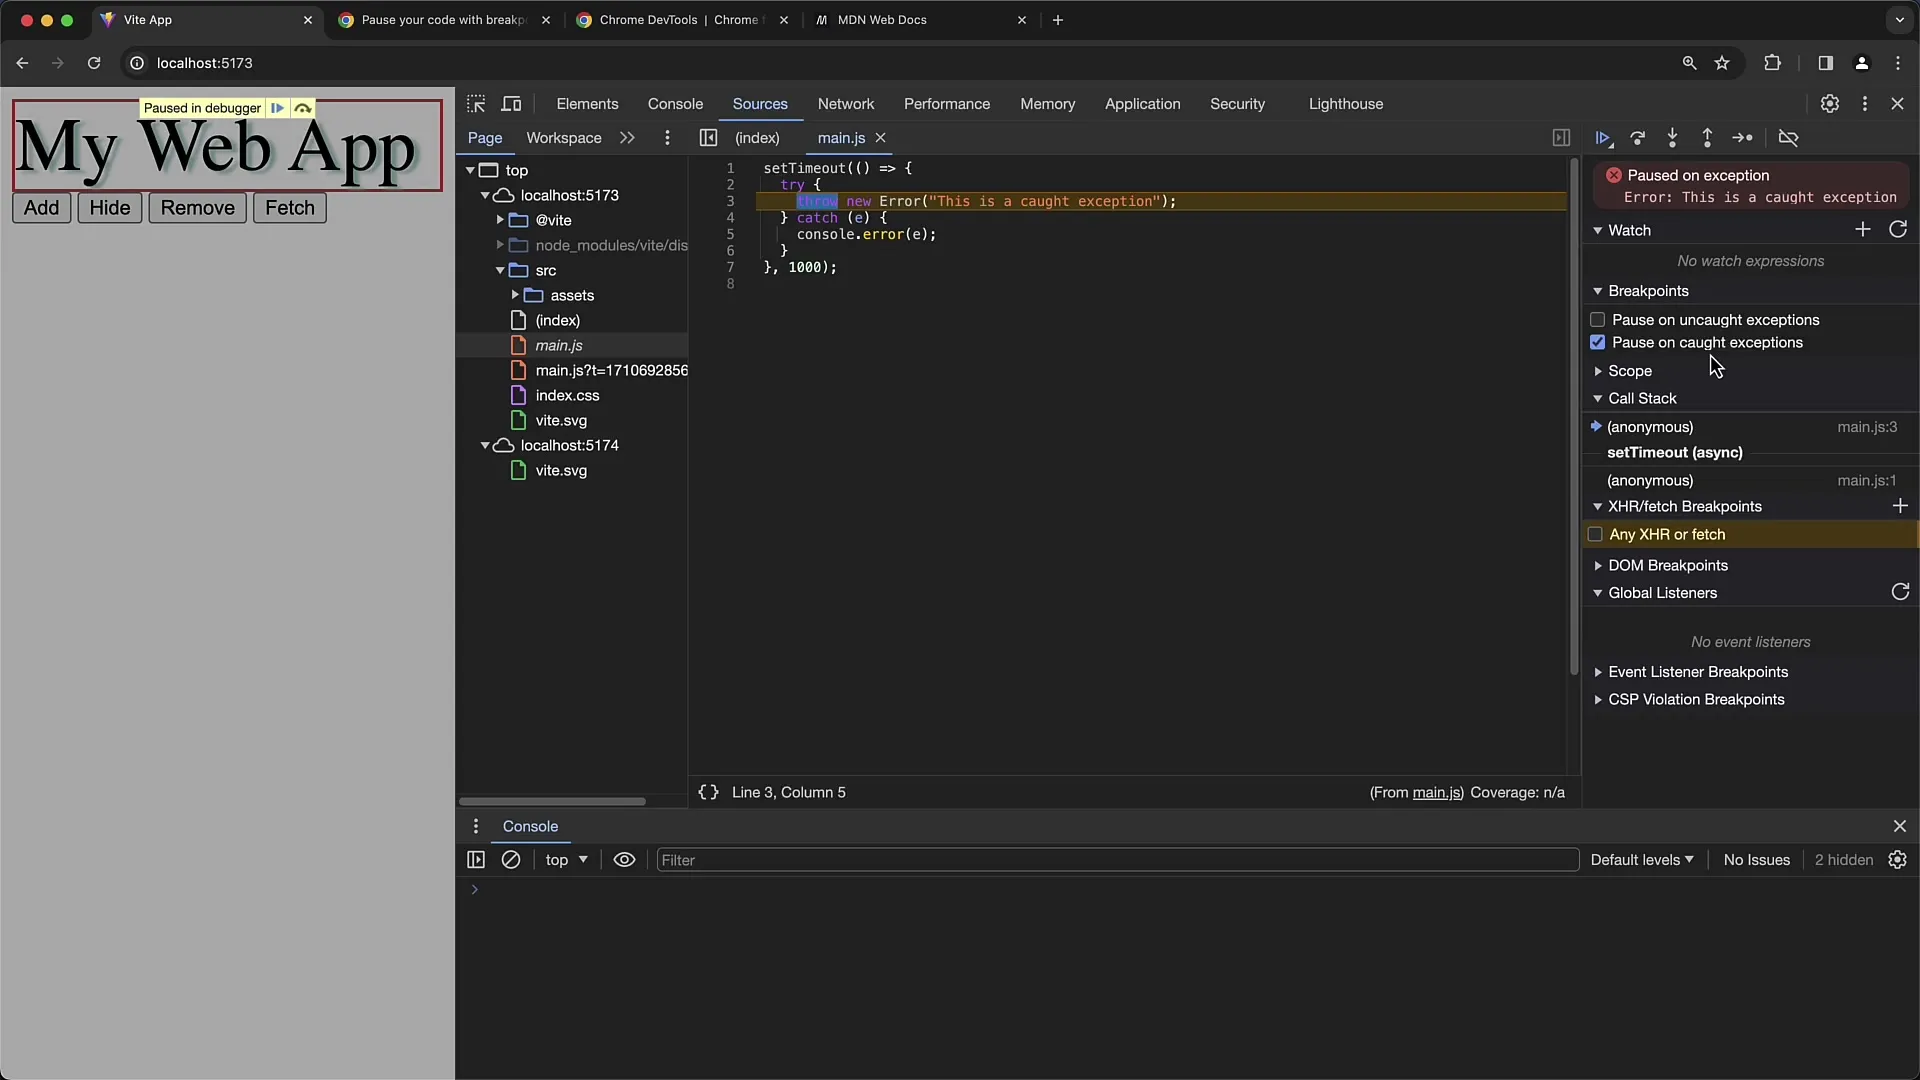
Here you can see that the exception was caught, and you can view the console output with the error contained in the exception.
3. Applying to Multiple Breakpoints
If you have multiple breakpoints in different files, it can quickly become confusing. However, you can easily disable all breakpoints by right-clicking on a breakpoint and selecting "Disable all Breakpoints."
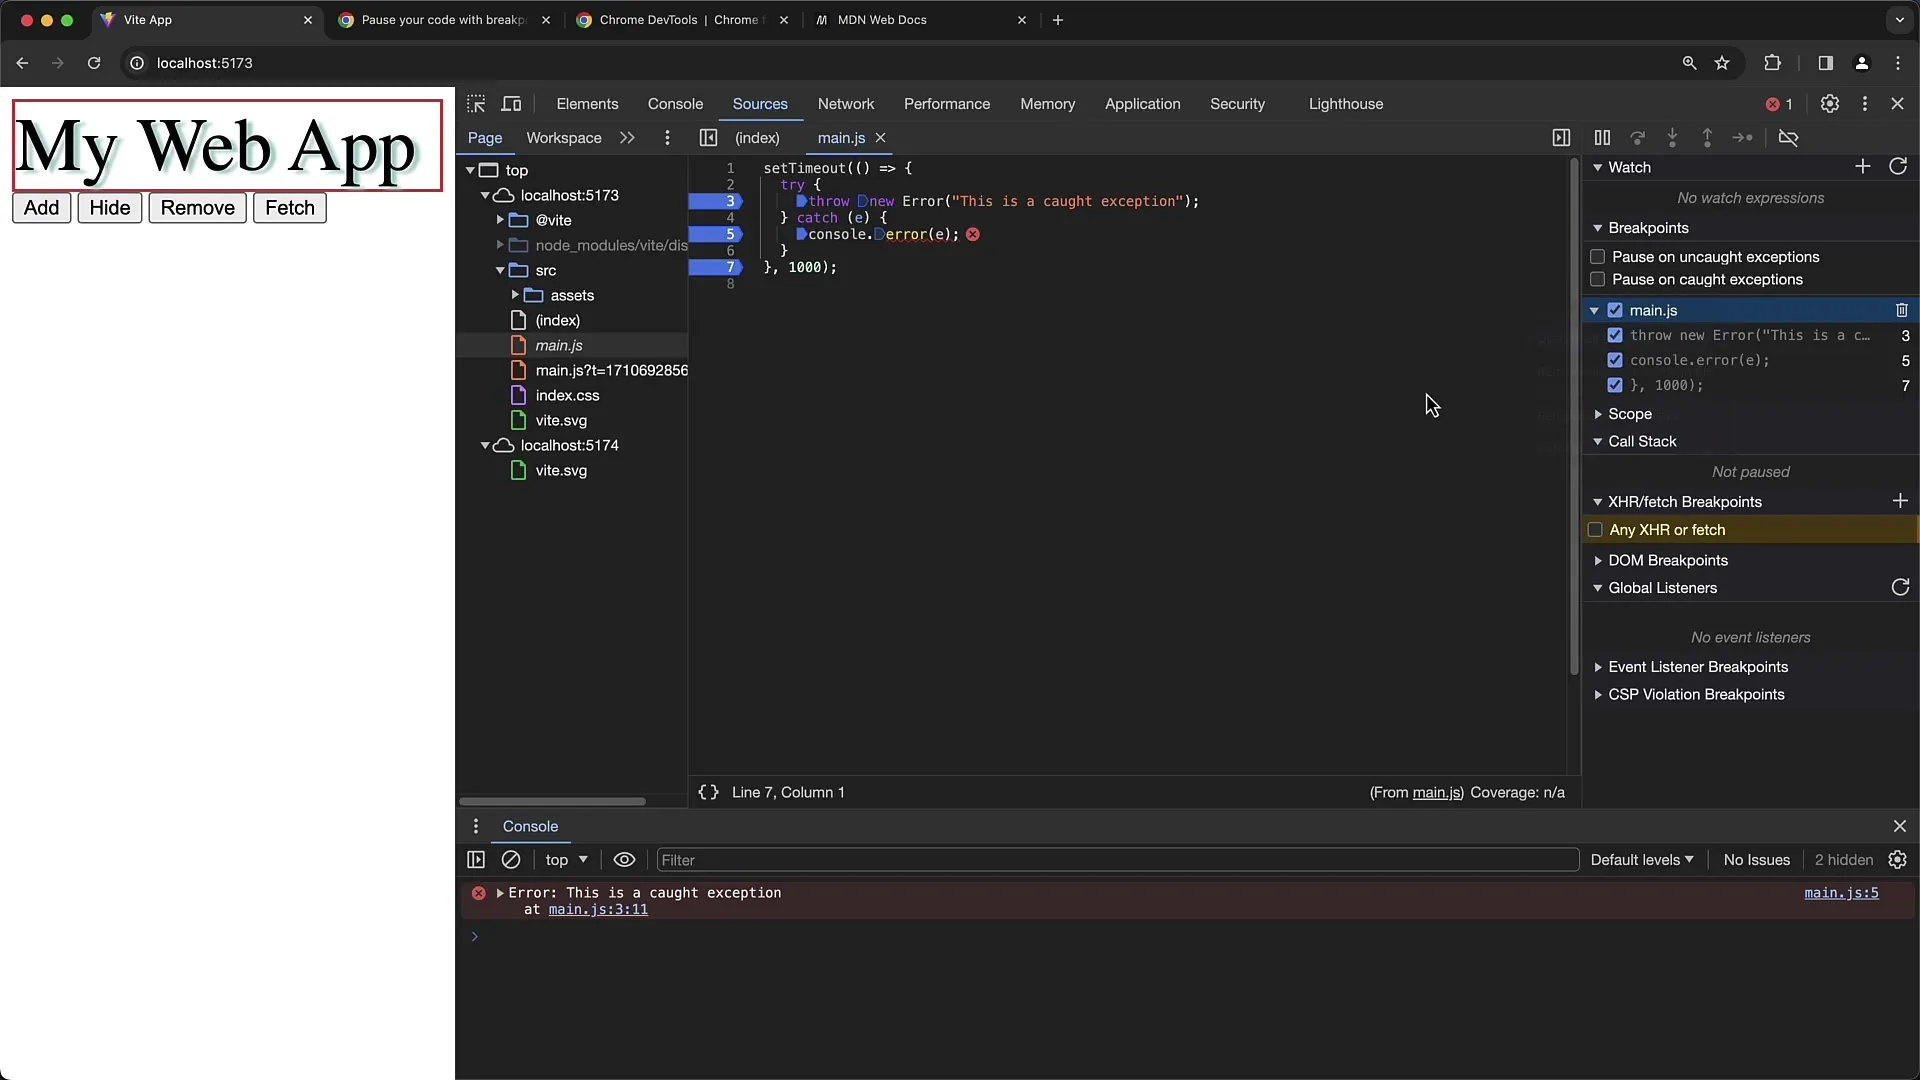
This will disable all breakpoints, and you can re-enable them later if necessary.
4. Using the debugger; Statement
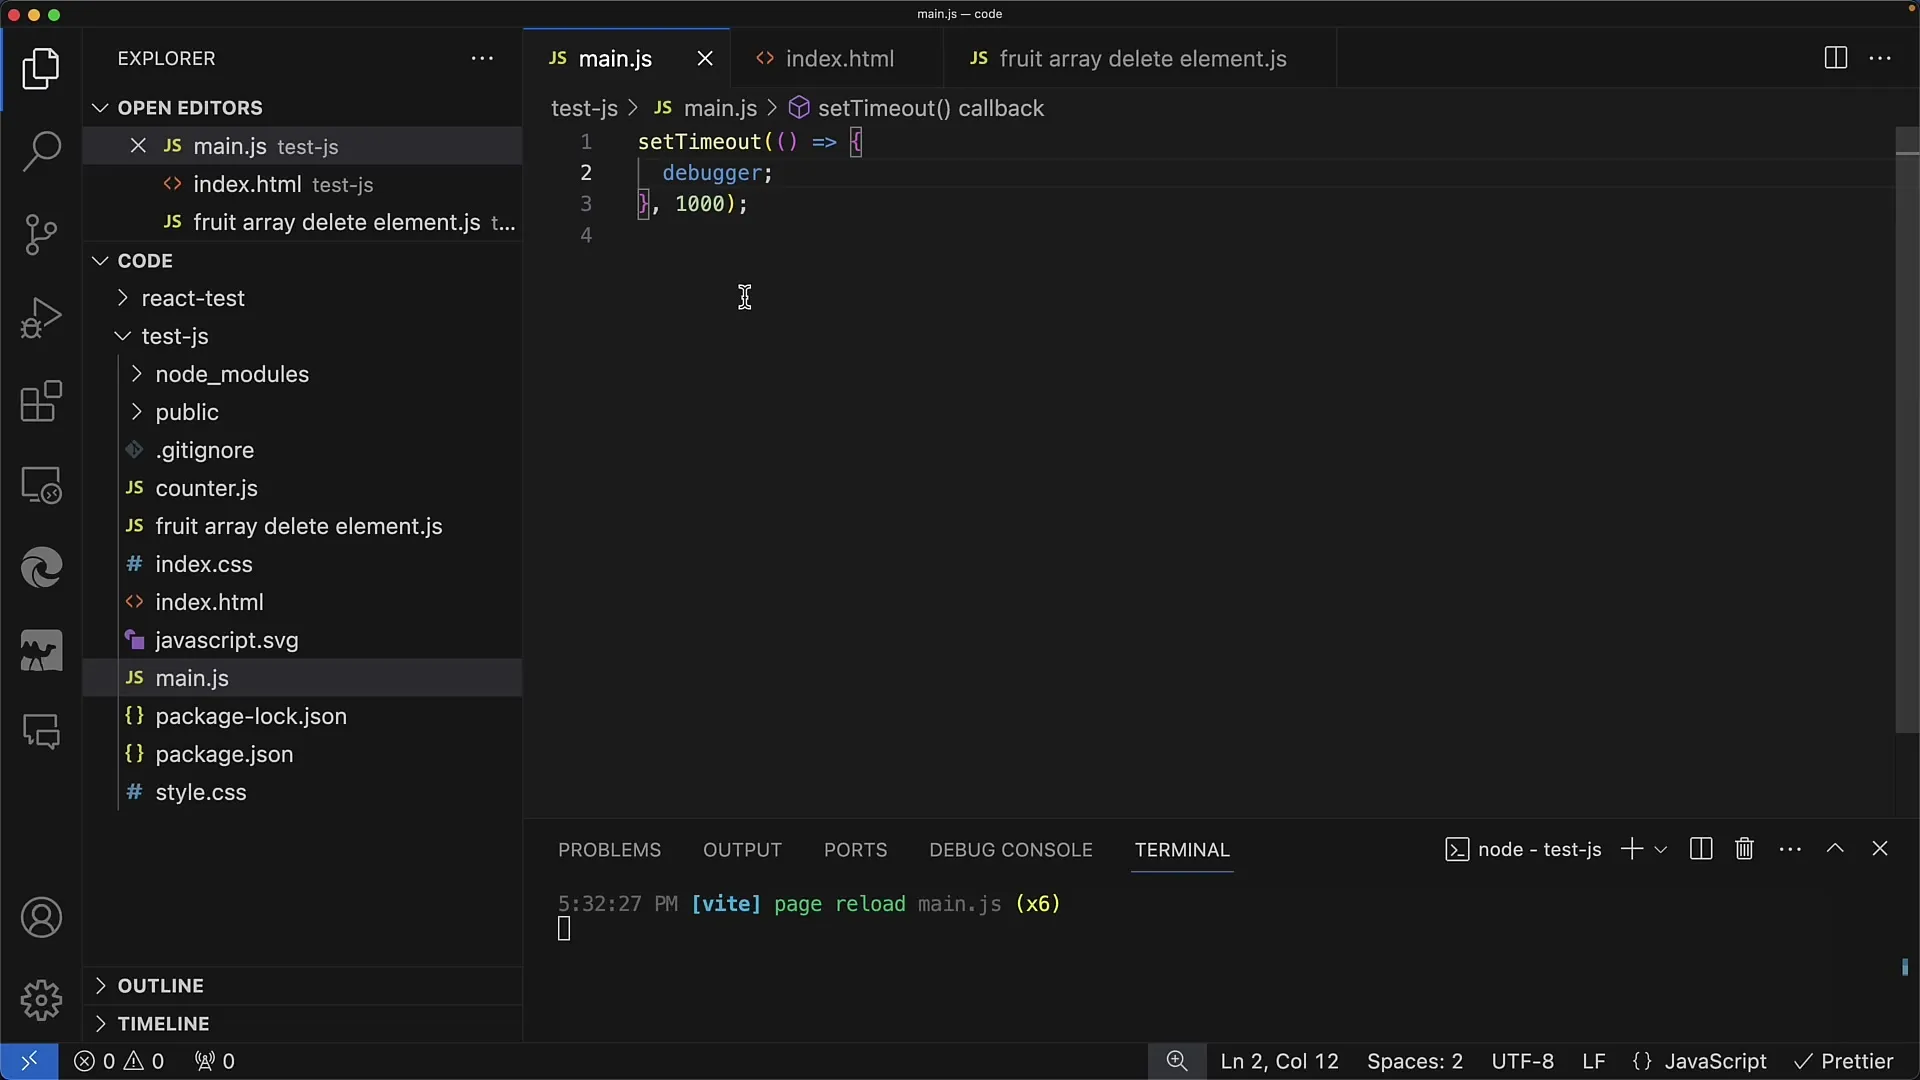
Another useful debugging technique is to insert the debugger; statement in your code. This will pause the program at that point as soon as you reload the page.
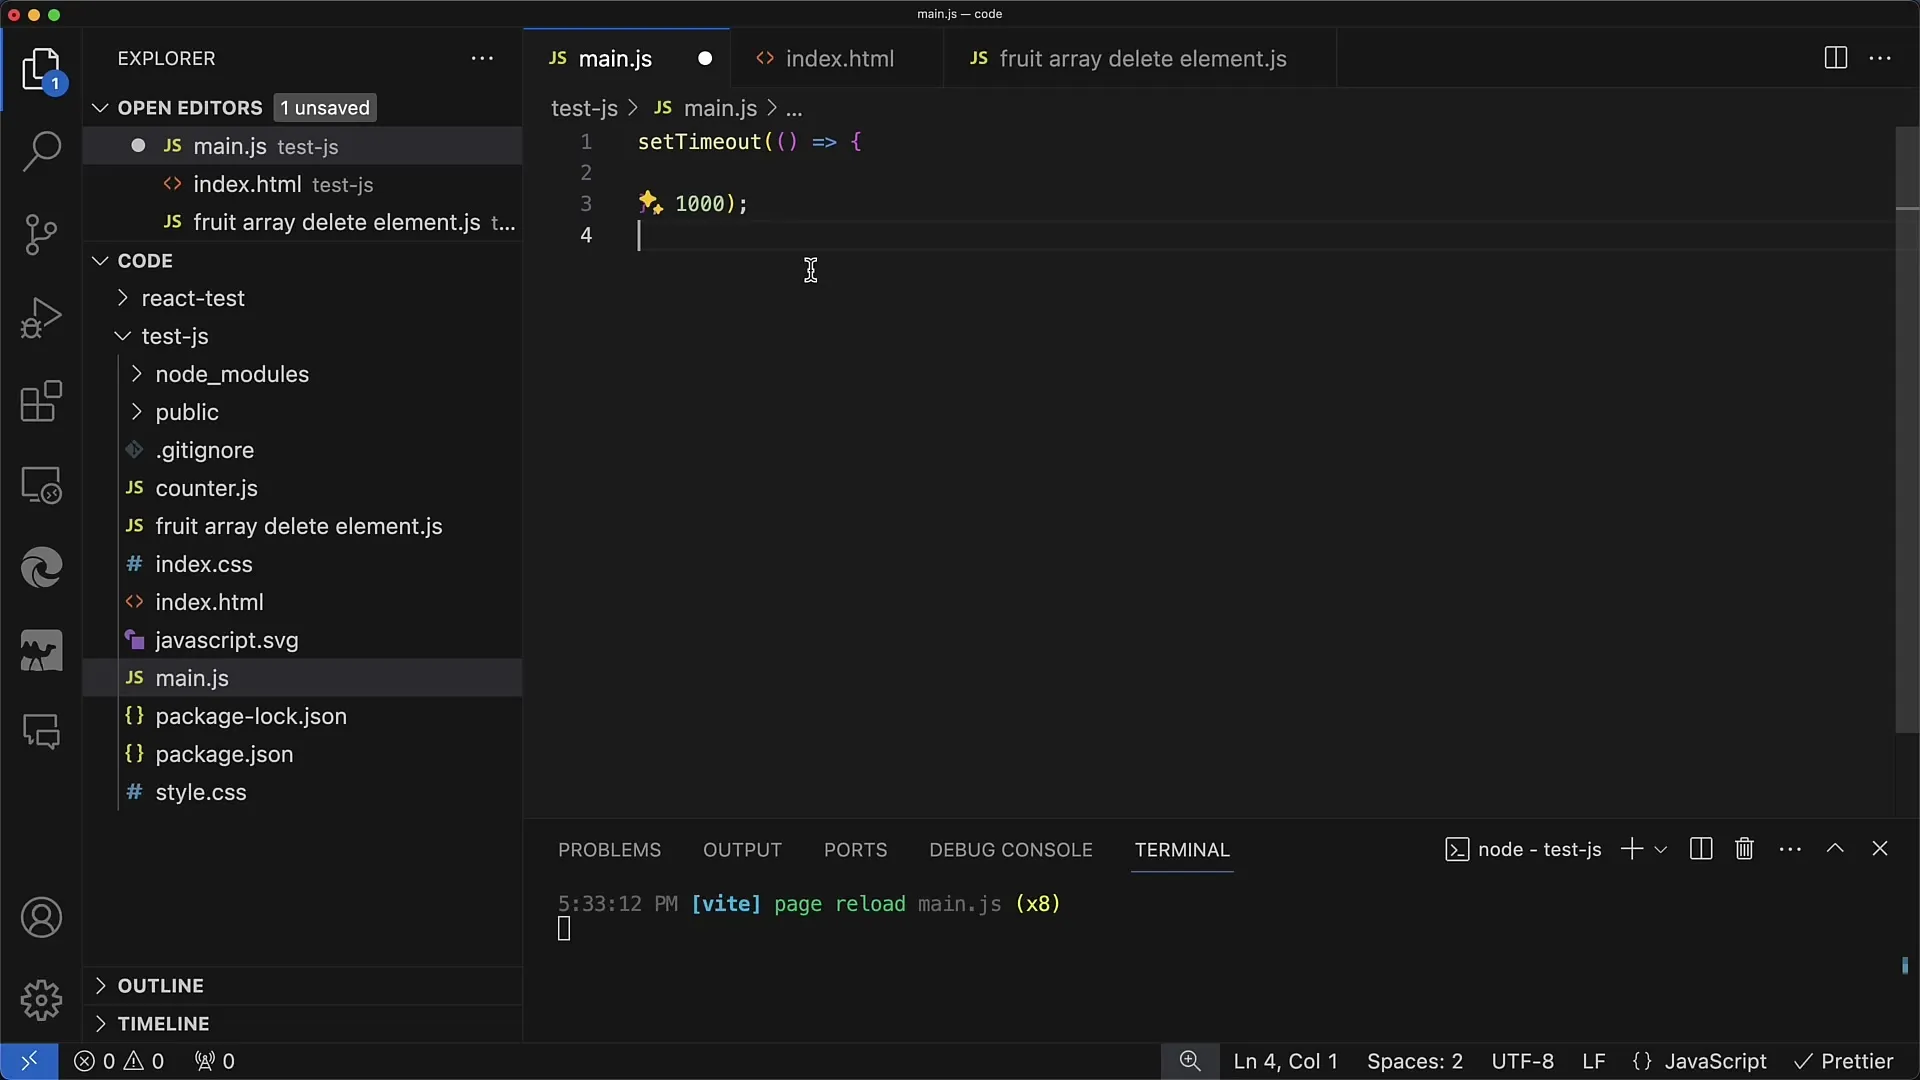
When using the debugger; statement, remember to remove it from your code before going into the production environment as it is not helpful in the live application.
5. Precautions When Working with Exceptions
When working with exceptions, you should be careful, especially when using many third-party libraries. These can also trigger exceptions, and it can be disruptive if your code constantly pauses.
If you know that your application generates exceptions, it can be useful to enable the option for "Uncaught Exceptions" to recognize them during the debugging process.
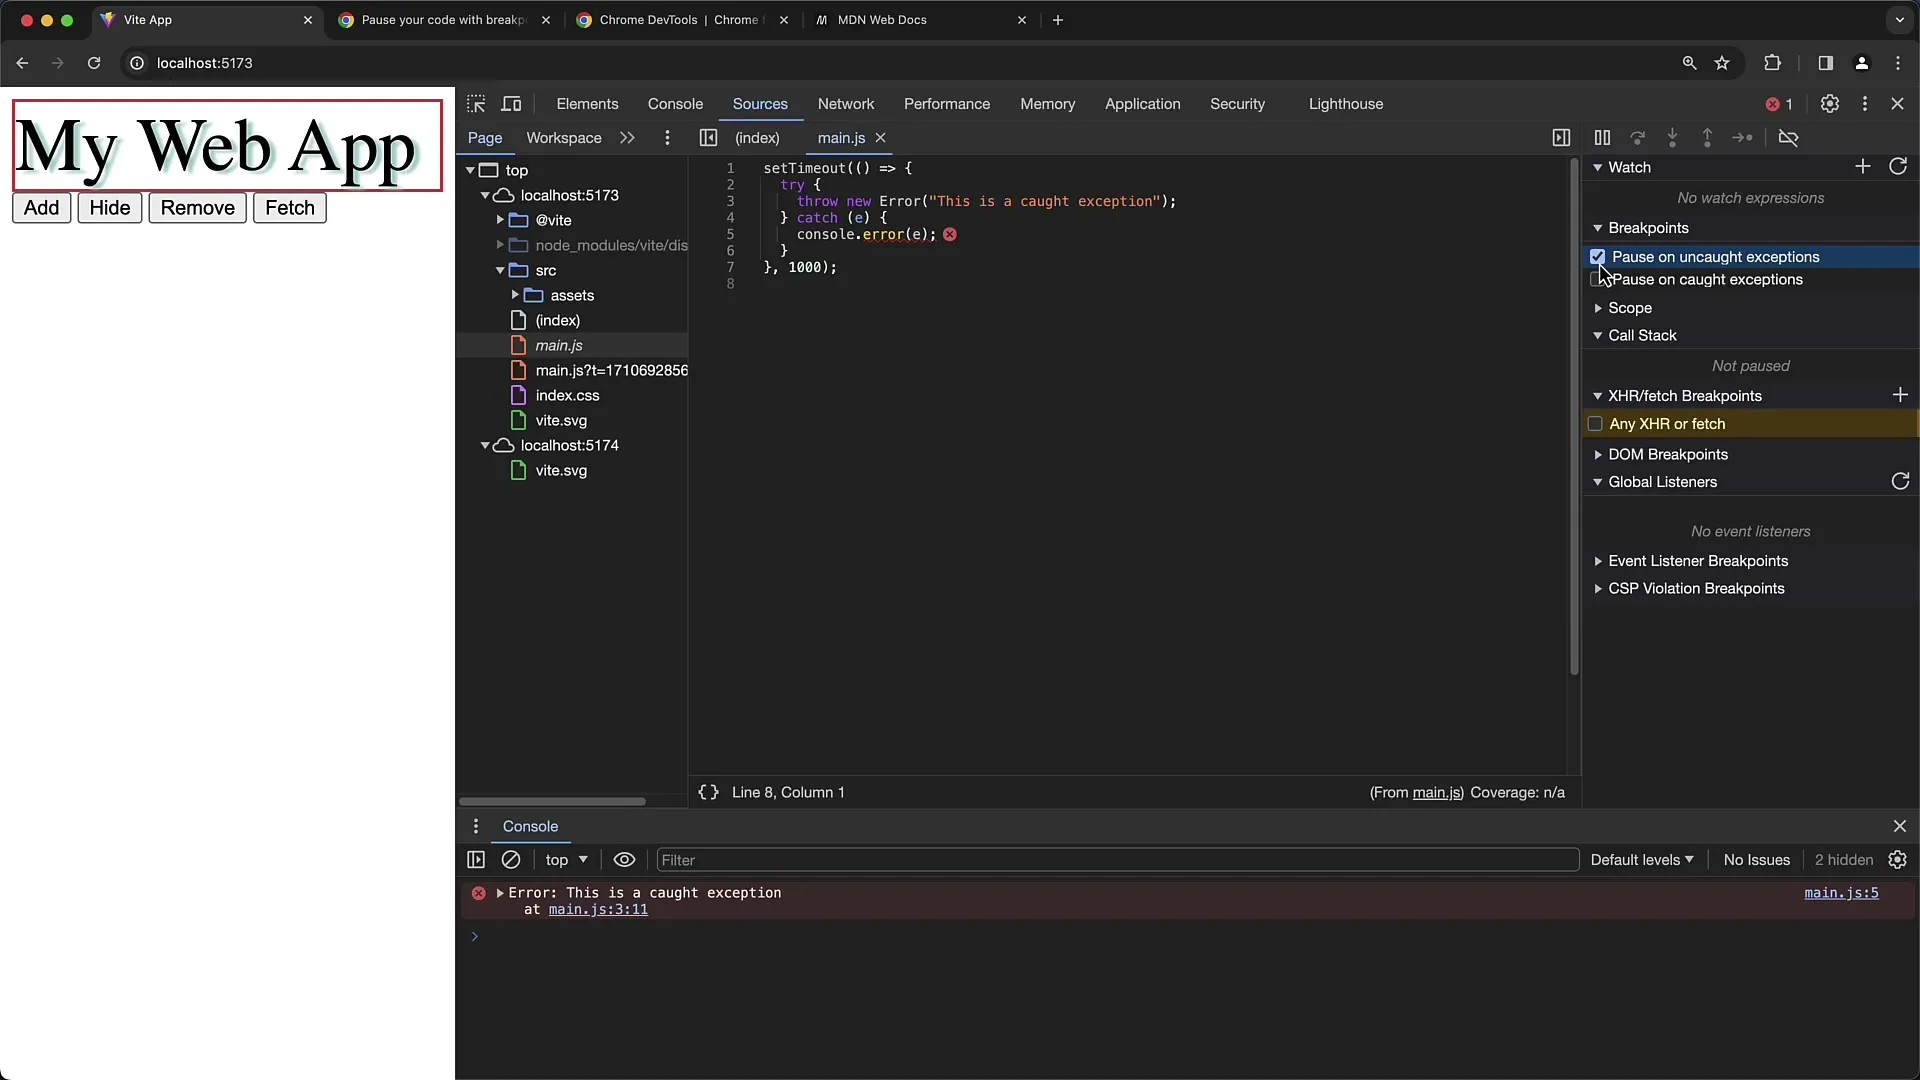
Keep in mind that not every exception leads to a problem. An exception may simply be caught and not negatively impact the user experience.
Summary
In this guide, you have learned how to use exception breakpoints in Chrome Developer Tools to find errors in your JavaScript code. You have seen how to enable and effectively use these breakpoints to ensure that your applications function smoothly. Understanding and implementing these techniques will greatly enhance your debugging efficiency.
