In this guide, I'll show you how to effectively use aggregation functions in Google Sheets. Aggregation functions help you perform basic statistical calculations such as averages, sums, maximum and minimum values, as well as ranges. These functions are particularly useful when working with datasets that are intended to provide an overview of your data. Let's explore the different functions together and learn how to apply them.
Main Insights
- The main aggregation functions in Google Sheets include SUM, MIN, MAX, AVERAGE, and COUNT.
- These functions require you to work with numerical data to provide correct results.
- You can easily drag the functions to the right to apply them to multiple data rows.
Step-by-Step Guide
Let's start with the basics of aggregation functions.
Step 1: Applying SUM Function
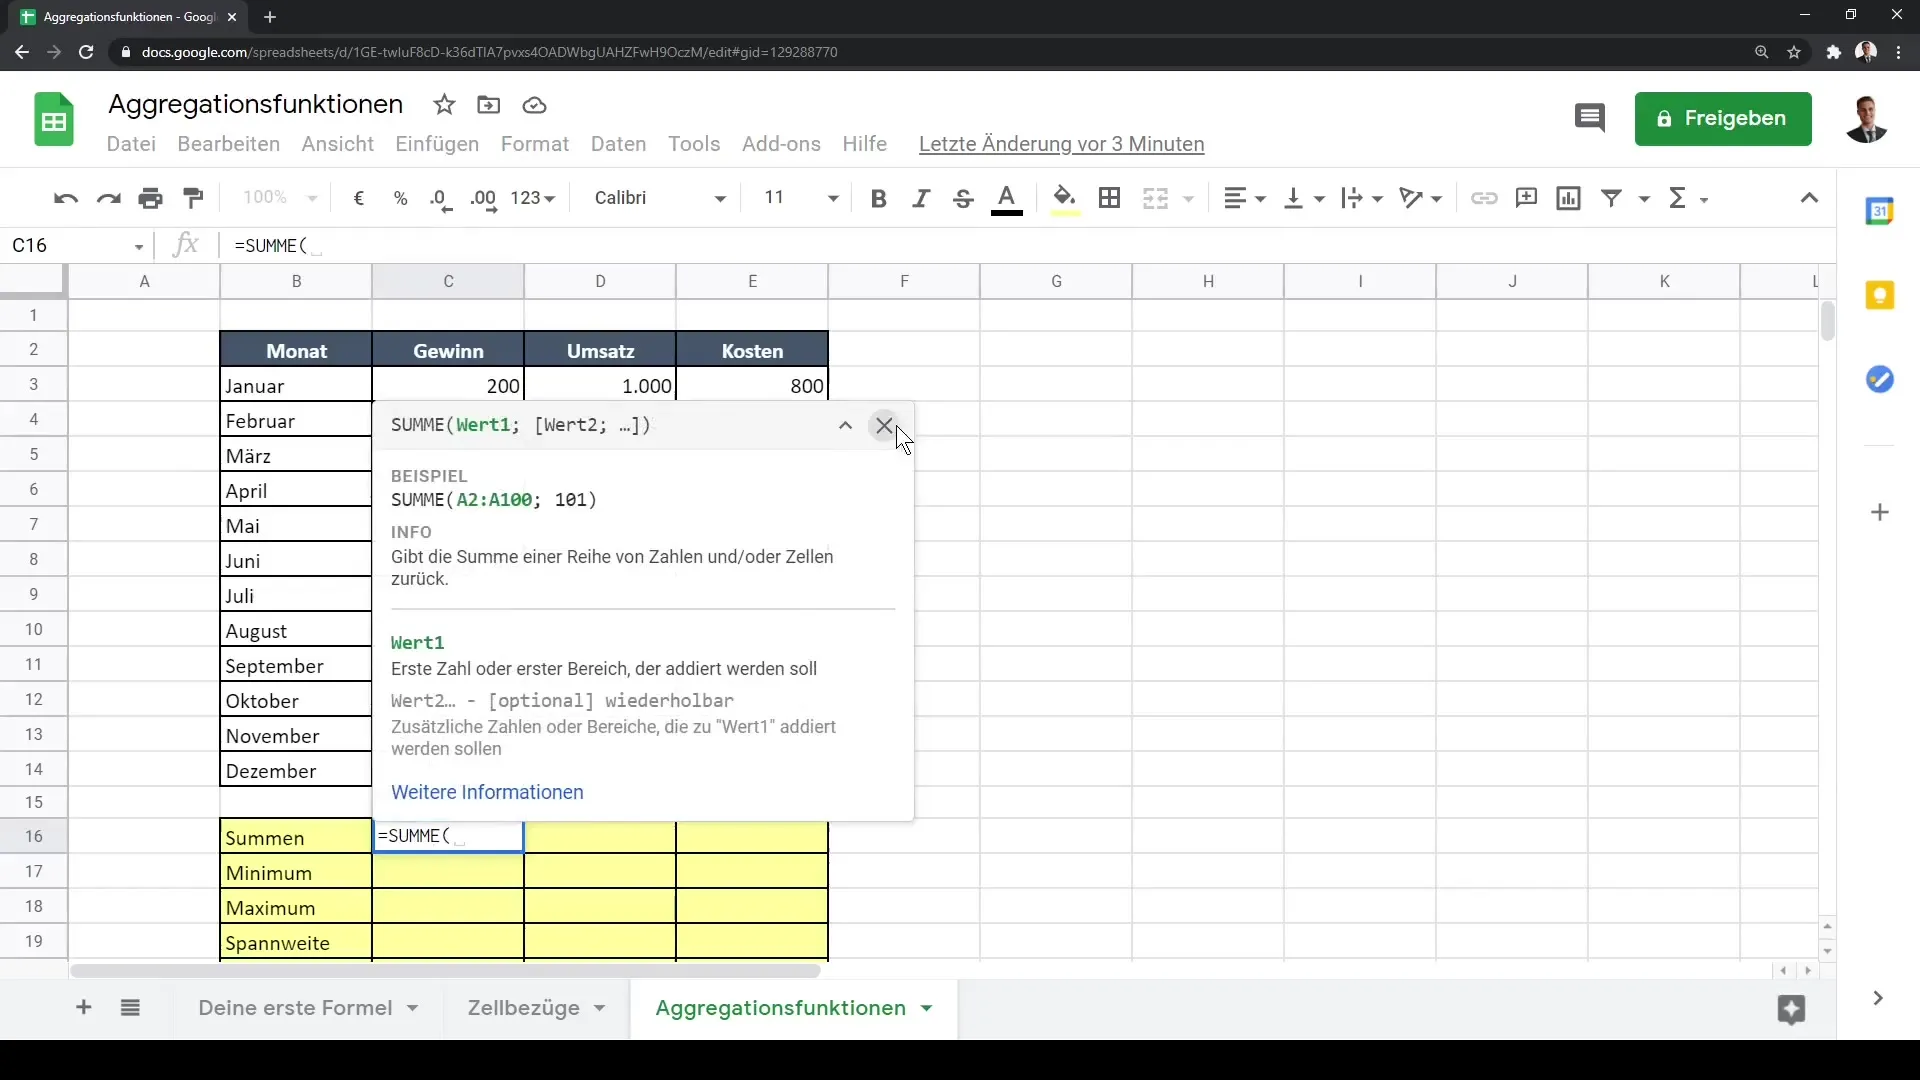
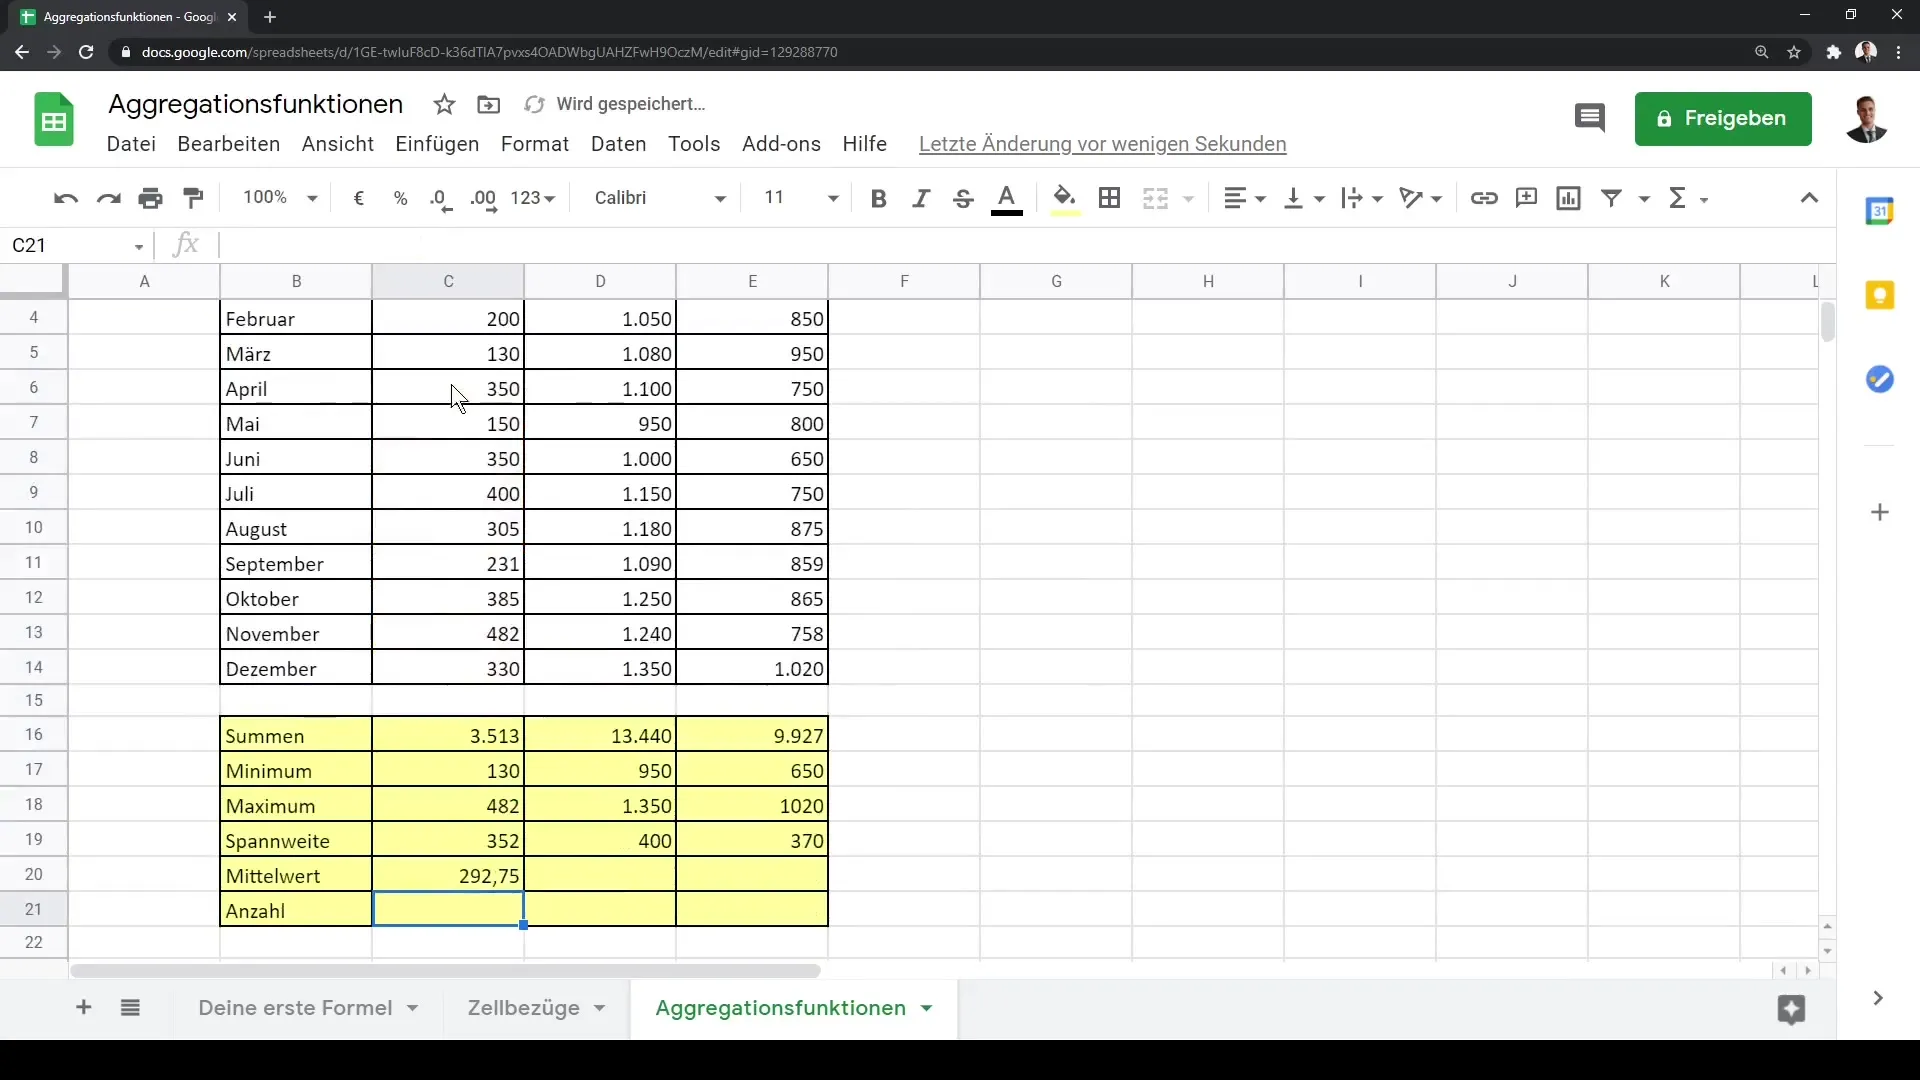
First, let's look at the SUM function. This function allows you to calculate the total revenues and costs of your business over a specific period. Select the range of your data, in this case, the cells from C3 to C14. Then use the formula =SUM() and drag the formula to the right to get the sum for the next data rows.
Step 2: Using MIN Function
Next, let's focus on the MIN function. With this function, you can determine the minimum value of your data group - for example, the month with the lowest profit. Once again, select the corresponding range and use the formula =MIN(). You can also drag the formula to the right to calculate the minimum values for additional data rows.
Step 3: MAX Function
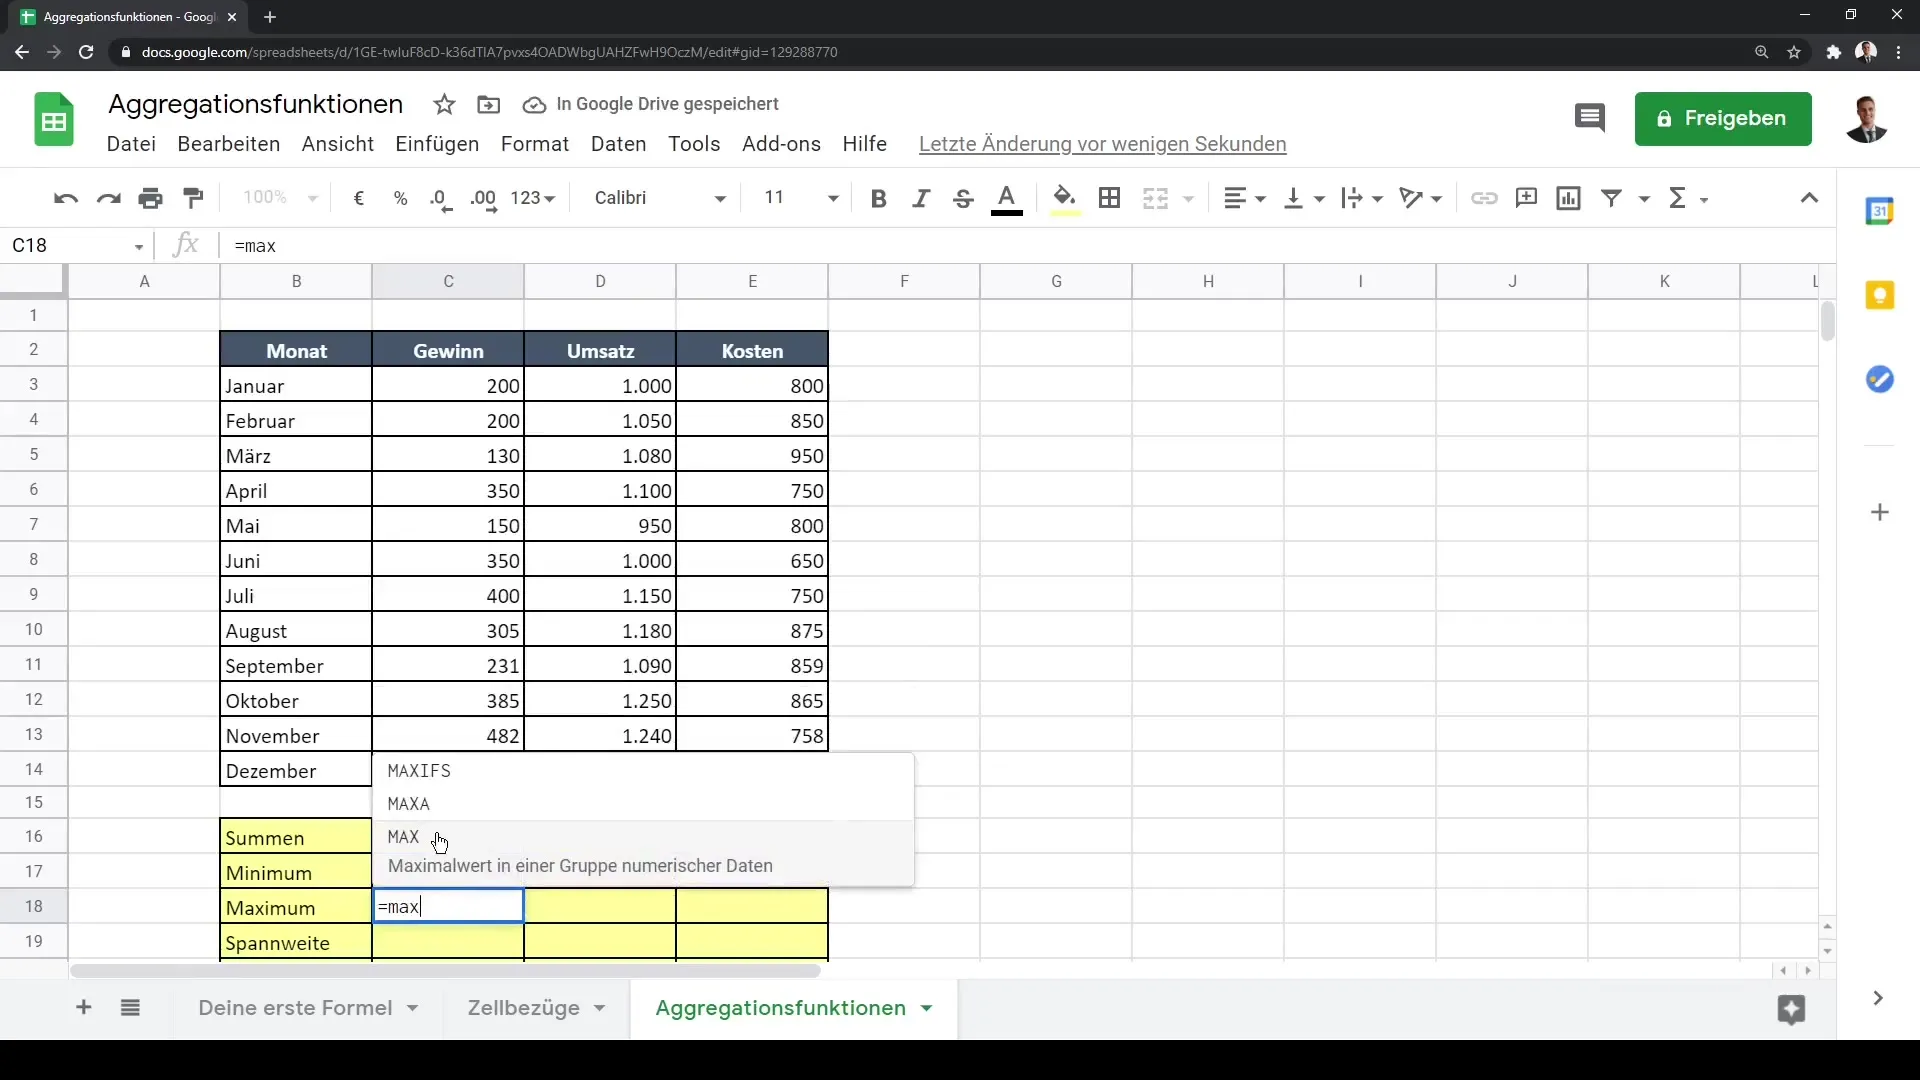
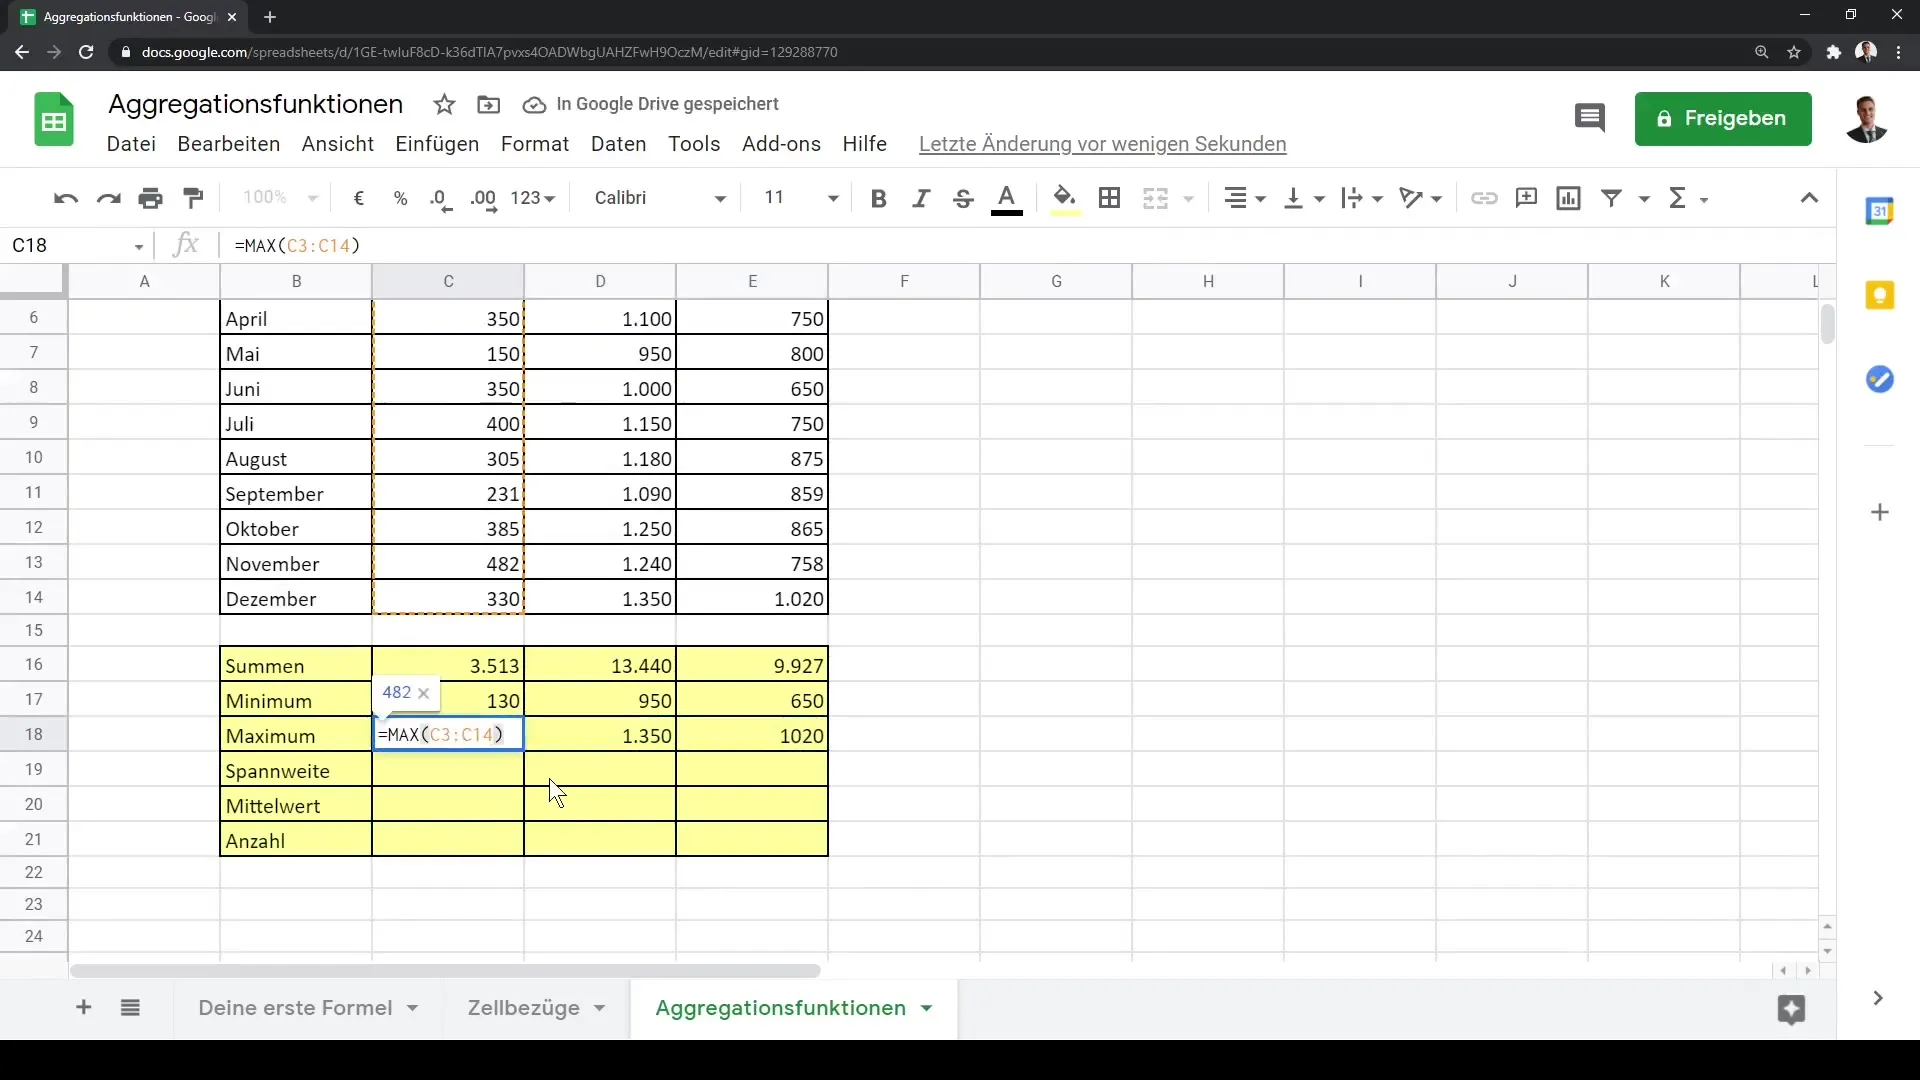
Similar to the MIN function, we now consider the MAX function. With this function, you determine the maximum value - e.g. the month with the highest revenue or profit. Use the formula =MAX() and select the necessary range. Also, drag the formula to the right.
Step 4: Understanding Data Types
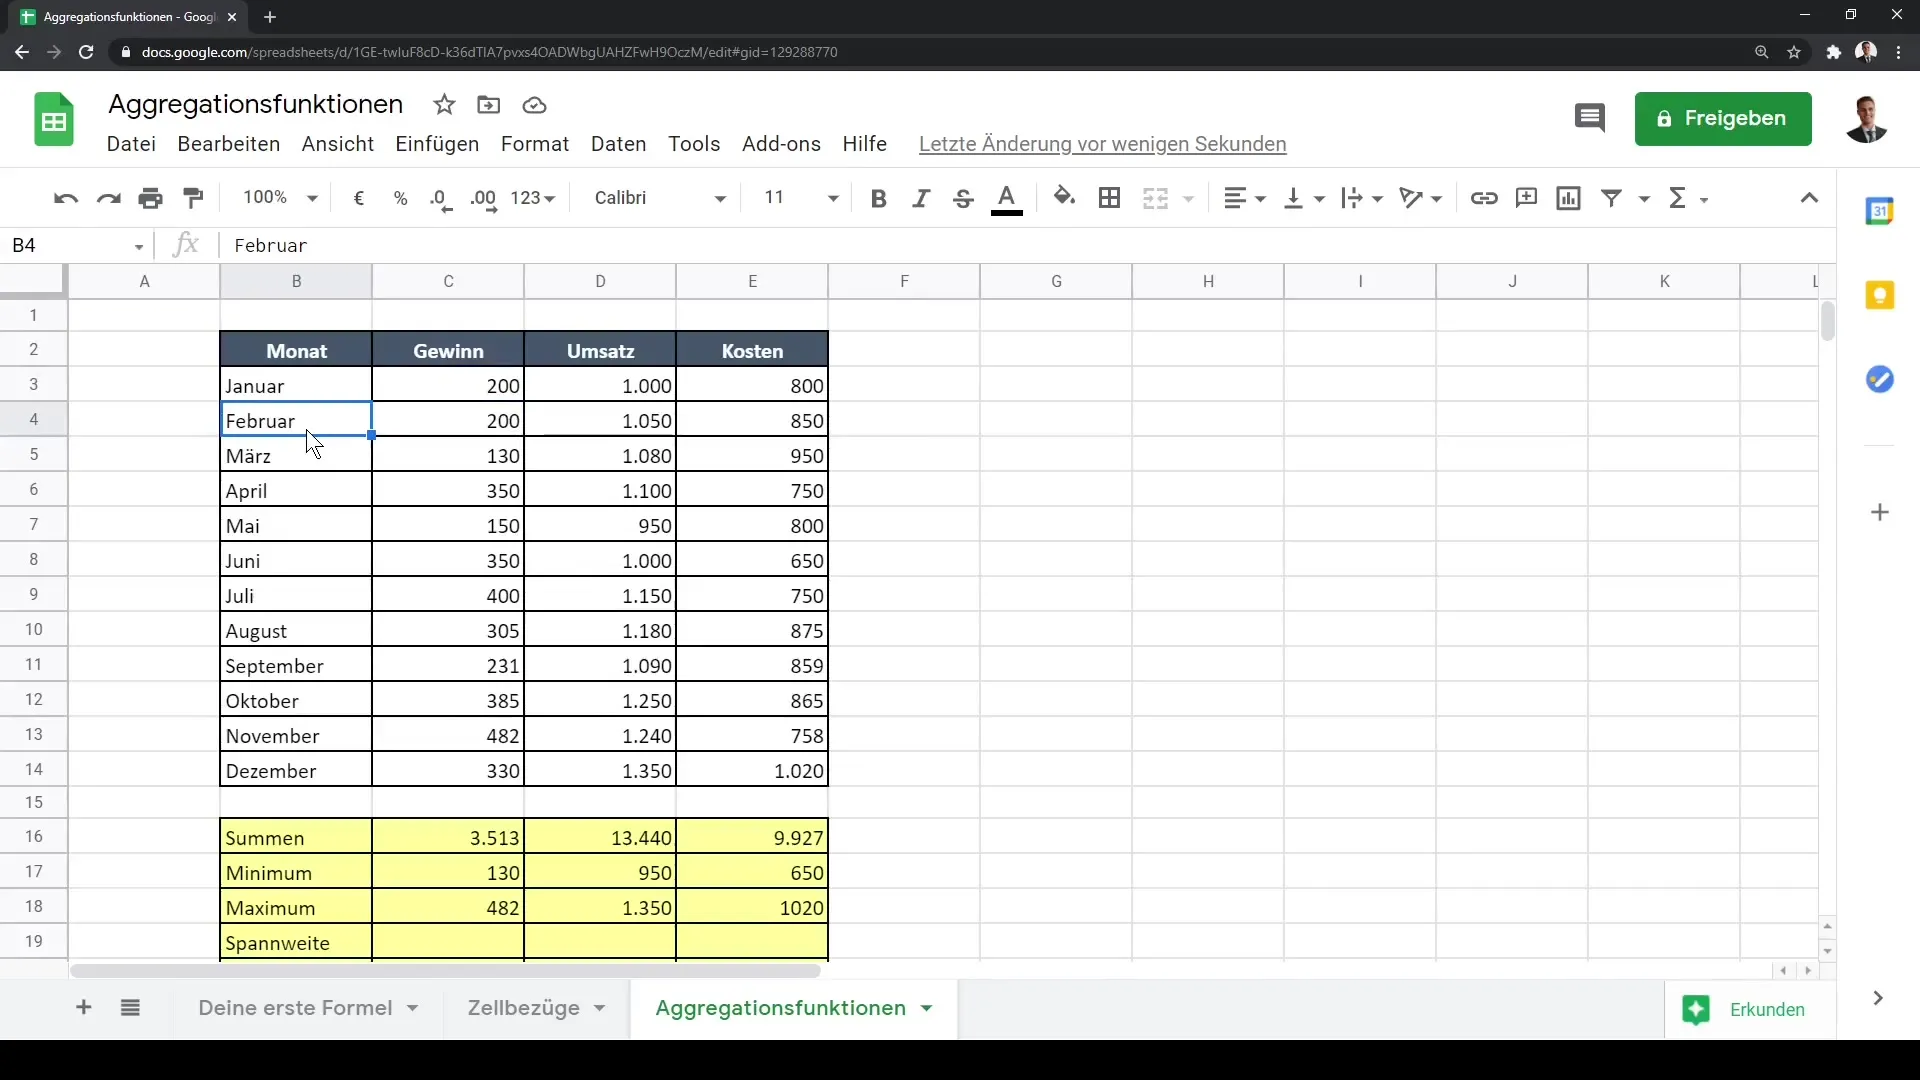
Understanding data types in Google Sheets is important. Aggregation functions only work with numerical data. If you try to apply the MIN or MAX function to text data, you will receive an error message. Therefore, make sure you are working with numbers.
Step 5: Calculating Range
The range is the difference between the highest and lowest values in your data series. You can calculate the range by combining =MAX() - MIN(). This gives you the range between the highest and lowest points. If your maximum is 482 and your minimum is 130, the range is 352.
Step 6: Calculating Average
Now, onto one of the most important functions: the average. This function calculates the average of your values. Once again, select the range and use the formula =AVERAGE(). This provides you with valuable insights into your average revenues and profits.
Step 7: Determining the Number of Values
Finally, let's find out the number of entries in our dataset. You can use the formula =COUNTA() for this. This will give you the number of dated observations in your selected range.
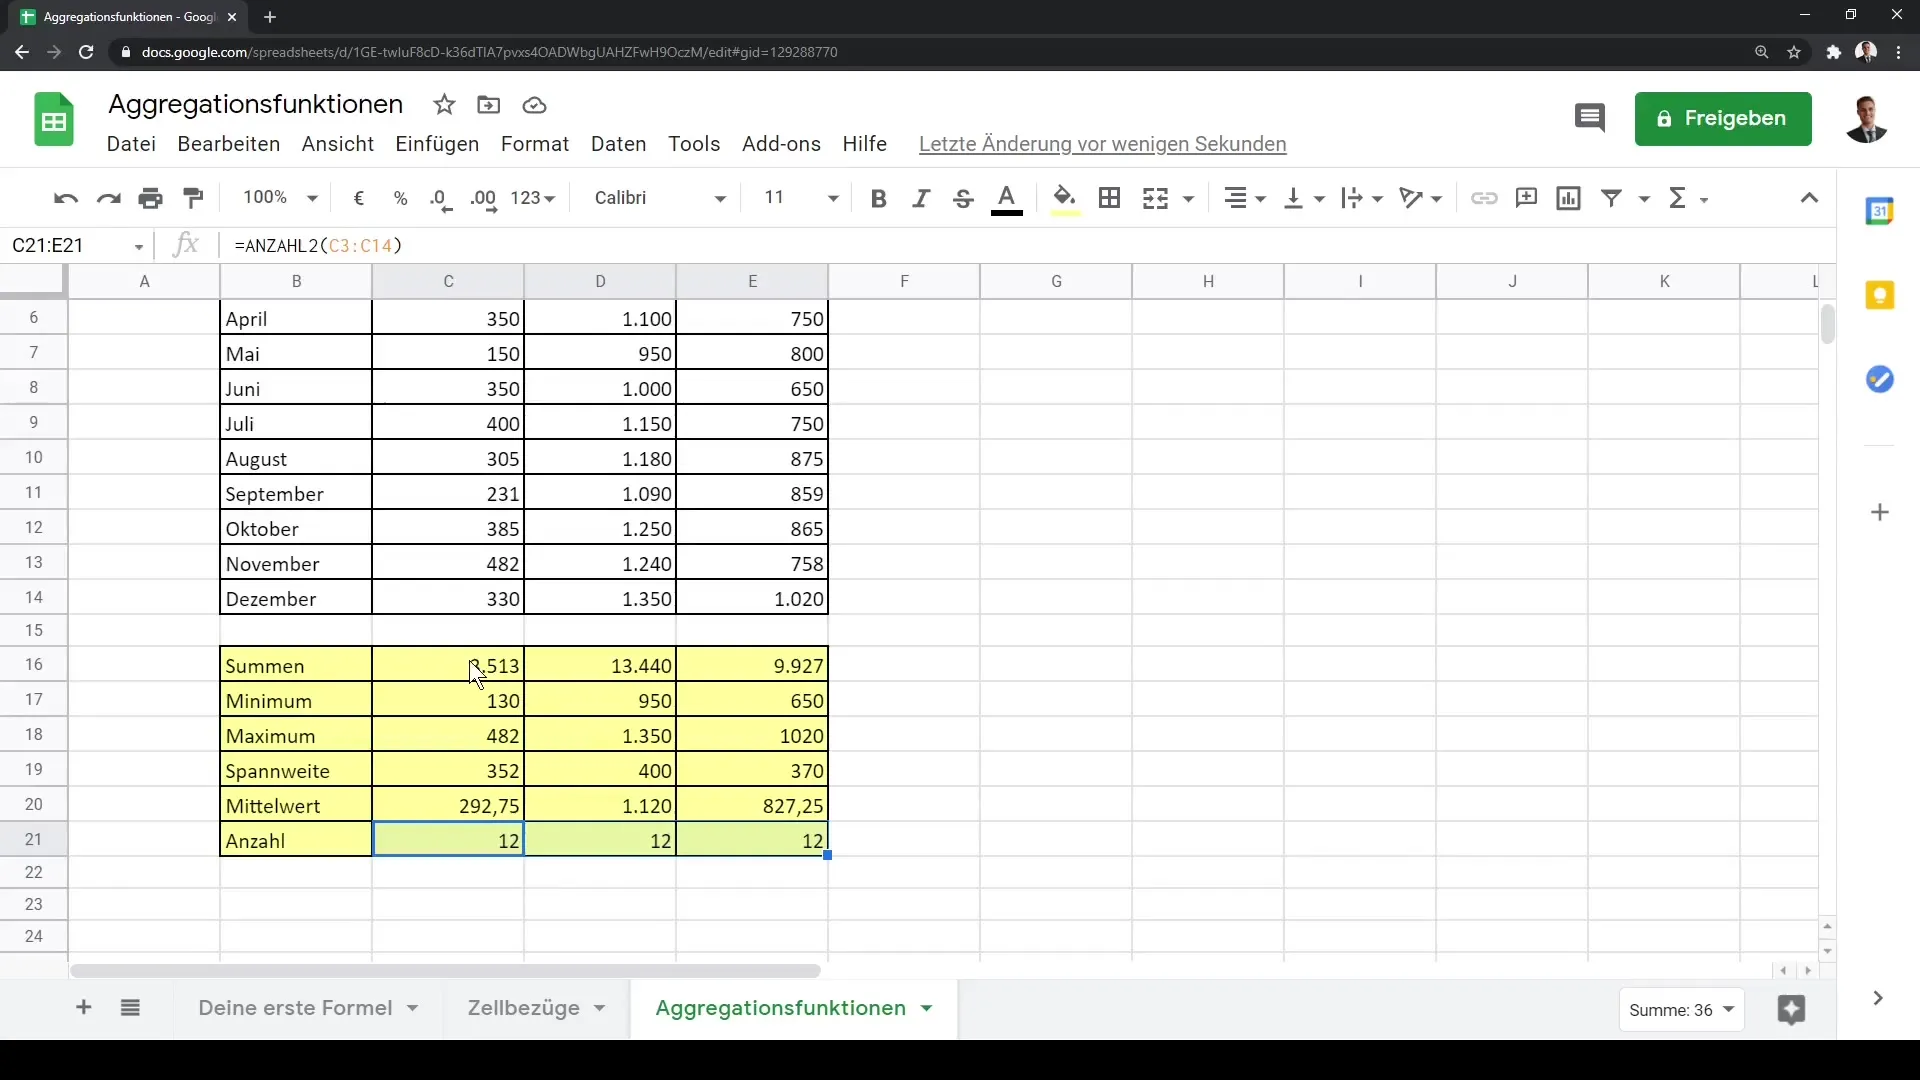
Having learned the basic aggregation functions, you are now well-prepared to perform data analyses in Google Sheets!
Summary
In this guide, you've learned how to use basic aggregation functions in Google Sheets. We covered the functions SUM, MIN, MAX, Range, AVERAGE, and COUNT. With these tools, you can conduct effective data analysis and gain valuable insights from your numbers.
Frequently Asked Questions
What are aggregation functions?Aggregation functions are mathematical functions used to summarize data, such as sum, average, and extreme values.
How do I use the SUM function in Google Sheets?You select the data range and use the formula =SUM(), possibly followed by the cells to be summed.
What should I do if I receive an error message when using an aggregation function?Ensure that you only use numerical data in your calculation. Text data will lead to error messages.
How do I calculate the range?You can calculate the range by using =MAX() - MIN() in Google Sheets.
Are these functions only applicable to financial data?No, aggregation functions can be applied to any type of numerical data, regardless of the subject.
