In this tutorial, you will learn everything important about the optimal data foundation for creating your first Pivot Analysis in Google Sheets. Pivot tables are a fantastic tool for analyzing and evaluating large amounts of data. However, before you can start creating one, it is crucial that your data is in the right structure. Let's work together to outline the main points so that you can avoid errors and smoothly conduct your analyses.
Key Insights
- The data foundation must be clearly structured to achieve accurate results.
- Unique column headings are essential.
- Avoid empty rows and subtotals in your raw data.
- A clear preparation of the data is the key to successful Pivot Tables.
Step-by-Step Guide
1. Understanding the Data Structure
Before uploading or editing your data in Google Sheets, it is important to familiarize yourself with the structure of your data. You should ensure that your data table has a clear arrangement. Each column should represent a specific attribute – for example, calendar week, revenue, or sales team.
2. Defining Unique Column Headings
The first row of your table must contain the headings for each column. These headings should be unique and descriptive. They describe what type of data is in each column. This way, everyone can immediately see what information to expect in the table.

3. Avoiding Subtotals
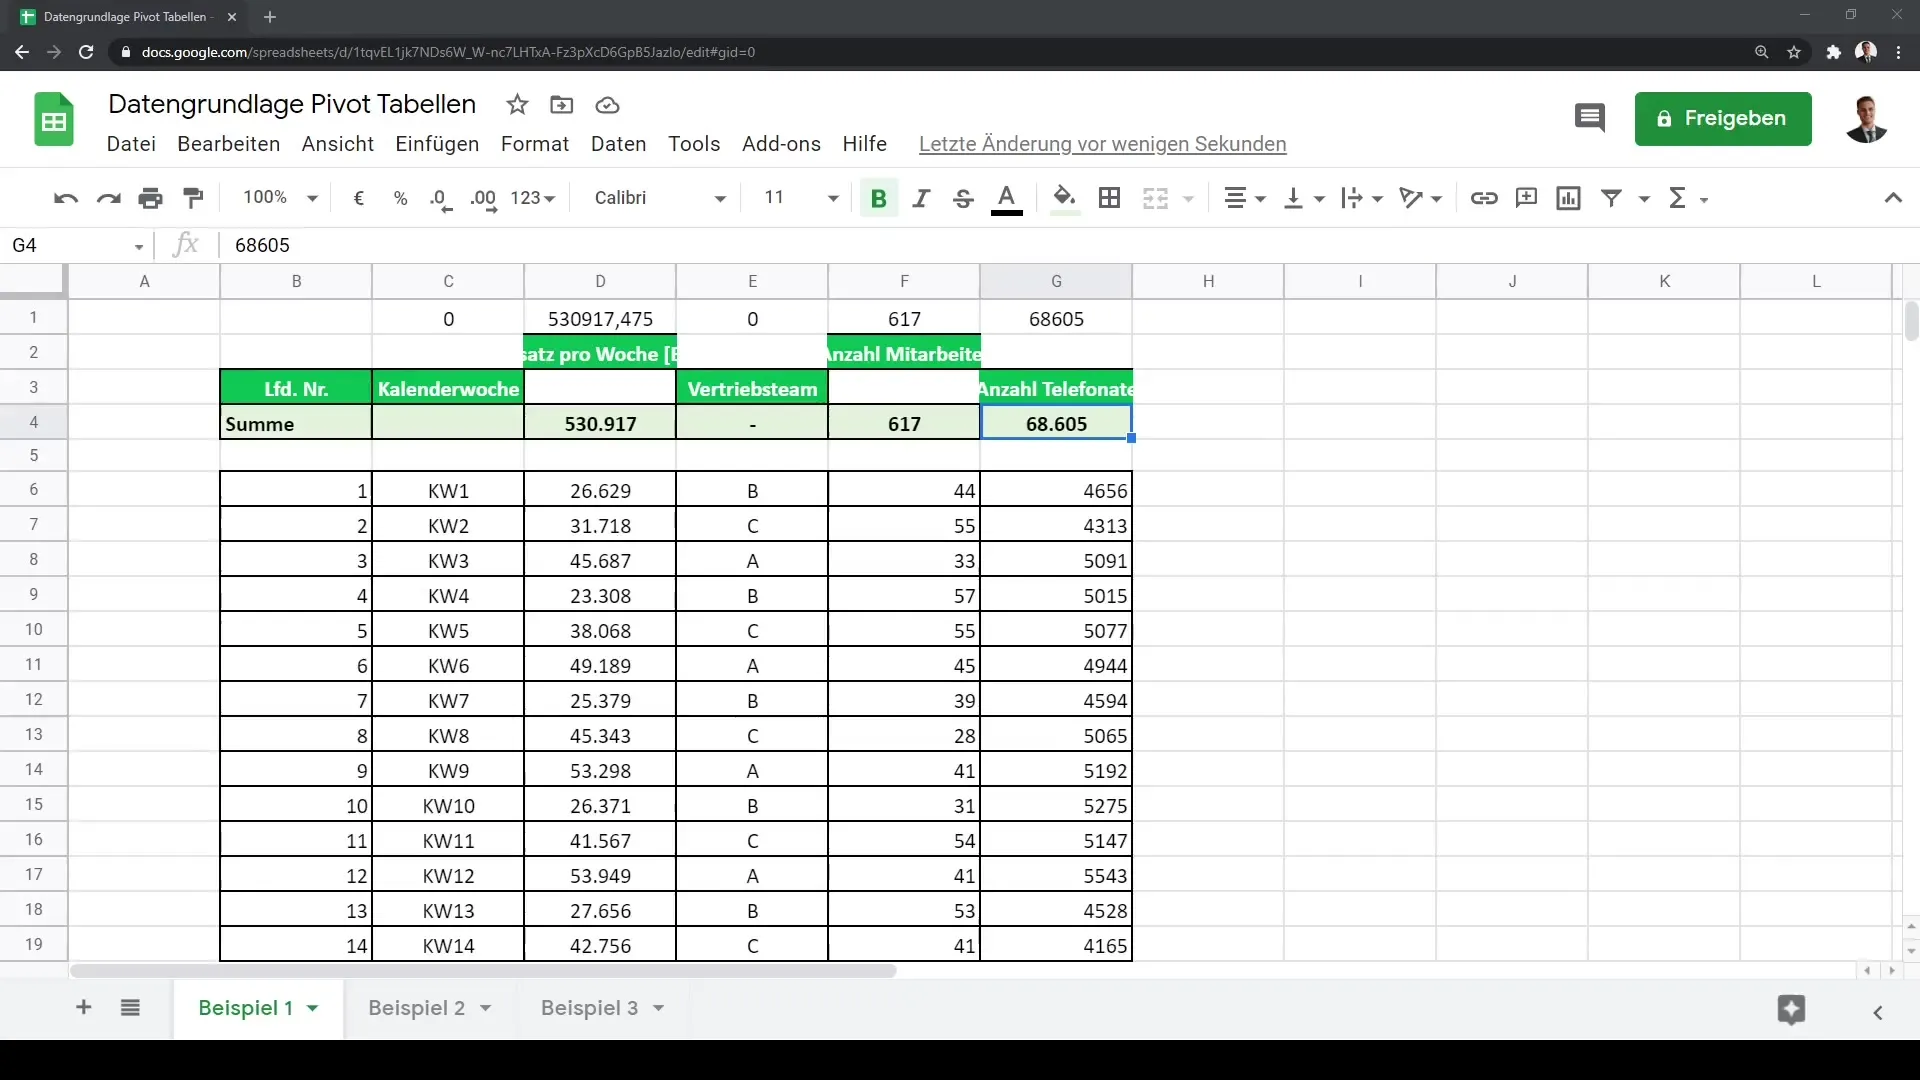
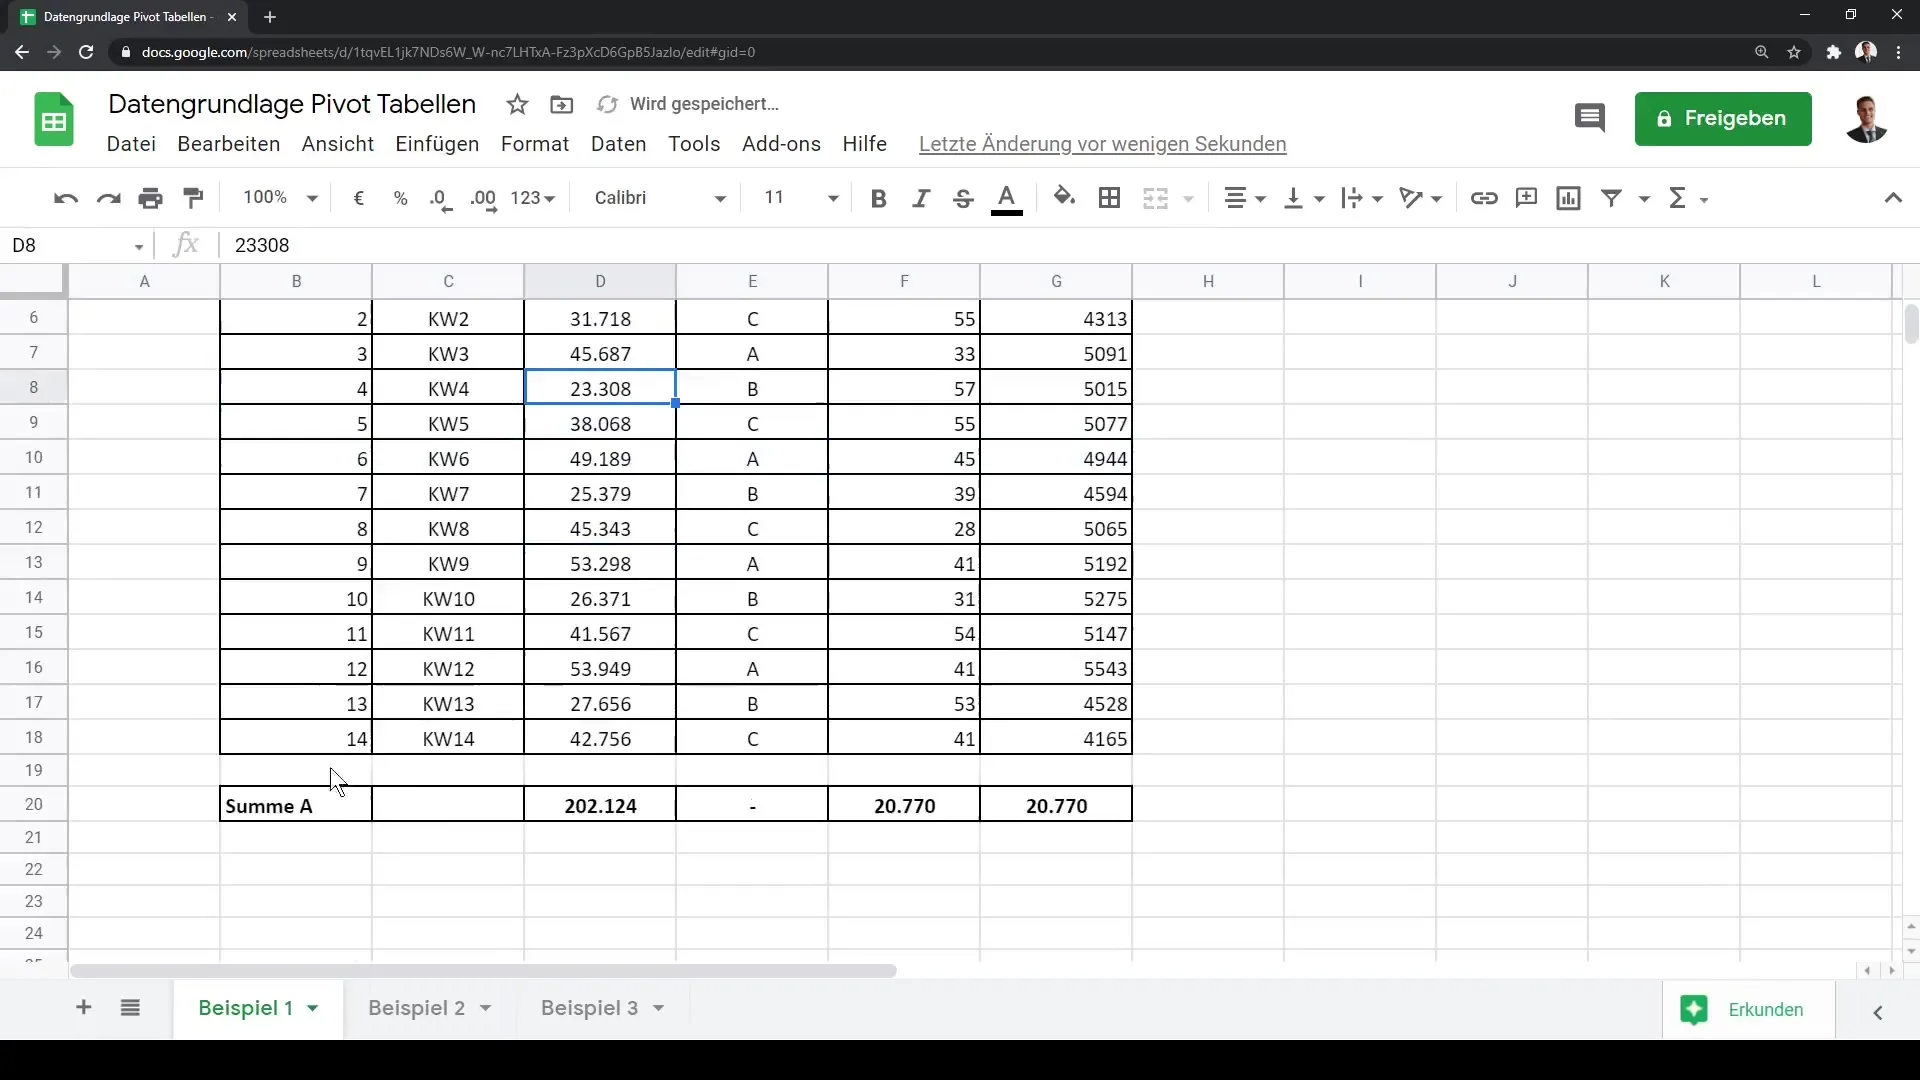
A common mistake when creating Pivot Tables is including subtotals in the raw data. You should ensure that there are no subtotals in the data foundation. If these are present in your data, it can lead to inaccurate results in the analysis. Be sure to remove all subtotals before starting the Pivot Table creation process.
4. Data Cleansing
The data should also have a consistent order, without empty rows or columns. These empty rows can also cause issues when creating your Pivot Tables. An easy way to remove them is by right-clicking on the respective row and selecting the "Delete row" option. Make sure to remove all unnecessary rows.

5. Conceptualizing the Data Structure
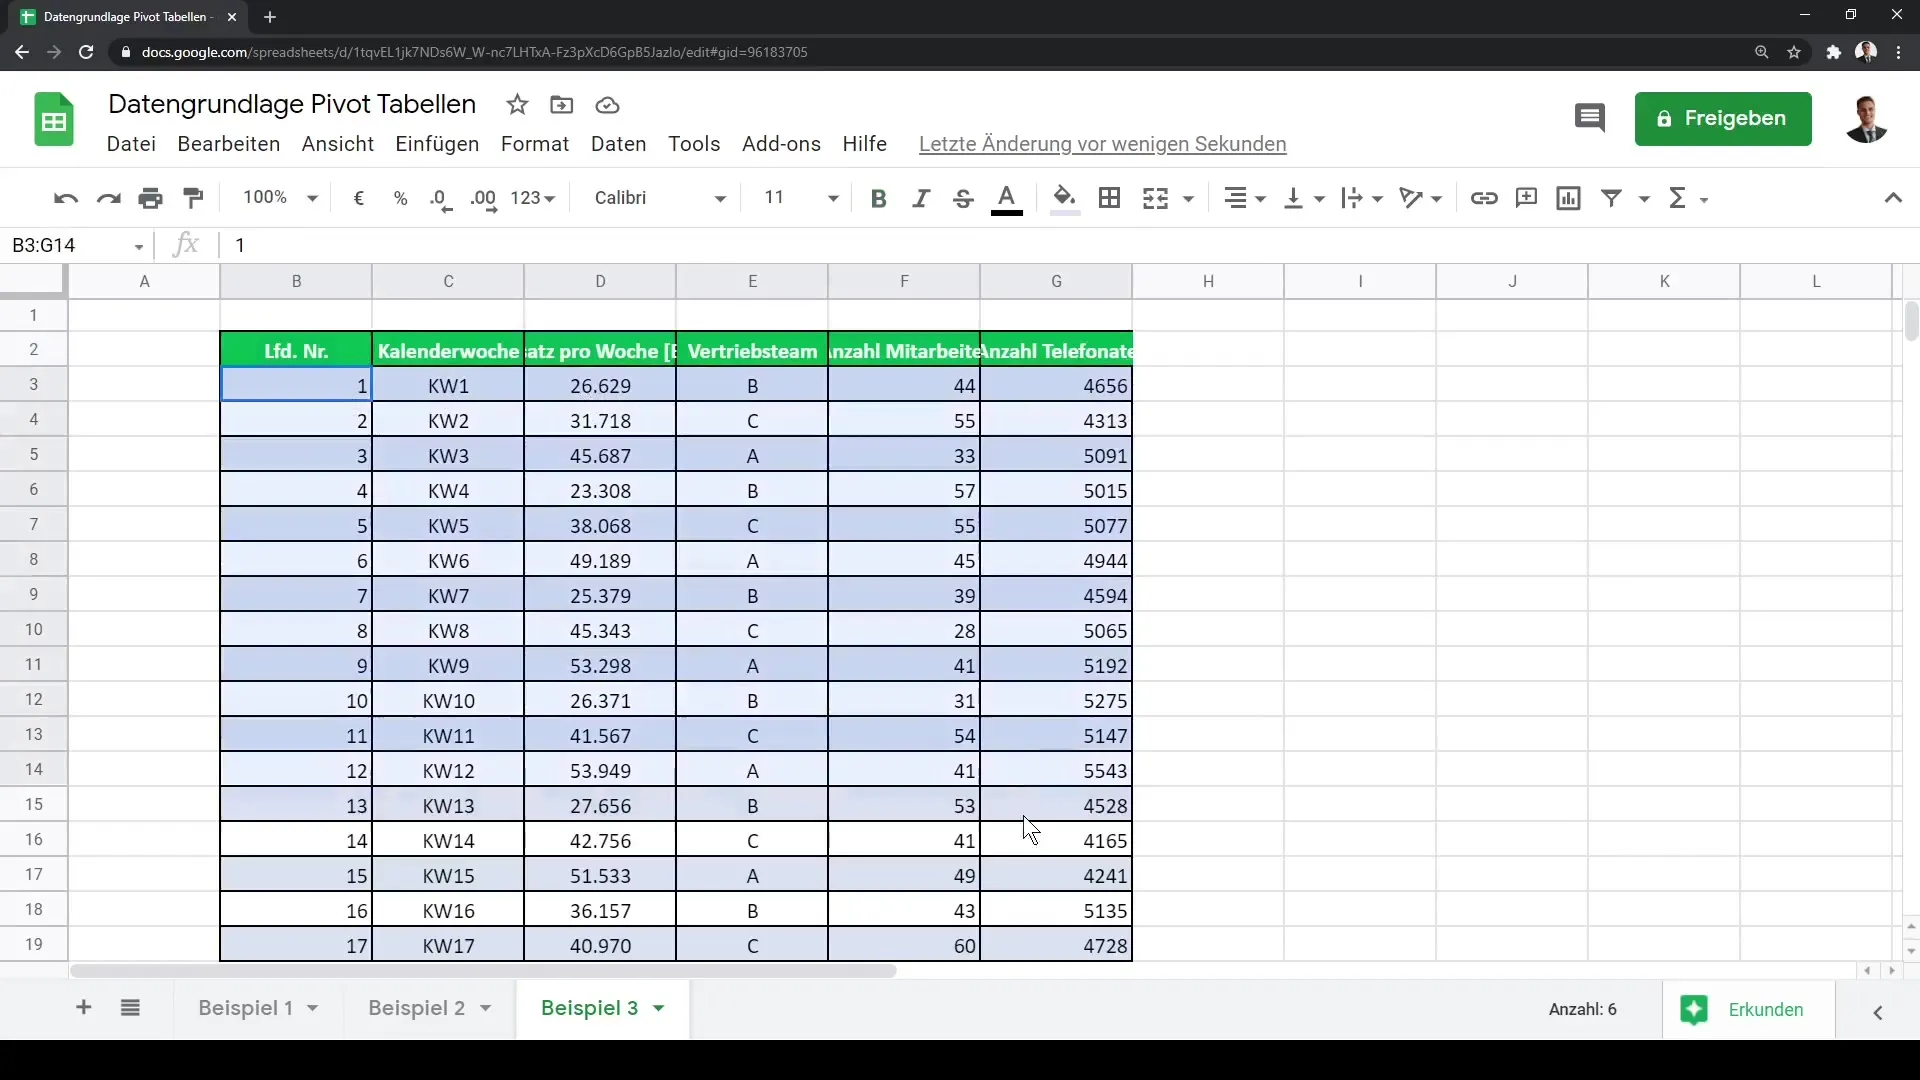
Ideally, a good data structure looks as follows: The column headings are in the first row, followed by the corresponding attributes and values. Maintain a consistent data preparation in each column. This means that sales, revenue, or other values should all be in the same format.

6. Preparing for the Pivot Table
Once you have completed the structure and cleansing of your data, you can prepare for creating your Pivot Table. The previous formatting is crucial as it simplifies the entire analysis process. You should now be ready to make the information captured in the database usable.
Summary
In this guide, you have learned how important the right data foundation is for creating Pivot Tables in Google Sheets. Clear column headings, avoiding subtotals, and cleaning empty rows are crucial factors for the success of your analysis. By following these steps, you are optimally prepared to use Pivot Tables.
Frequently Asked Questions
What is a Pivot Table?A Pivot Table is a data analysis tool that allows you to consolidate and evaluate large amounts of data.
Why are unique column headings important?Unique column headings help to interpret the data correctly and facilitate the analysis.
What happens if I leave subtotals in my data?Subtotals can lead to inaccurate results in your Pivot Tables as they influence the aggregated values.
How can I remove empty rows in my Google Sheets?You can remove empty rows by right-clicking on the row and selecting "Delete row."
Is there a recommended structure for my data table?Yes, it is recommended to use the first row for headings and the subsequent rows for the actual data without subtotals or empty rows.


