In today's tutorial, we will delve into statistical functions in Google Sheets. Statistical functions play an important role in data analysis, especially when working with large amounts of data. In this context, we will learn how means, measures of dispersion, and relationships between data can be calculated. This guide will take you through the key functions and help you develop a basic understanding of descriptive statistics.
Key Insights
- You will learn how to calculate the arithmetic mean, the mode, and the median in Google Sheets.
- You will gain insights into calculating quantiles, standard deviations, and variances.
- You will discover how to analyze statistical relationships between different data sets.
Step-by-Step Guide
Introduction to Statistical Functions
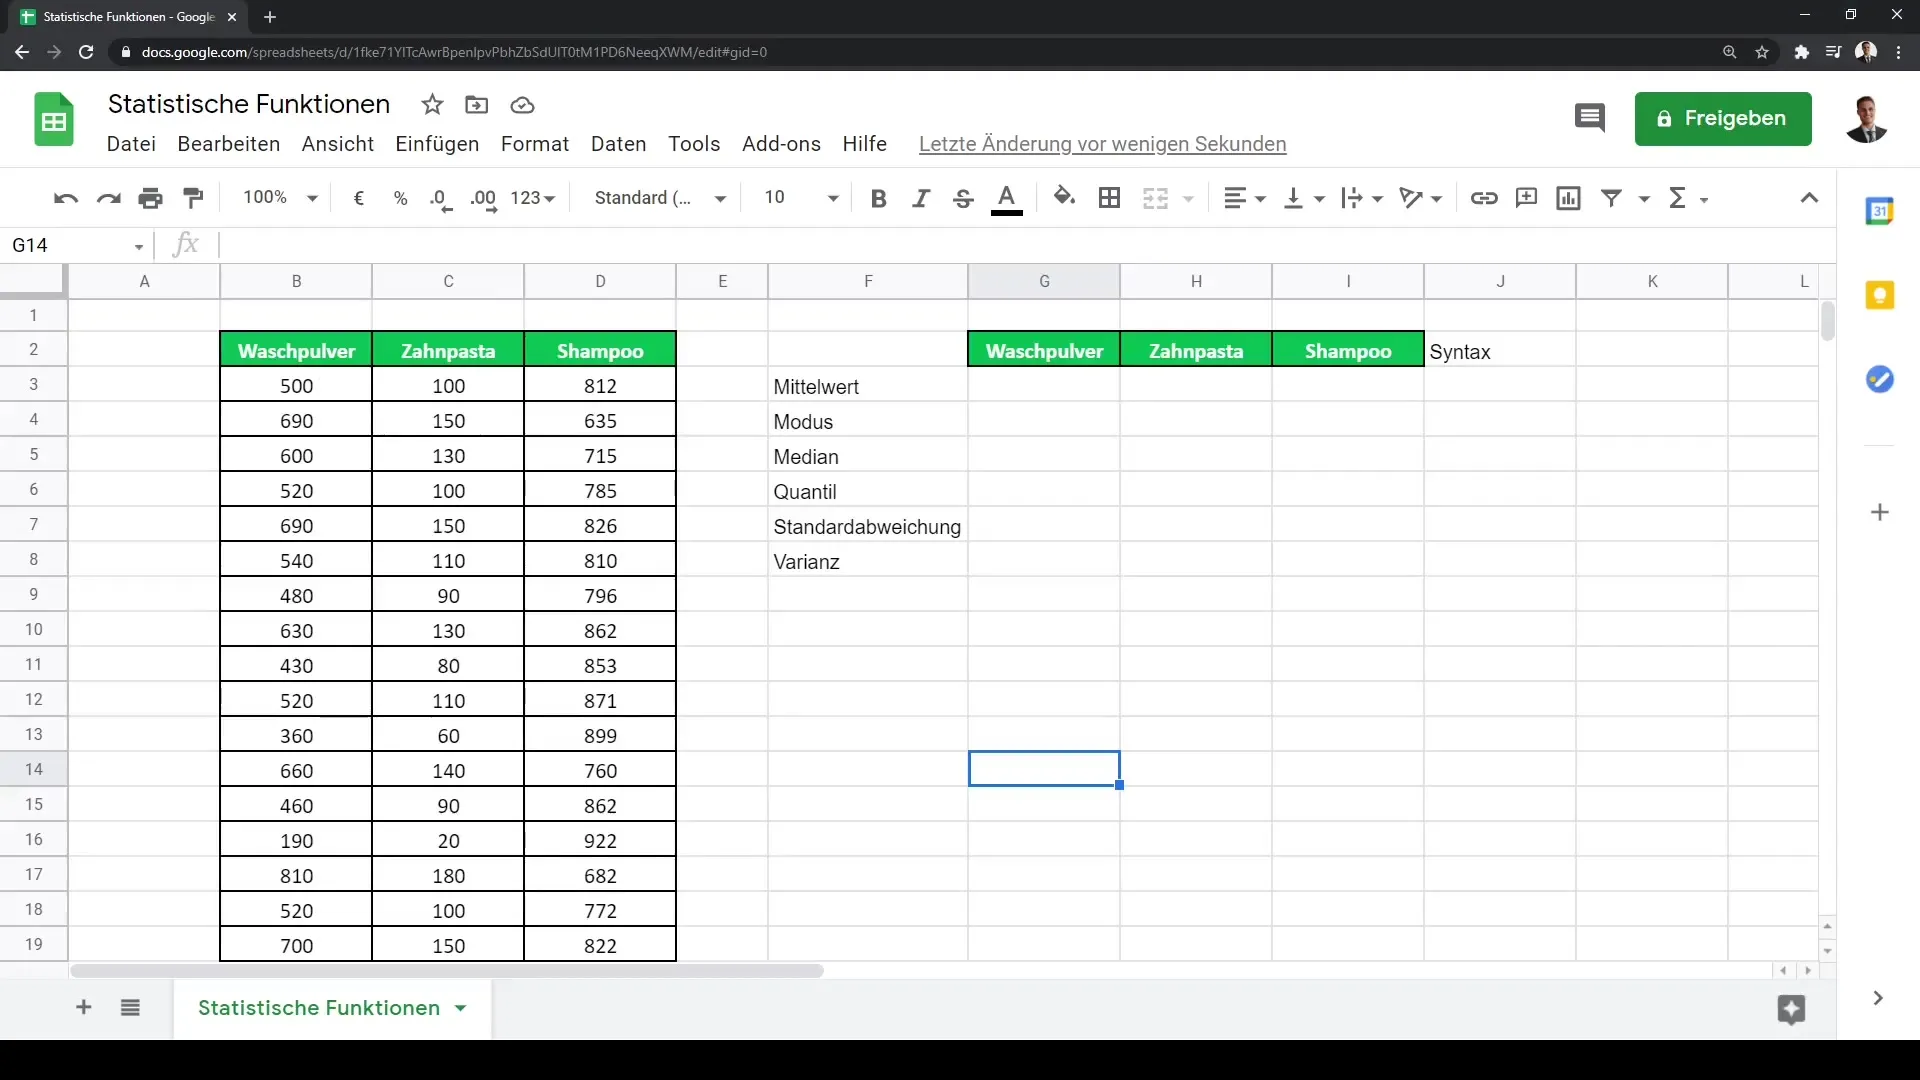
First and foremost, we need to take a closer look at the various statistical functions in Google Sheets. You can click on the "Functions" tab in Google Sheets to display a variety of categories, including statistical functions. These functions are crucial when working with extensive data sets to quickly and effectively gain insights.
Calculating the Mean
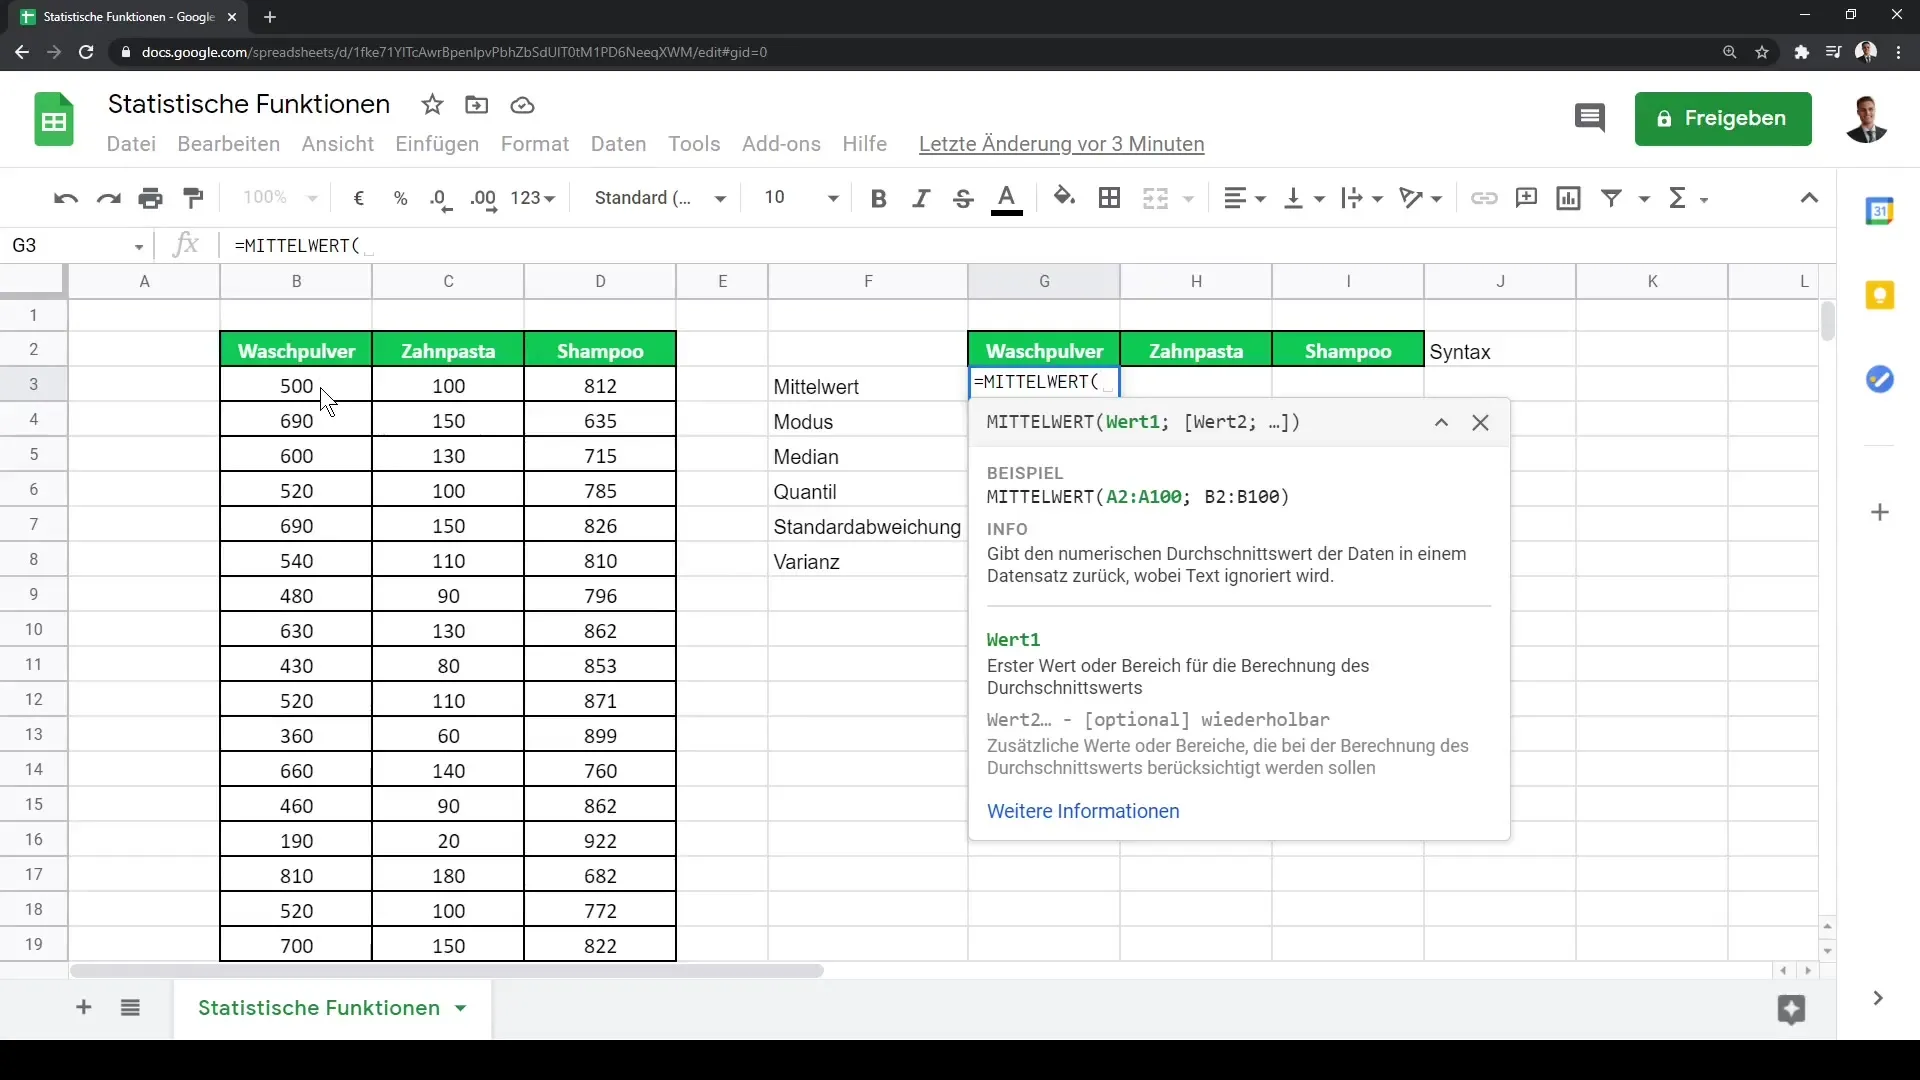
Let's start with the so-called measures of central tendency. The arithmetic mean, also known as average, is one of the key measures in statistics. To calculate the mean, you can use the AVERAGE formula. For example, if you are a consumer goods company and want to calculate the average revenue from different product categories such as laundry detergent, toothpaste, and shampoo.
To do this, you can use the formula =AVERAGE(B2:B4), where B2 to B4 are the cells containing your revenue data.
Mode and Median
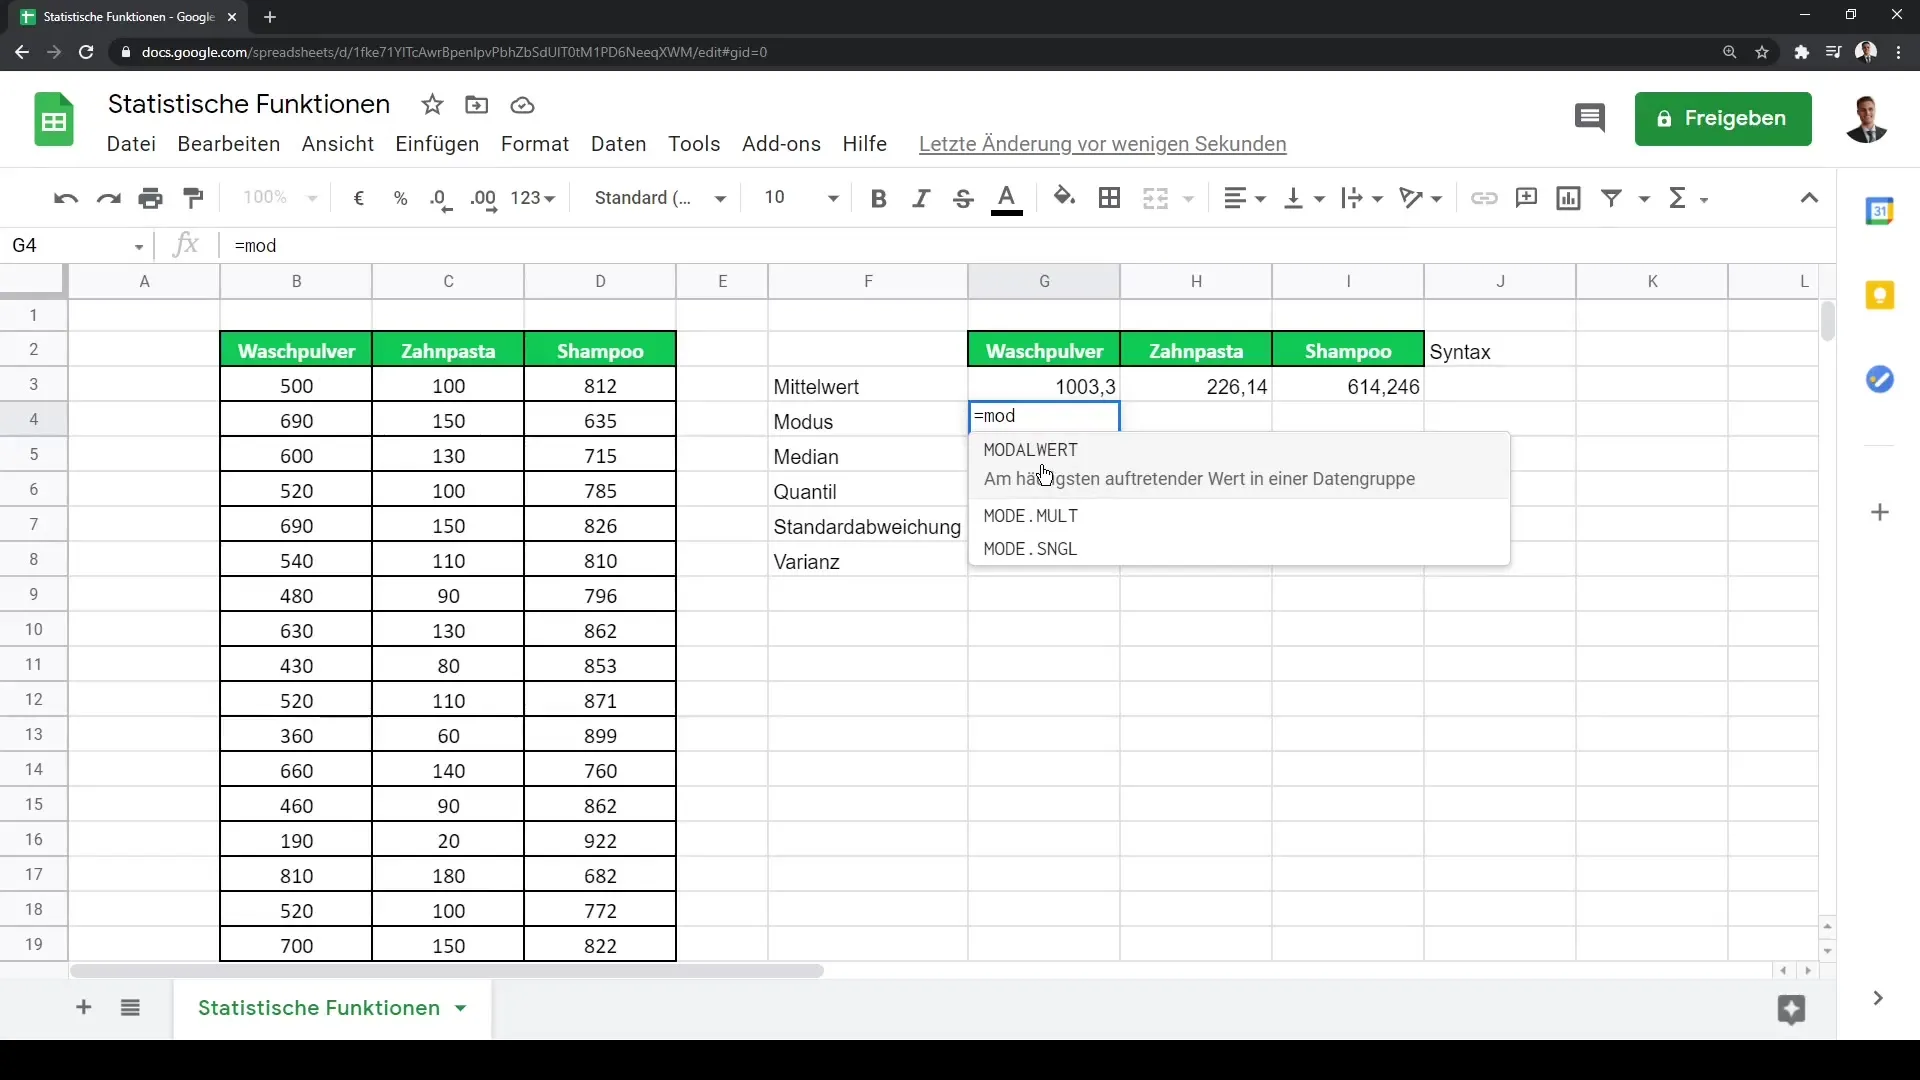
Another important measure is the mode, which determines the most common value in a dataset. You can achieve this using the MODE formula, which can also work with texts. For example, you can determine the revenue for different products by filtering out the most frequent revenues.
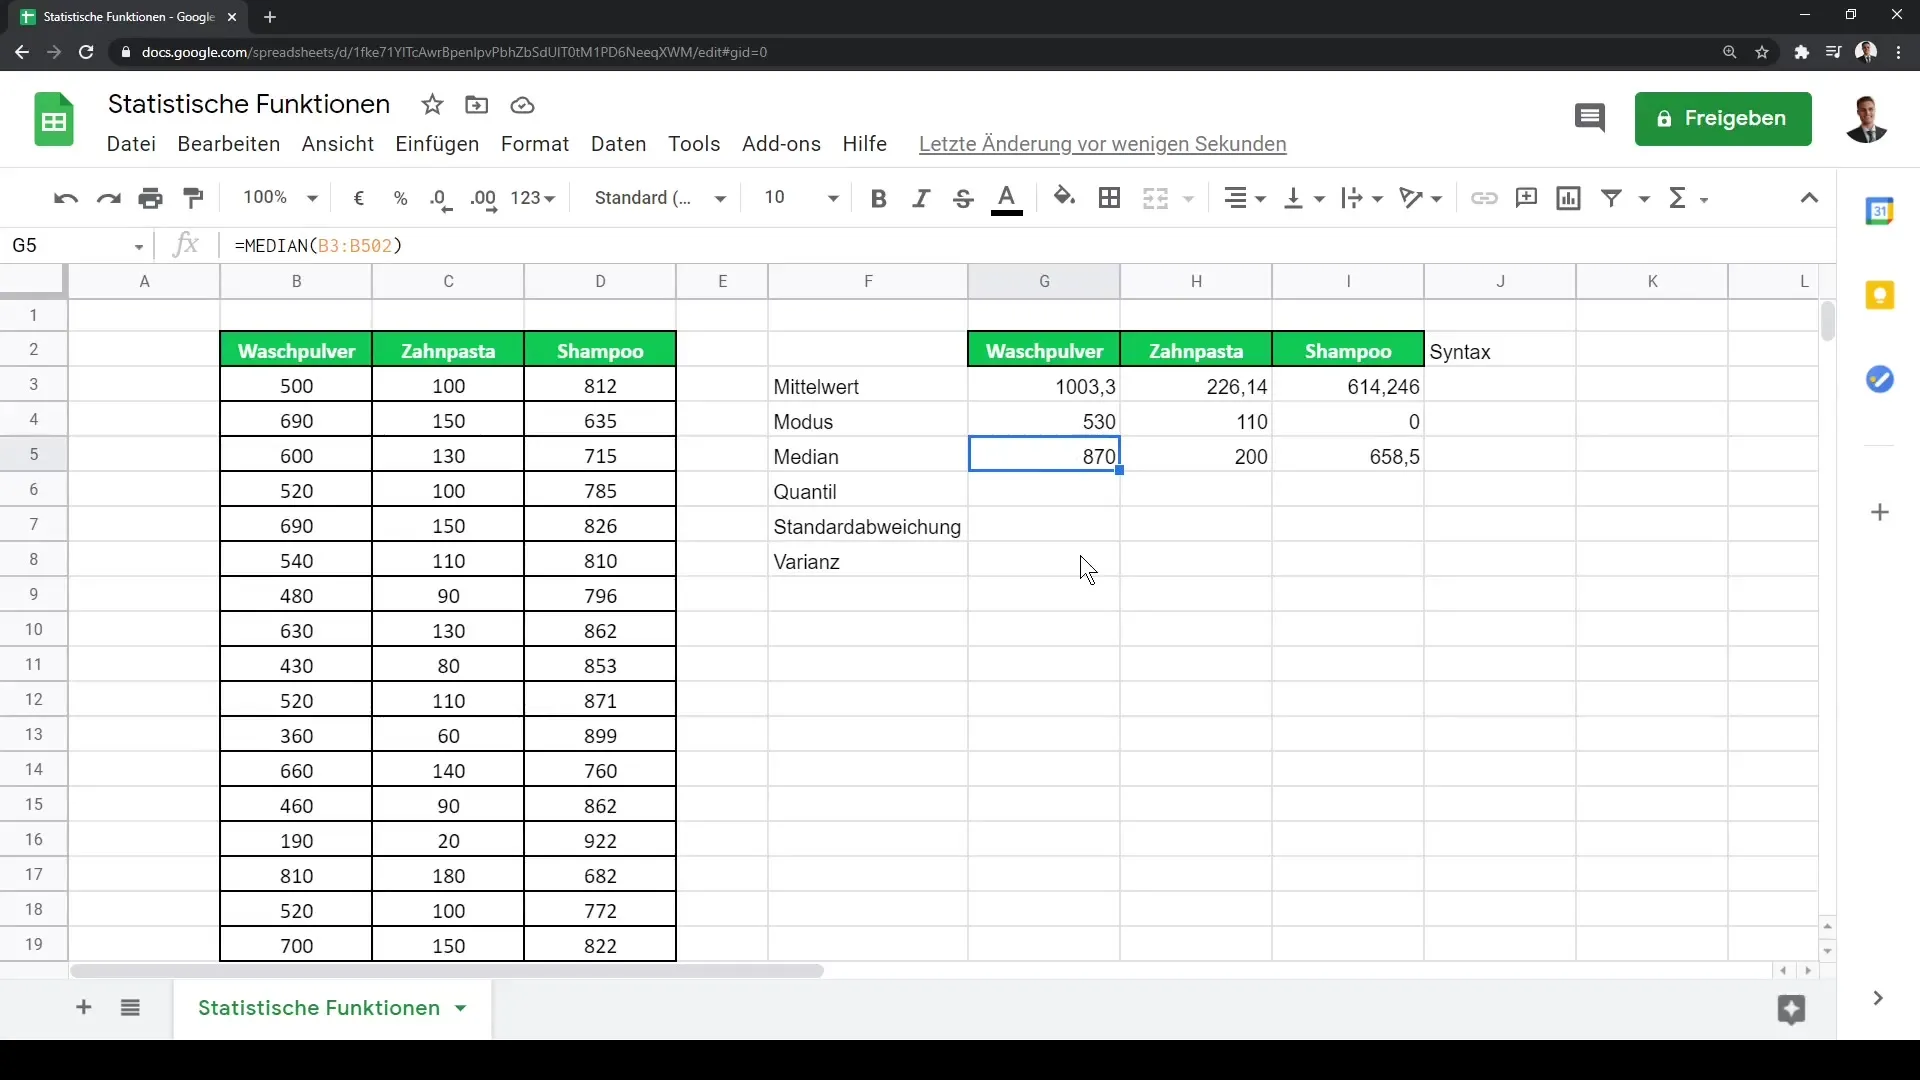
The median gives you the value that lies exactly in the middle of your data when sorted in ascending order. To calculate the median, you use the MEDIAN formula, e.g., =MEDIAN(B2:B4).
Calculating Quantiles
Quantiles help you better understand the distribution of your data. You can calculate the first (0.25) and third (0.75) quartiles using the QUARTILE formula. This provides valuable insights into the distribution of your data. For example, you could use =QUARTILE(B2:B4, 1) for the first quartile.
Analyzing Dispersion
The standard deviation is an important measure of the spread of your data. You can calculate the standard deviation using the STDEVP or STDEV formula. The standard deviation helps you understand how much the data varies around the mean. For example, you could use =STDEV(B2:B4) to calculate the standard deviation of your revenues.
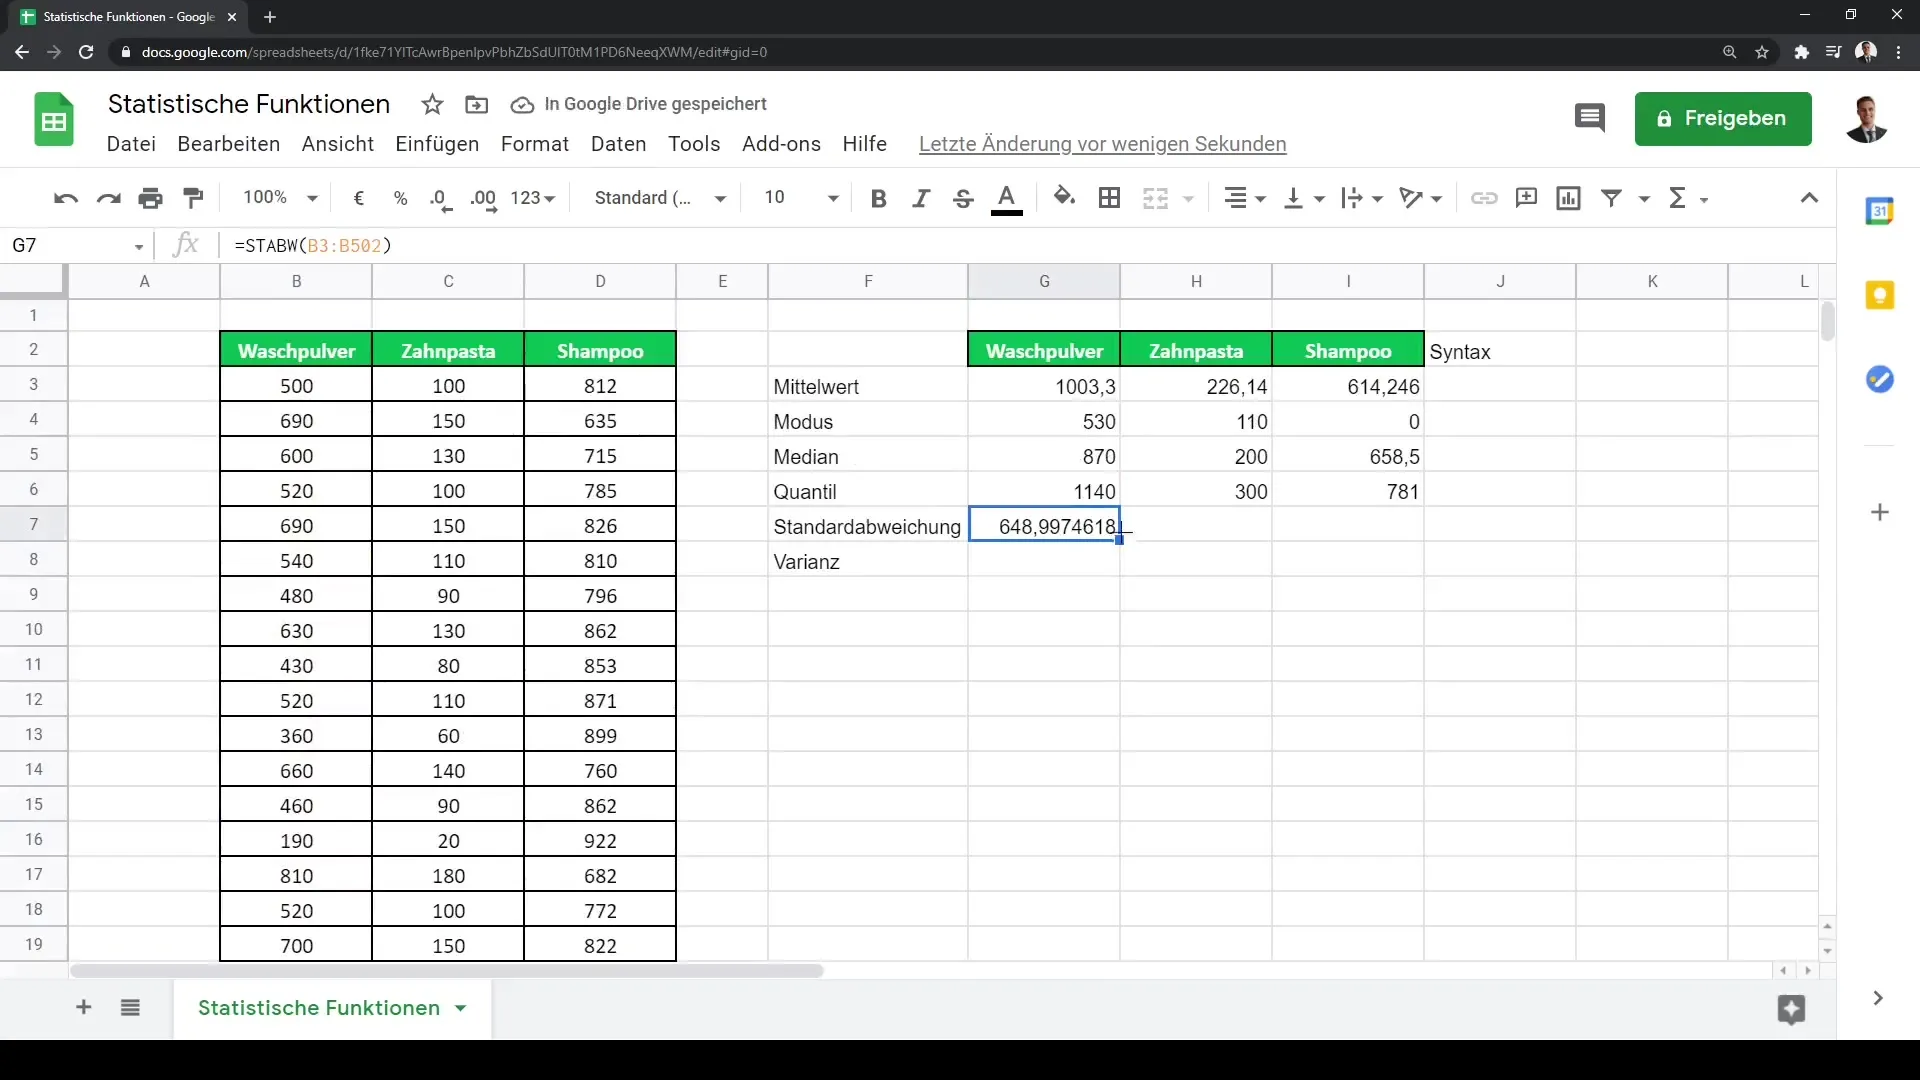
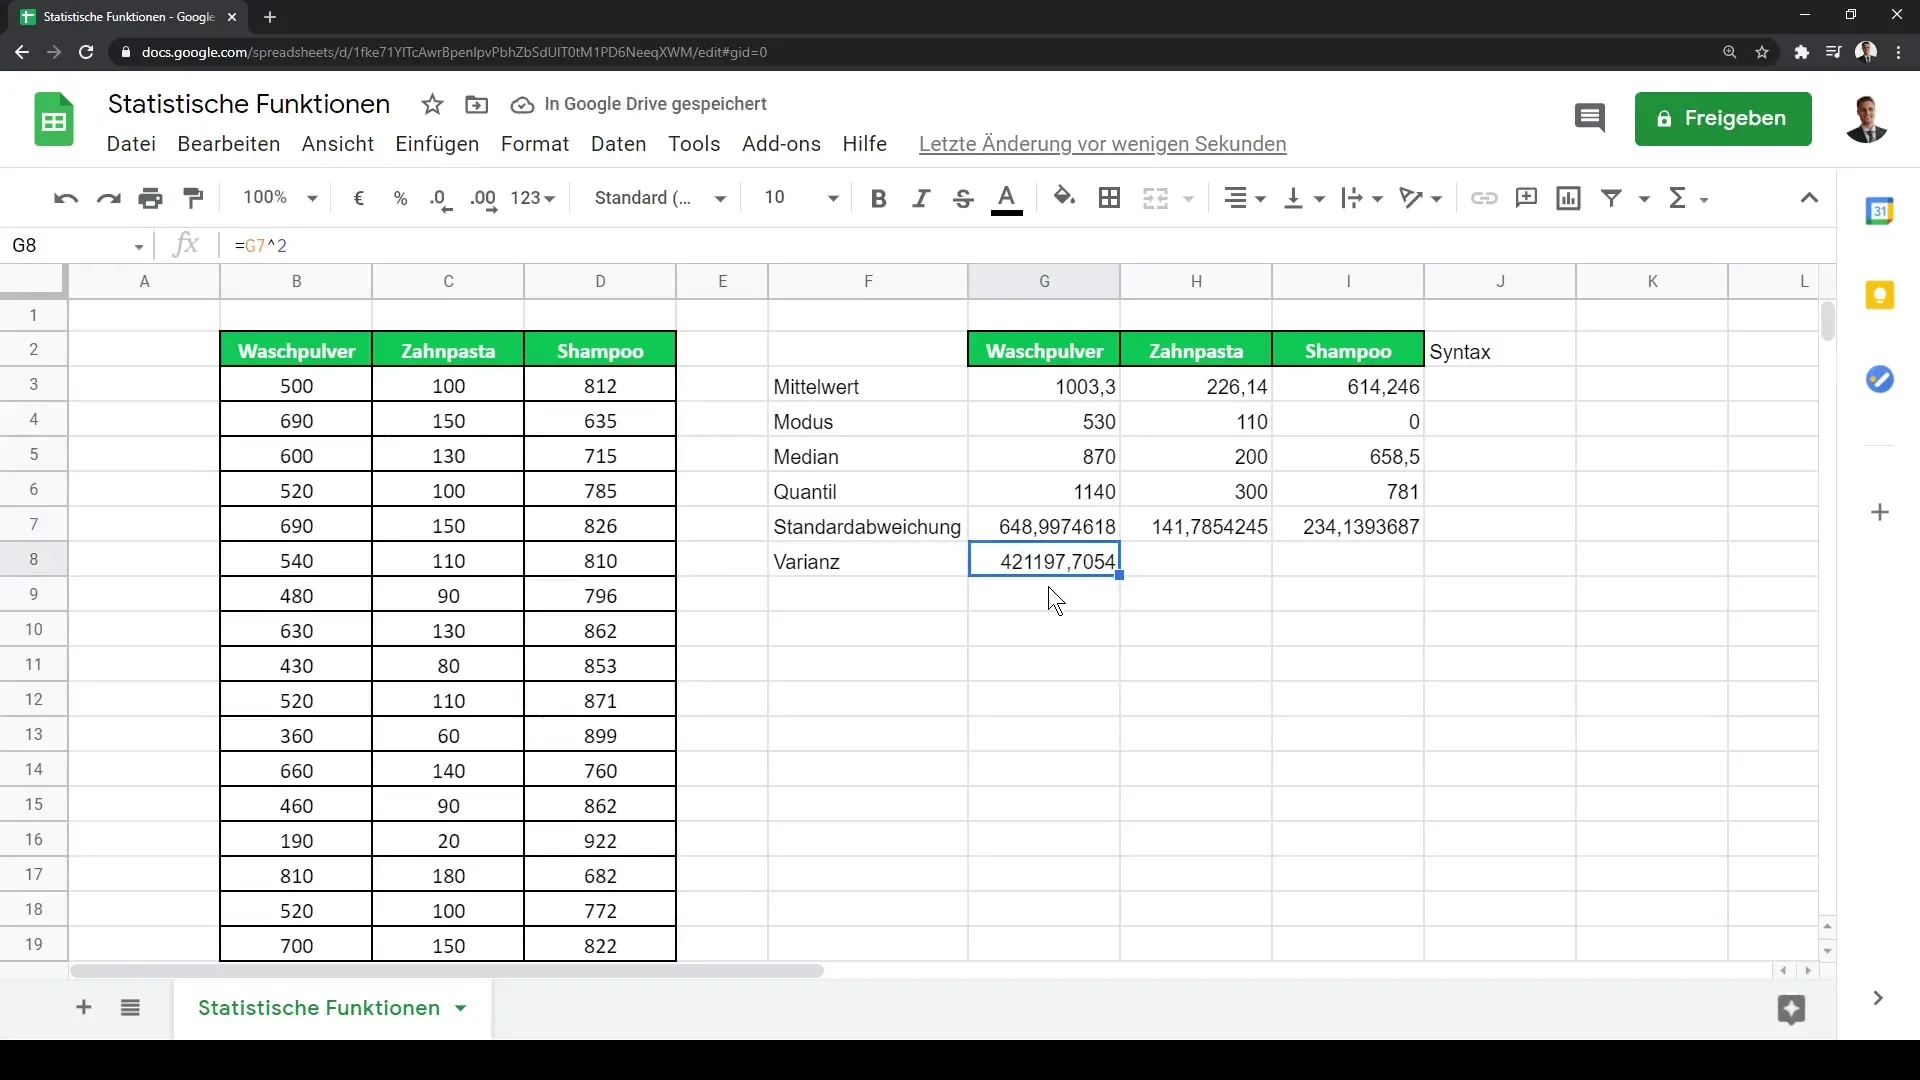
For calculating the variance, you can use the VAR.P formula, which provides the variance of the population by squaring the standard deviation. This not only gives you a quantitative value for dispersion but also relates to other statistical analysis methods.
Relationship between Data Sets
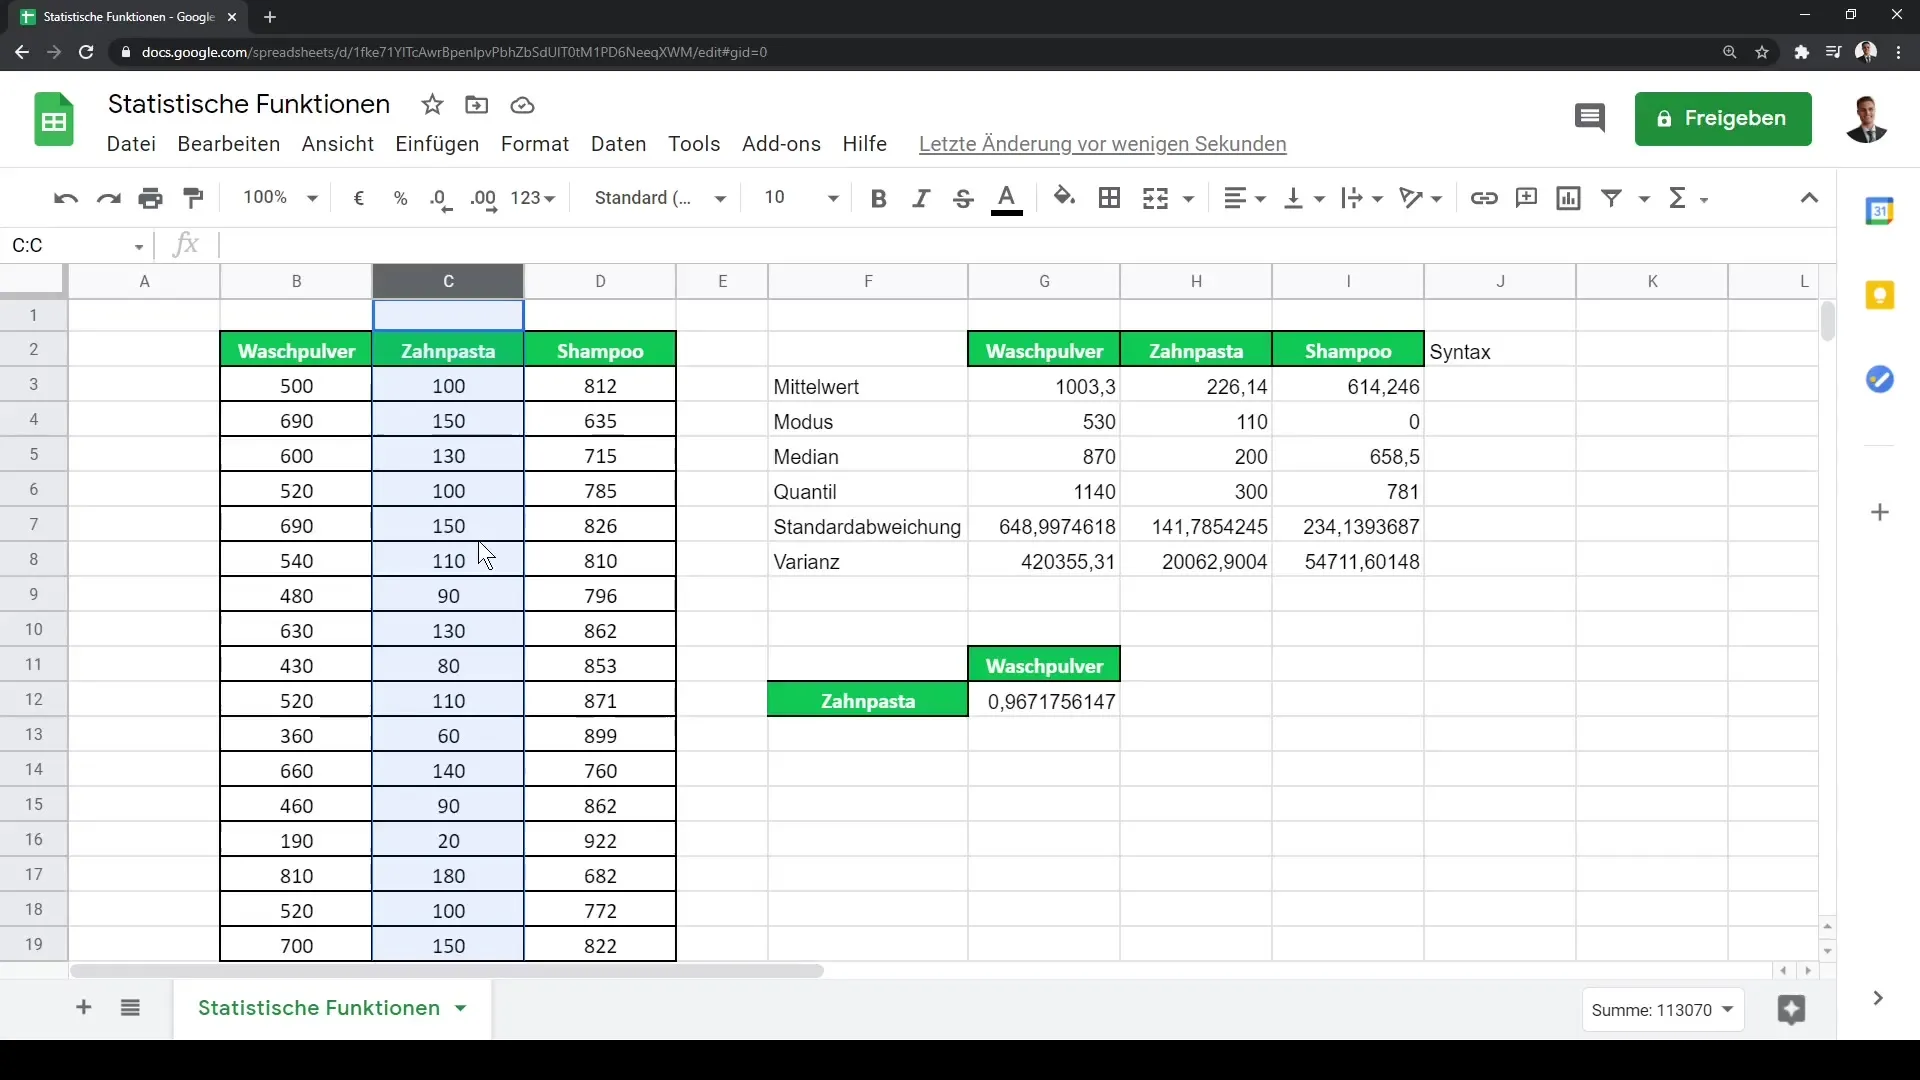
After calculating the location and dispersion of your data, it is also important to determine whether there is a relationship between different data sets. An example could be examining the relationship between the revenues of laundry detergent and toothpaste. You can calculate the Pearson correlation coefficient using the CORREL formula to check for a statistical relationship.
For example, you would use =CORREL(A2:A4, B2:B4), where A2 to A4 represent the revenues of laundry detergent and B2 to B4 represent the revenues of toothpaste. A value close to 1 indicates a strong positive correlation, while a value close to -1 indicates a strong negative correlation.
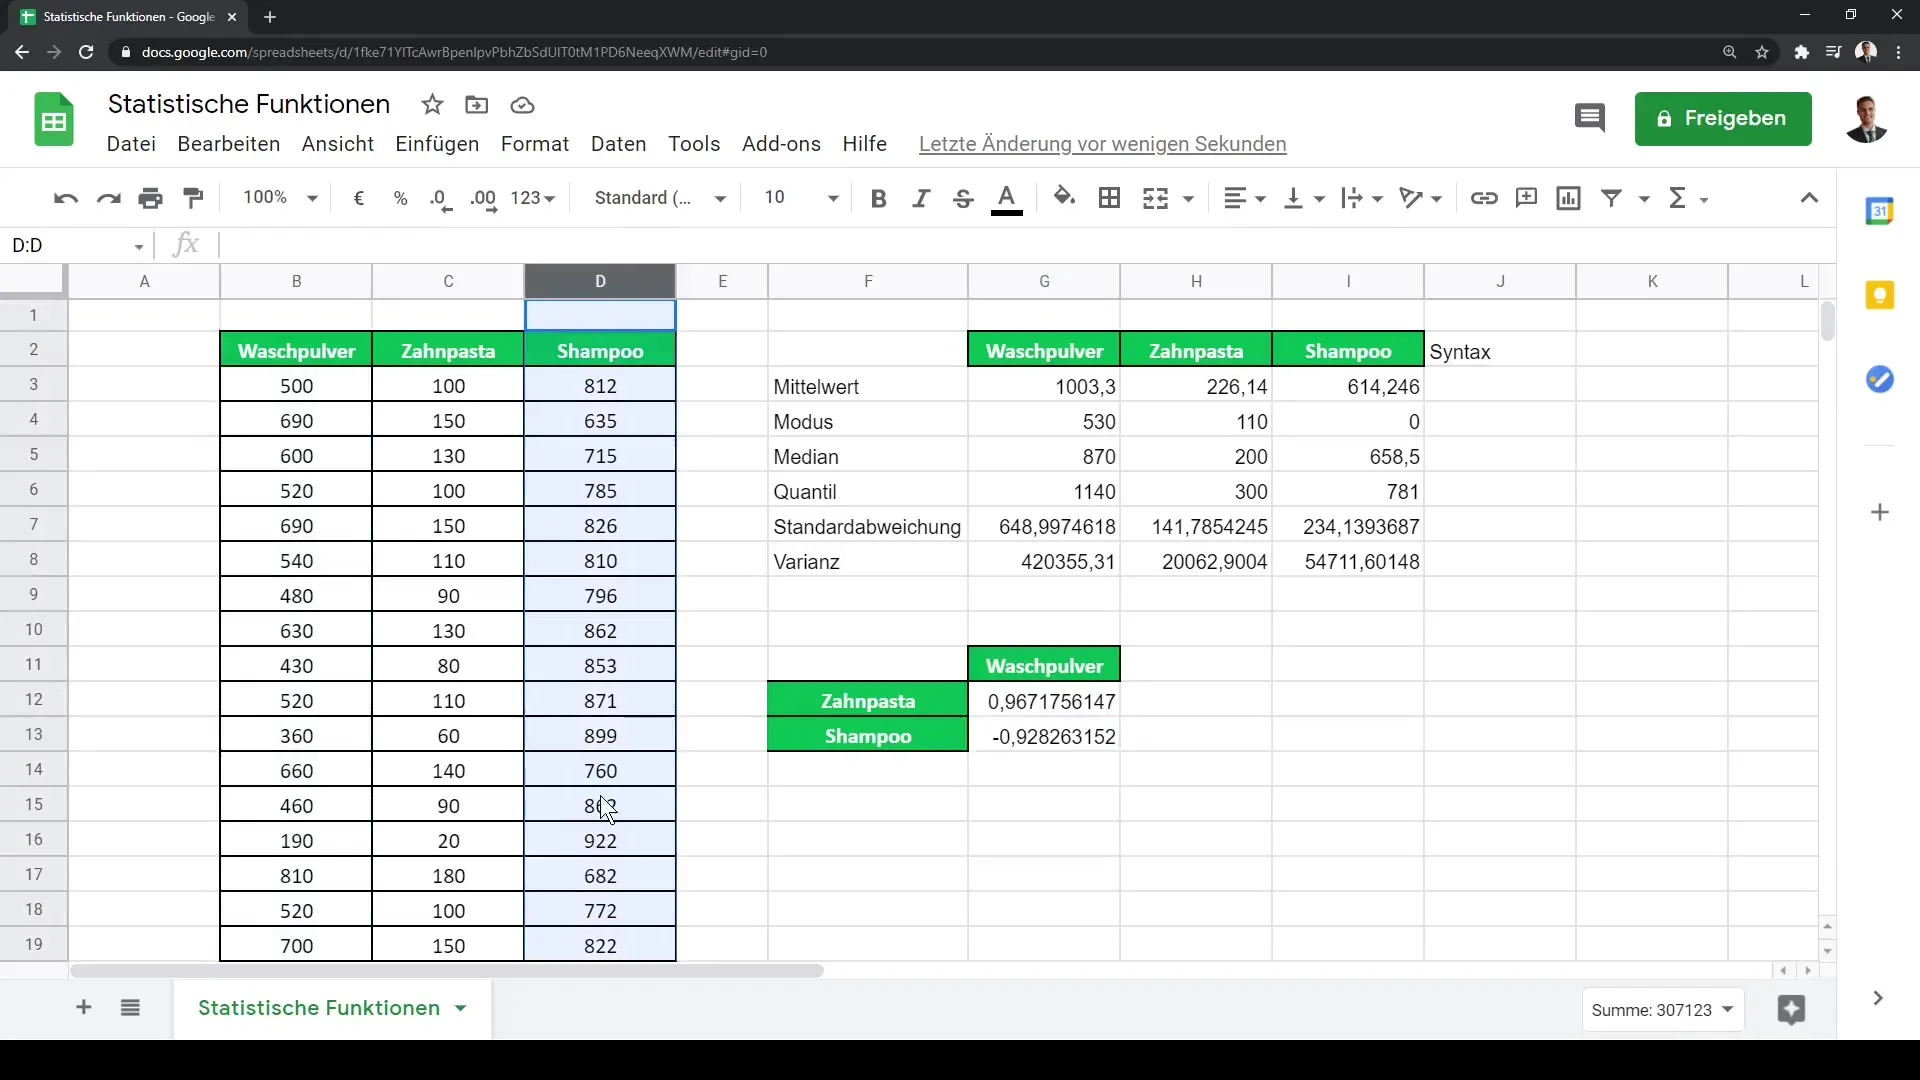
If you then want to analyze further relationships, for example between detergent and shampoo, you can follow a similar approach to examine the correlation between these product categories.
Summary
In this tutorial, you have learned about various statistical functions in Google Sheets. Calculating the mean, mode, median, and quantiles as well as analyzing measures of dispersion such as standard deviation and variance are crucial for any statistical analysis. In addition, you have become familiar with examining the relationship between different datasets, which helps you gain deeper insights into your data.
Frequently Asked Questions
What is the difference between mean, mode, and median?The mean is the average value, the mode is the most frequent value, and the median is the value in the middle of a sorted dataset.
How do I calculate standard deviation in Google Sheets?You can calculate the standard deviation using the formula =STDEV(range), where "range" represents the cells containing your data.
What does a Pearson correlation coefficient of 0.96 mean?A value of 0.96 indicates a very strong positive correlation between the two datasets being studied.


