Google Sheets is a powerful tool that can help you extract financial information from various sources, especially by using the Google Finance function. This function allows you to pull security information directly from Google Finance into your spreadsheets and use them for analysis or reports. In this tutorial, I will show you how to effectively apply this function.
Key Insights
- The Google Finance function allows you to retrieve real-time and historical financial data.
- You can analyze stocks and other securities, including price, trading volume, and market capitalization.
- The information can be graphically visualized in Google Sheets to show trends over time.
Step-by-Step Guide
Step 1: Introduction to the Google Finance Function
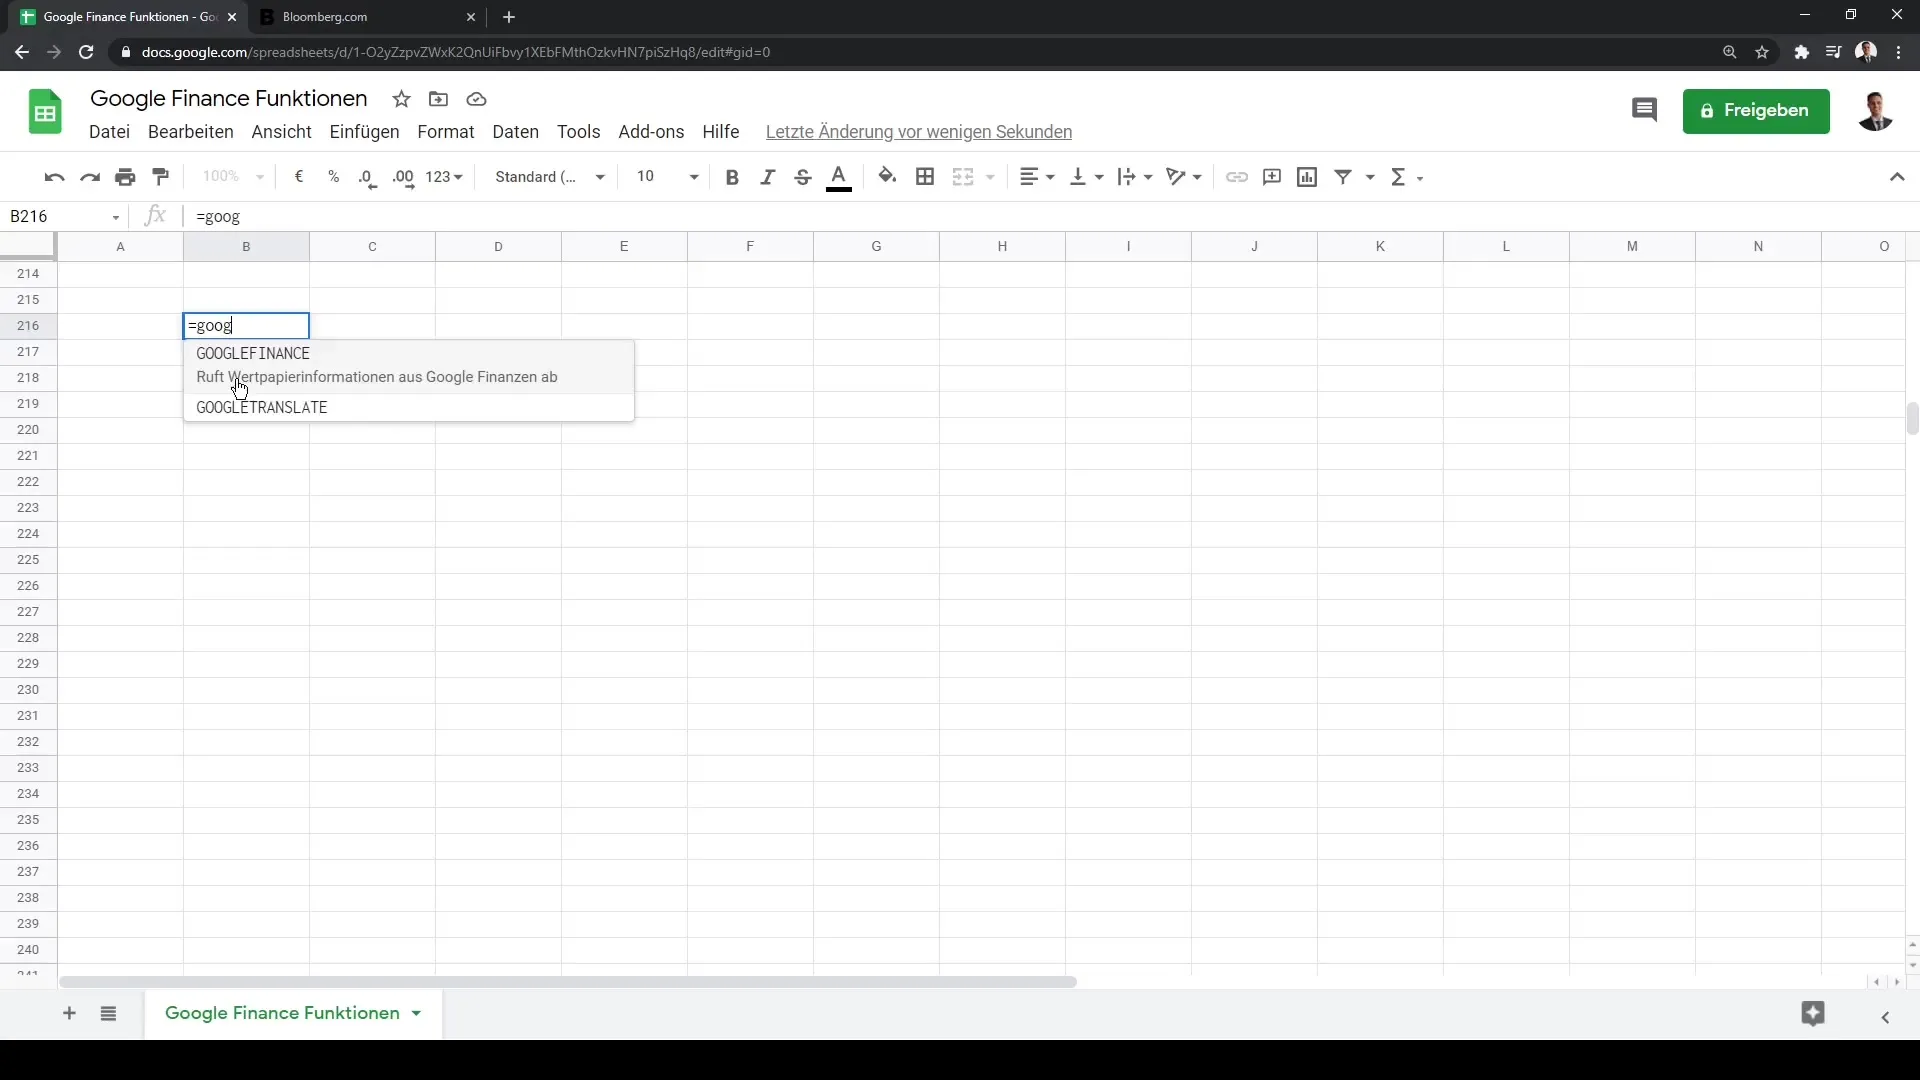
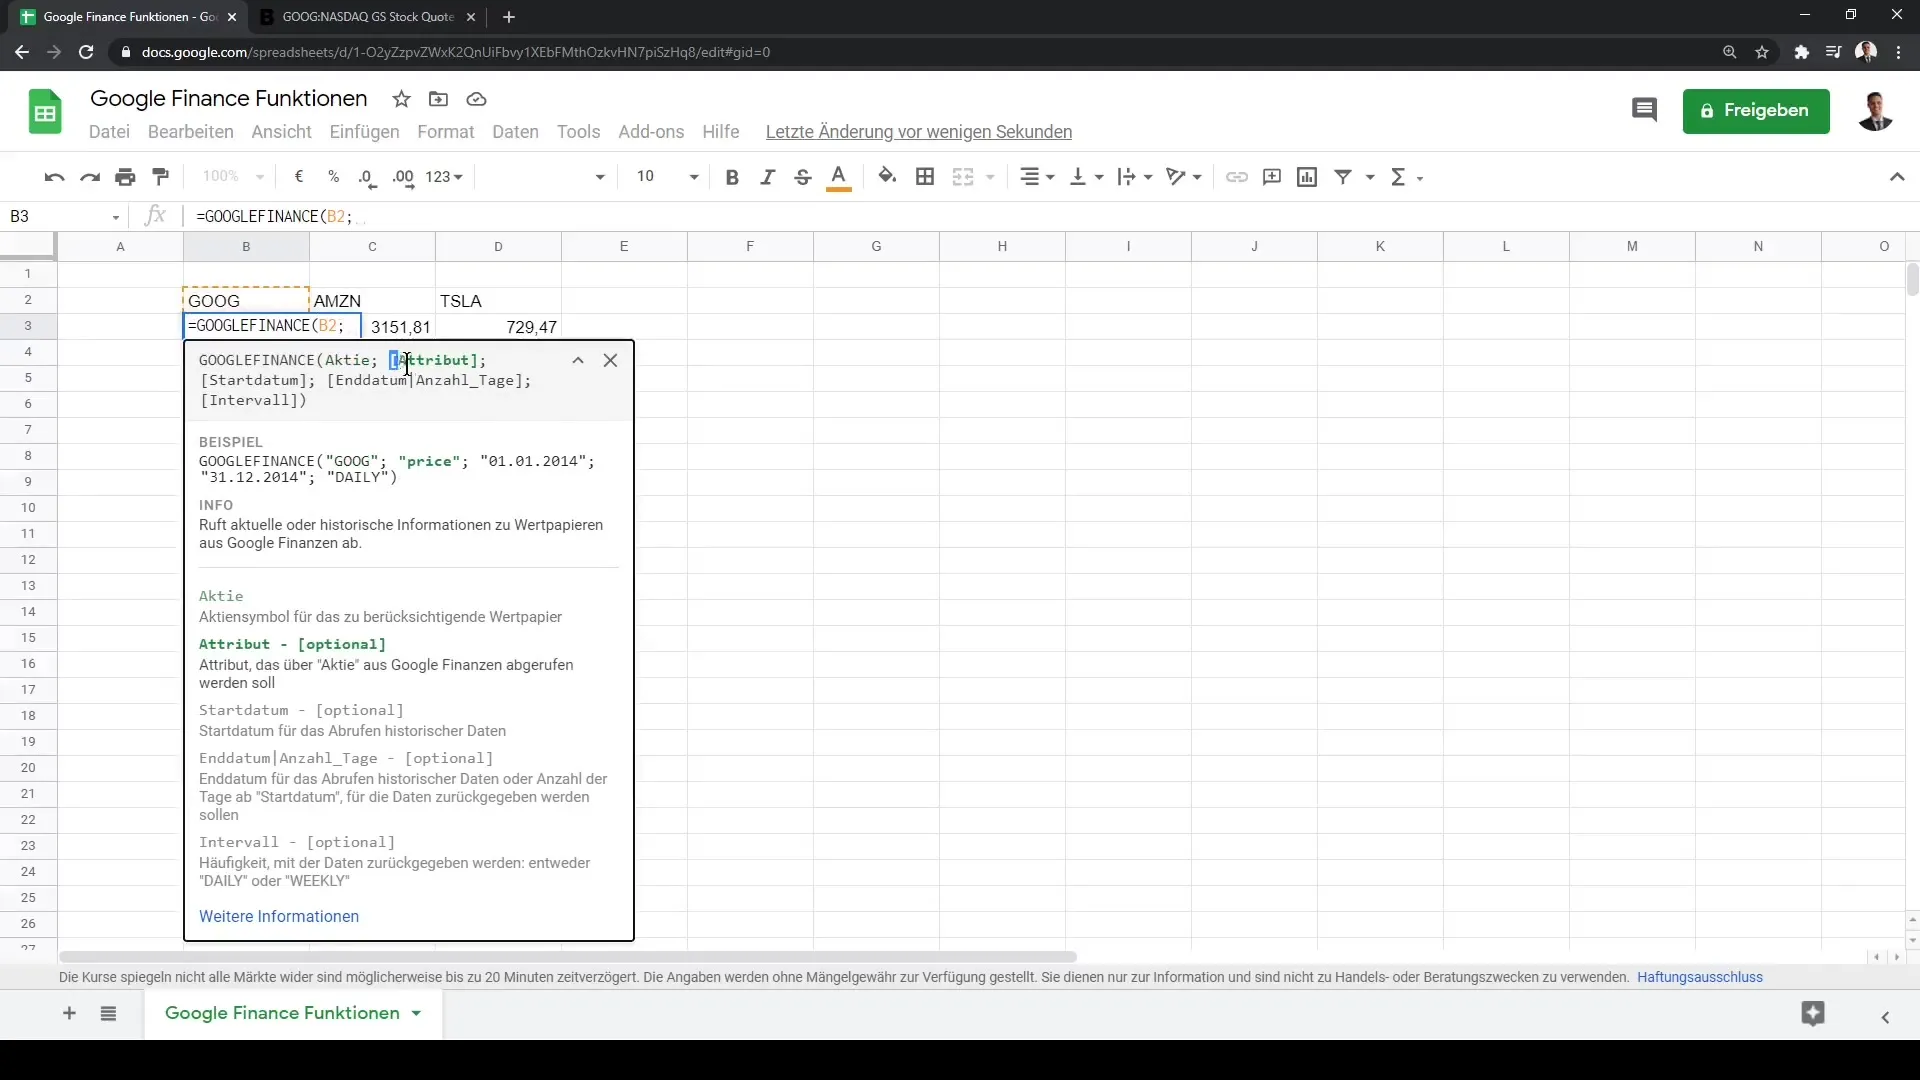
Start by entering the Google Finance function into your table. The function is simply =GOOGLEFINANCE(). This function retrieves various financial data that is typically not available in other spreadsheet programs.
Step 2: Retrieve Current Stock Price
First, select a stock whose information you want to retrieve. For example, you could use Google's stock. Search on a financial website like Bloomberg or finanzen.net for Google's ticker symbol, which is "GOOG". Then enter this ticker symbol into the Google Finance function.
Step 3: Using the Google Finance Function
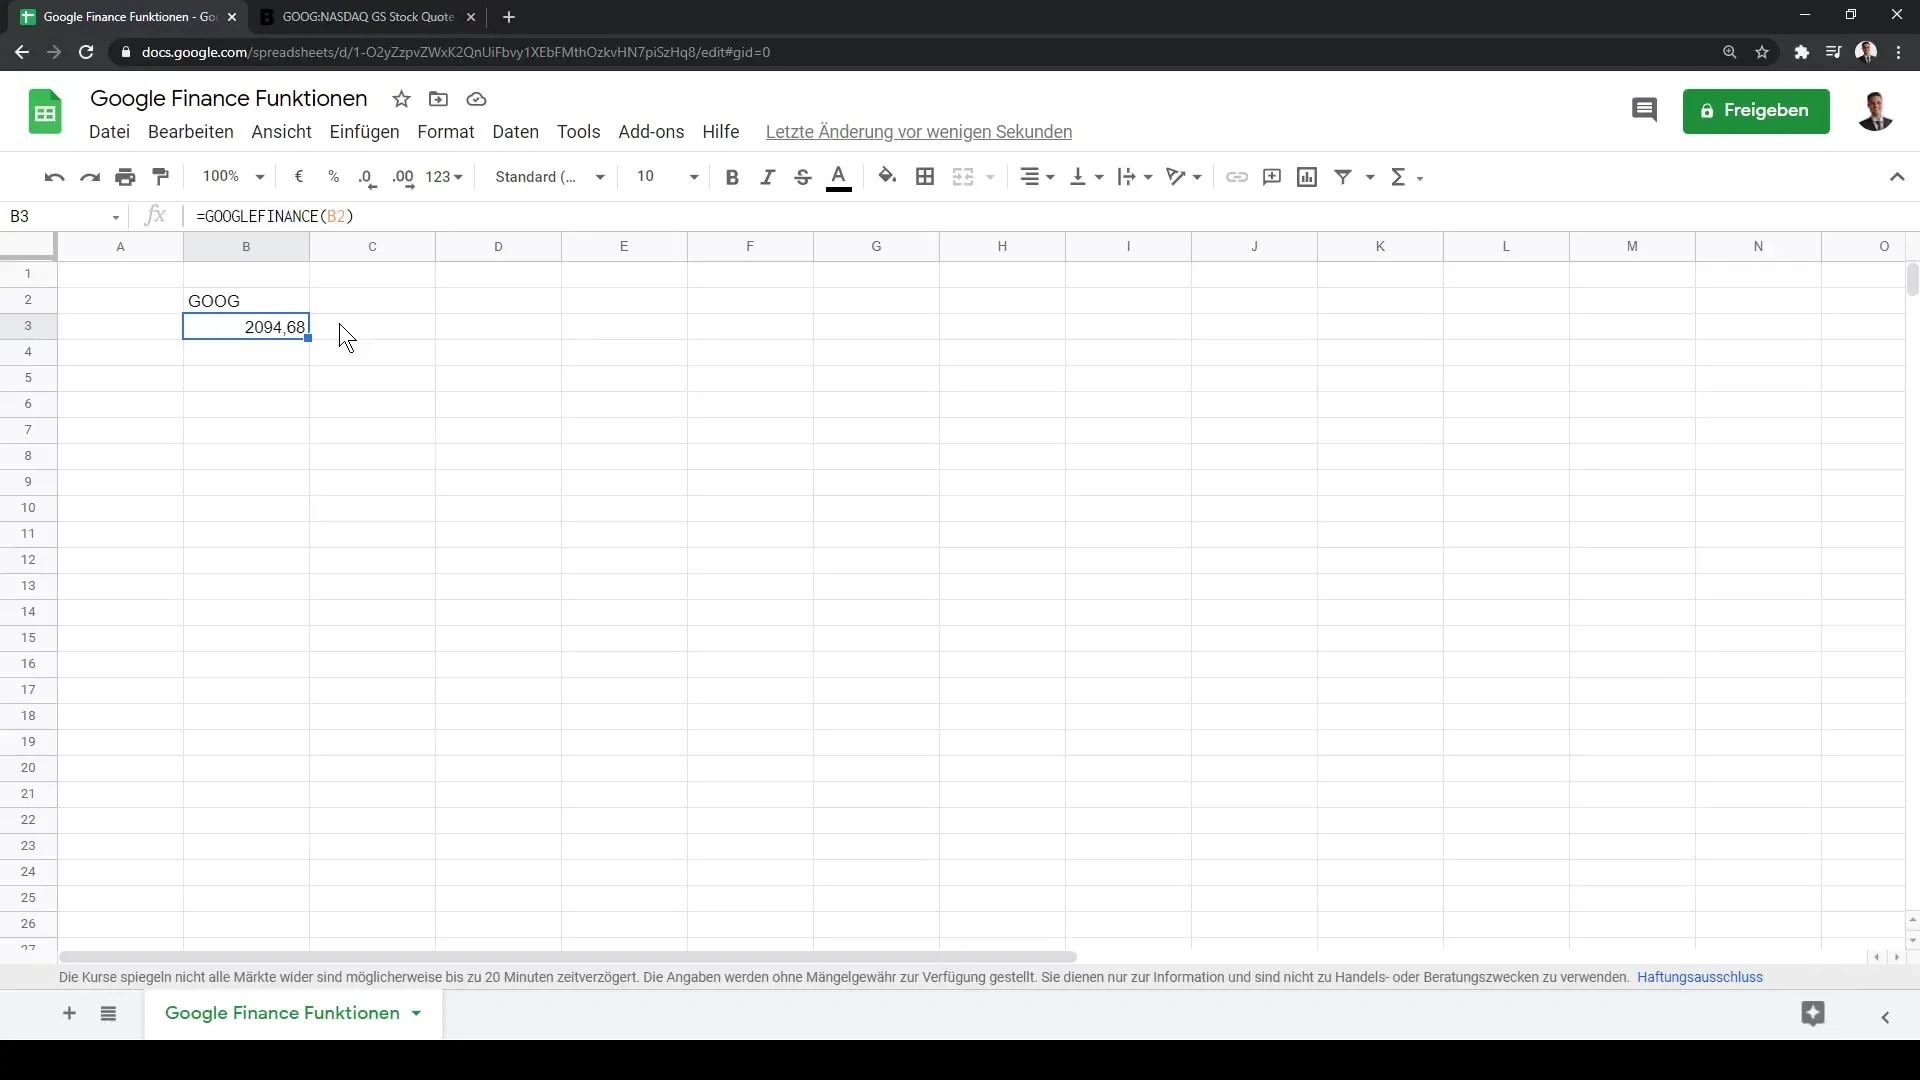
Enter the function to query the current price by specifying the ticker and the respective attribute. For example: =GOOGLEFINANCE("GOOG", "price"). The result will show the current stock price in US dollars.
Step 4: Retrieve Data for Other Stocks
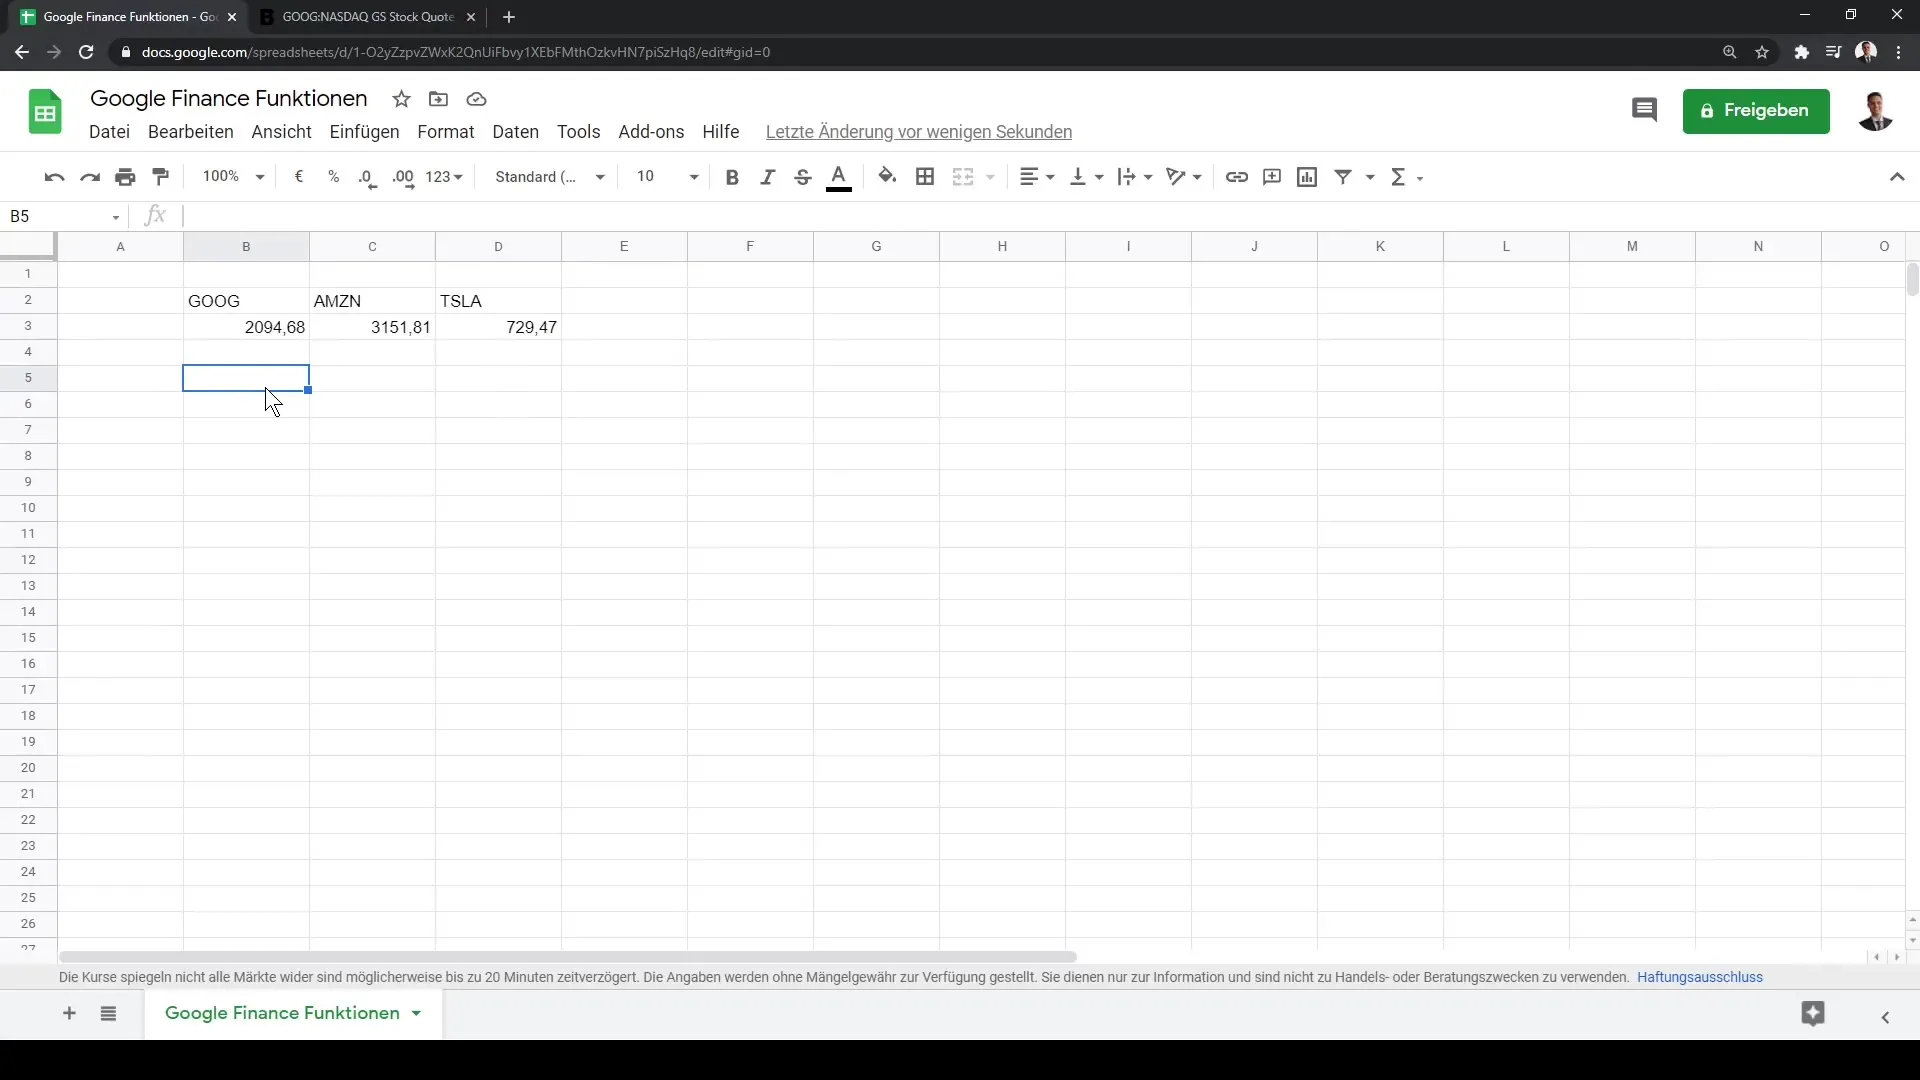
You can use the same function for other companies by simply replacing the ticker. For example, to retrieve the current price of Amazon or Tesla, simply change the ticker within the function.
Step 5: Dragging Data to the Right
To display results for multiple stocks, you can drag the cell where the function is to the right. This will automatically update and display the values for the specified tickers.
Step 6: Adjusting Prices and Attributes
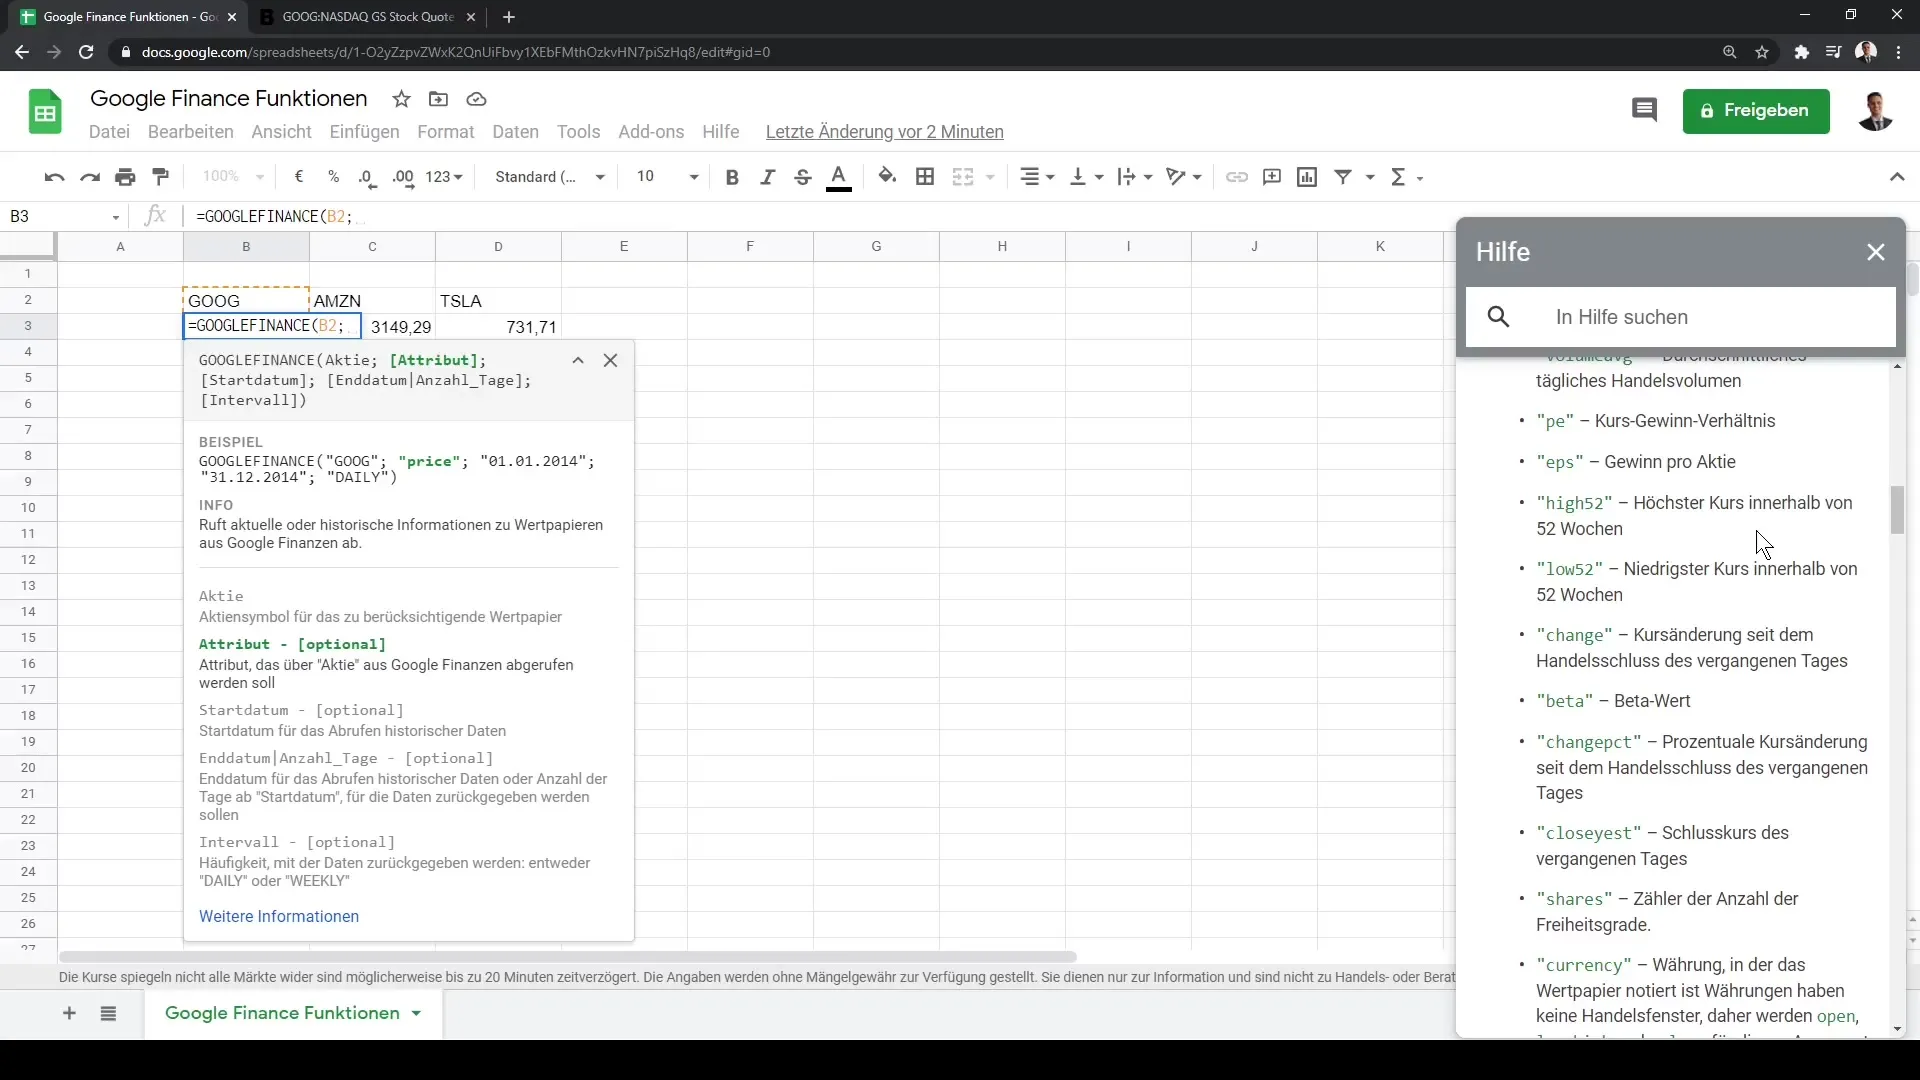
If you want to retrieve not only the price but also other attributes, such as the highest price of the trading day or the trading volume, use semicolons to select different attributes. The complete syntax is =GOOGLEFINANCE("GOOG", "high") for the highest price.
Step 7: Creating Graphical Visualizations
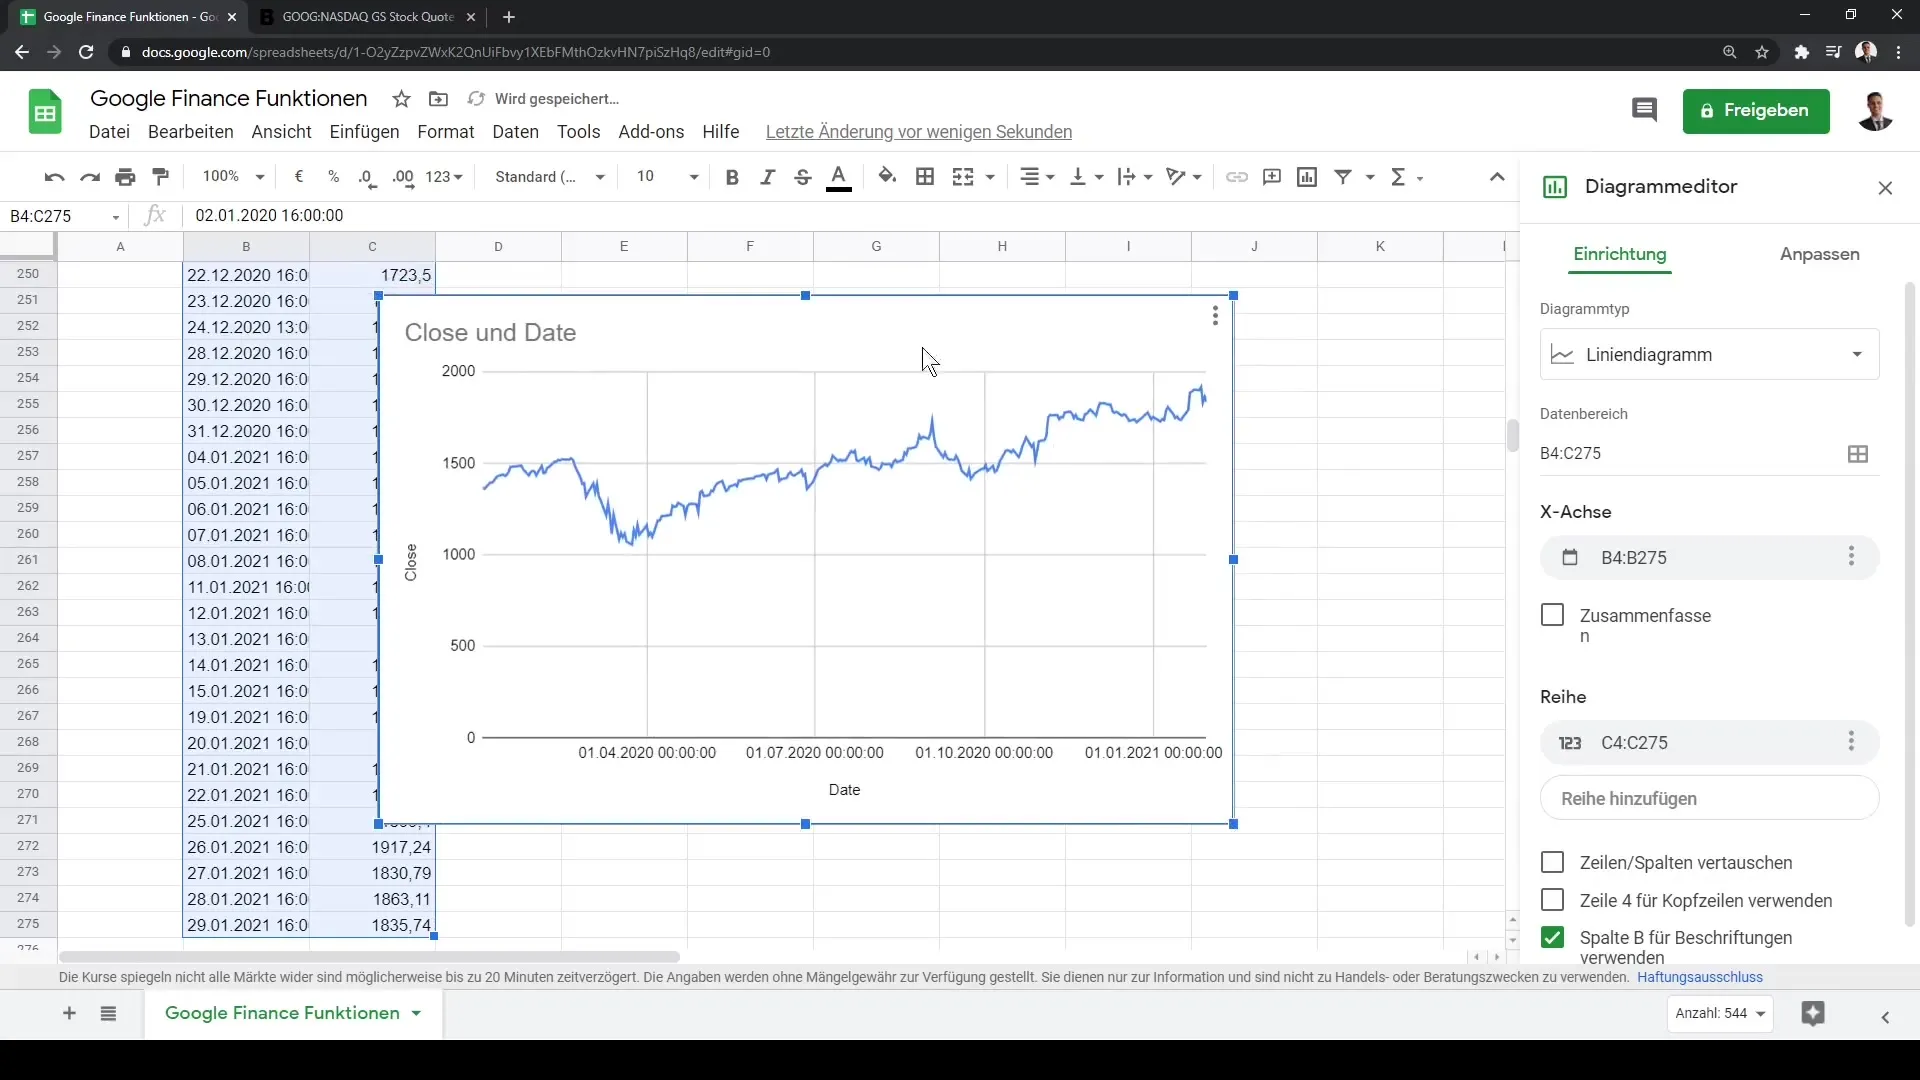
If you want to analyze historical data over an extended period, you can also integrate a start and end date into your function. Use the function =GOOGLEFINANCE("GOOG", "price", DATE(2020, 1, 1), DATE(2021, 1, 31)) to retrieve data between these date ranges.
Step 8: Creating a Chart
To visualize the retrieved data in a chart, select the data and then go to "Insert" and then "Chart" from the menu. This will give you a visual representation of the price development over the selected period.
Step 9: Retrieving Additional Information
In addition to price and stock data, you can also query fundamental financial data such as earnings per share (EPS). This information provides valuable insights into the company's performance.
Step 10: Continuously Utilizing the Function
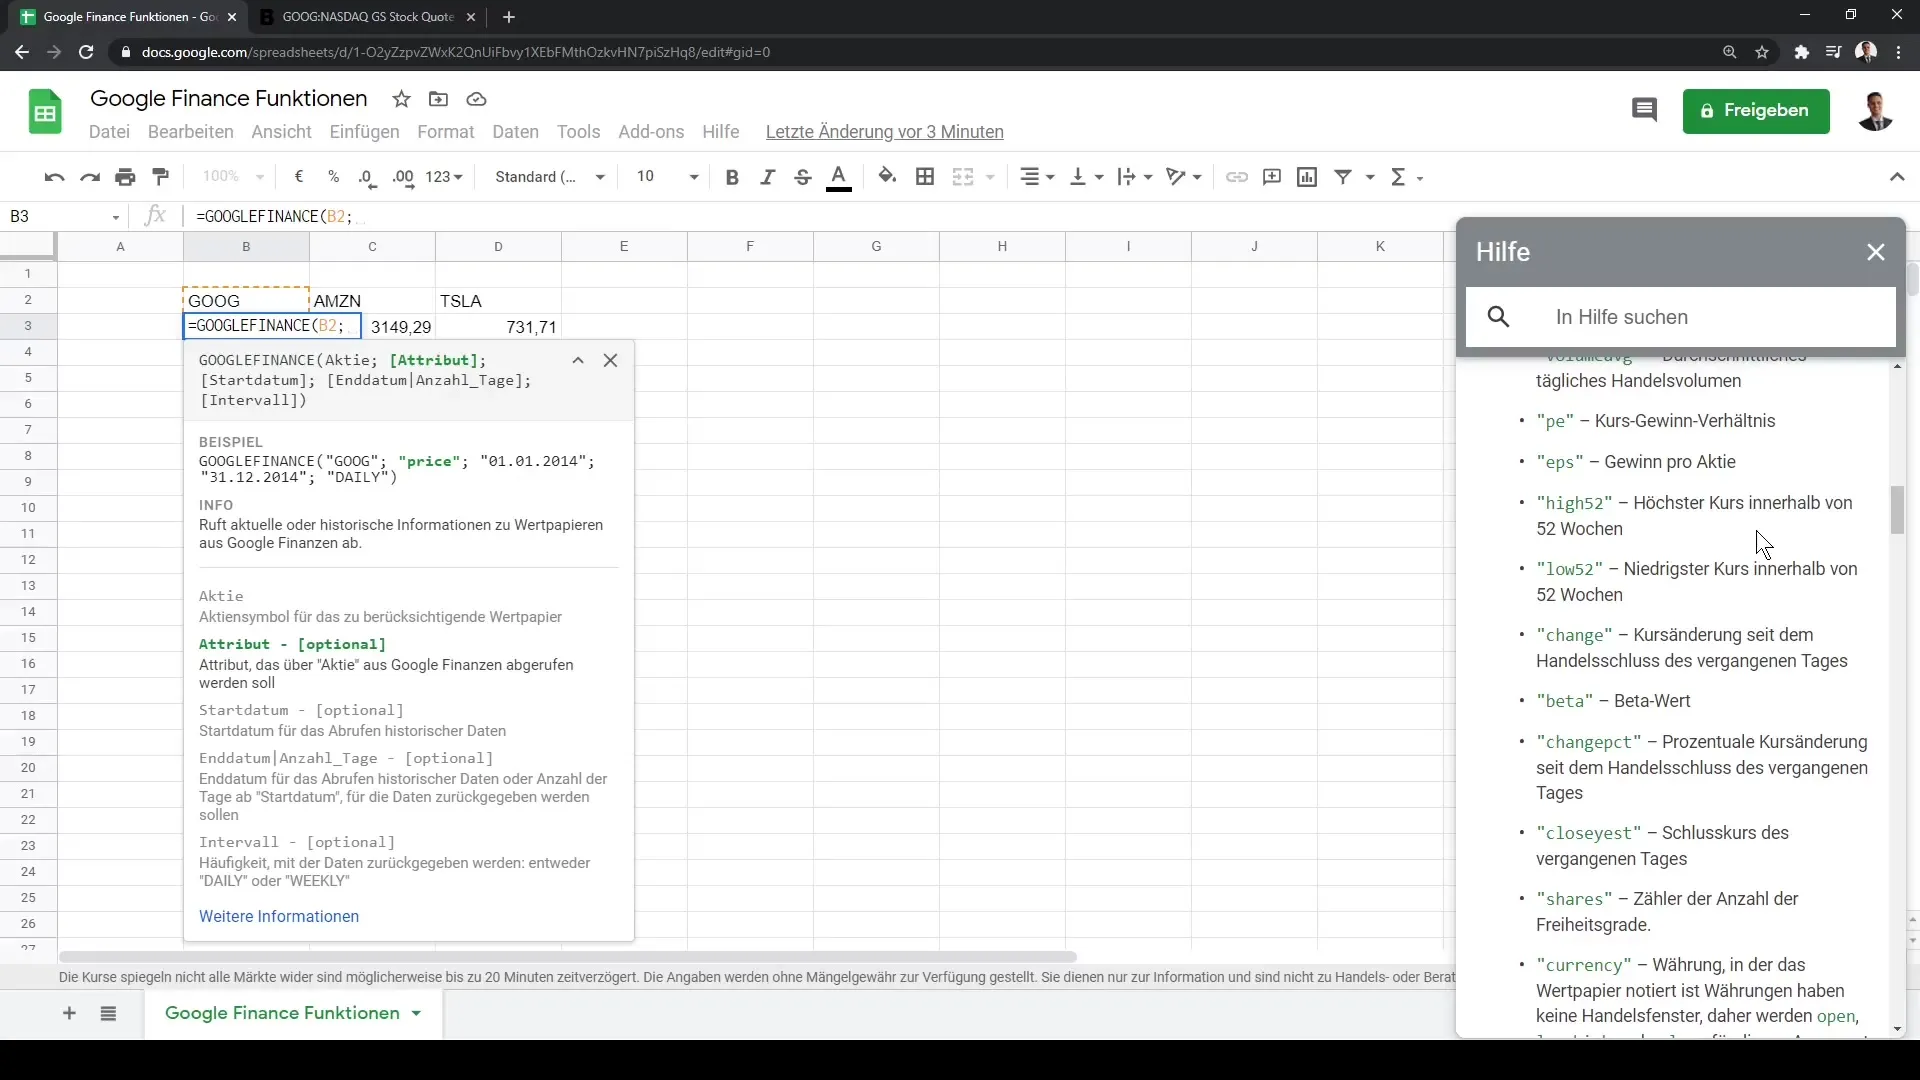
With the Google Finance function, you can continuously retrieve current data and dynamically enhance your tables without having to update them manually. This is a significant advantage compared to other programs like Microsoft Excel, where data streams are static.
Summary
In this tutorial, you have learned how to efficiently use the Google Finance function in Google Sheets to retrieve real-time and historical financial data. From querying the current stock price to graphically representing curves over time, you have become acquainted with the excellent features that Google Sheets offers in the field of financial analysis.
Frequently Asked Questions
How do I use the Google Finance function in Google Sheets?You enter the function =GOOGLEFINANCE() followed by Ticker and Attribute into a cell.
Which attributes can I query?You can use various attributes such as "price", "high", "low", "volume", and many more.
Can I query historical data?Yes, you can specify start and end dates to see historical price trends.
Are there alternatives to Google Finance in Excel?In Excel, there is a similar function, but the data is usually static and needs to be manually updated.
