In this tutorial, we will focus on the practical implementation of Pivot Tables in Excel. You will further deepen your knowledge learned in the previous lessons through a concrete practice example. The goal is to analyze the data of a hardware company that sells products such as notebooks, smartphones, and tablets. With ten clearly defined tasks, you will be guided step by step through the process, from adjusting the data foundation to performing and designing your Pivot analysis. Let's dive right in!
Main Insights
The main insights from this lesson are the steps to create a Pivot Table, the significance of the data table for Pivot Analysis, and the customization options of layout elements for an appealing presentation of results.
Step-by-Step Guide
First, you should have your dataset ready in Excel. We are working with revenue figures of a hardware company.
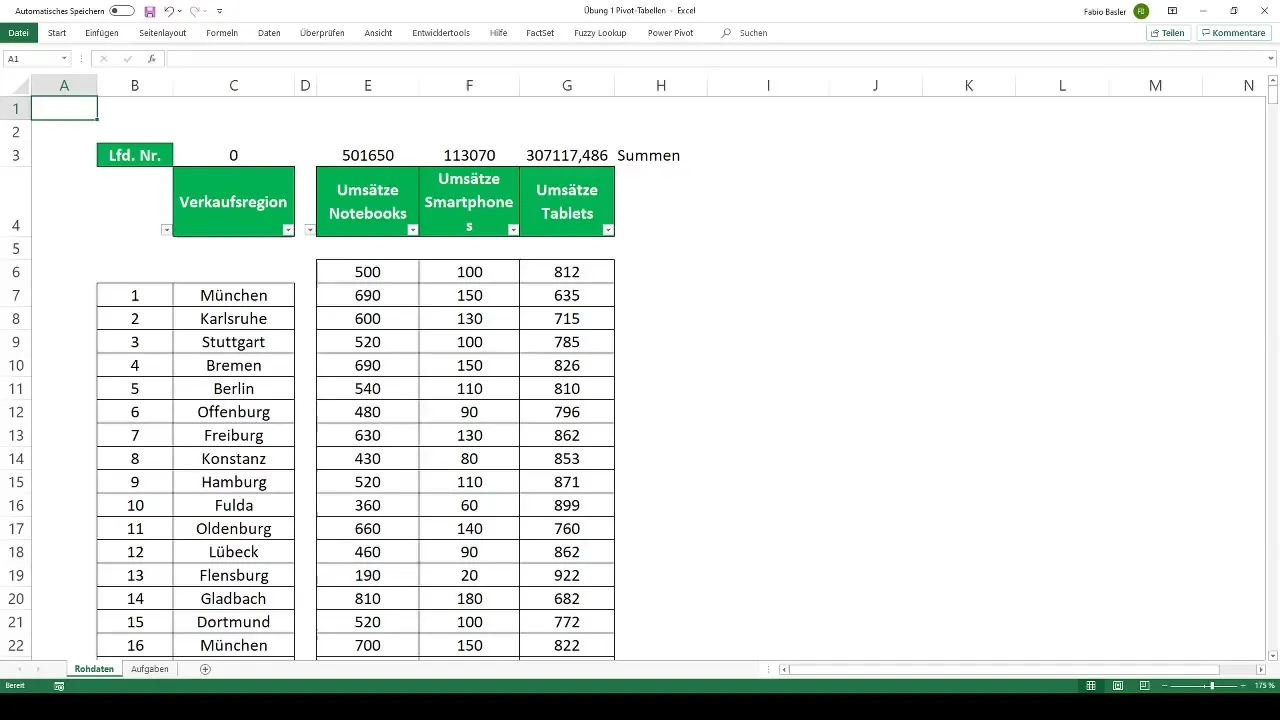
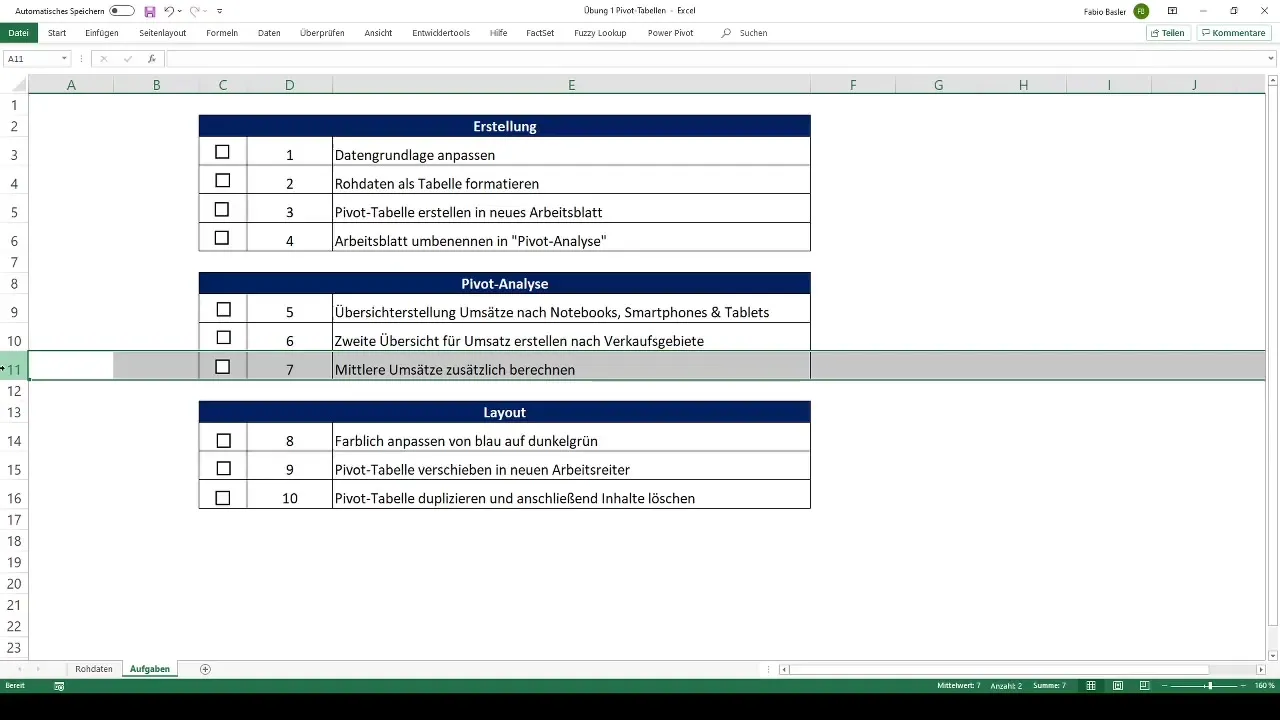
In the first step, you need to adjust the data foundation. Check if the values and data structure are suitable for creating a Pivot Table. Ensure that the column headings are correct and do not contain any empty rows.
Next, you should format the dataset as a table. This formatting is crucial as it enables Excel to work optimally with large amounts of data and facilitates the creation of the Pivot Table.
Now you will create the Pivot Table. Go to a new worksheet to ensure clarity. Click on "Insert" and then "PivotTable." Select the data table you have prepared.
Name the new worksheet with the analysis as "Pivot analysis." It is important to name the worksheets correctly to maintain clarity.
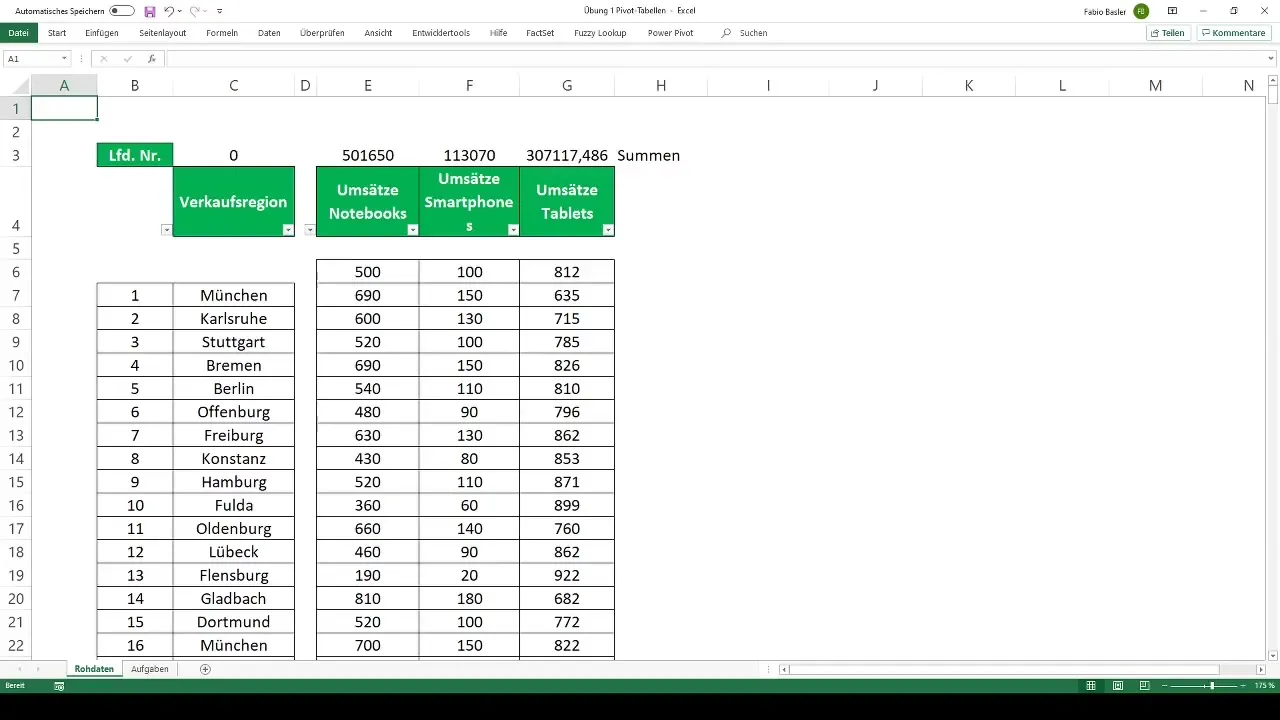
In the fifth step, you will conduct the first Pivot Analysis. You will create an overview of the revenues of individual business areas: Notebooks, Smartphones, and Tablets. Drag the relevant fields into the "Values" area and structure them sensibly.
After the first analysis comes the second. Here, the revenue is to be divided by the individual sales territories. You have the option to select different sales regions such as Berlin, Bremen, and Hamburg and display the revenues accordingly.
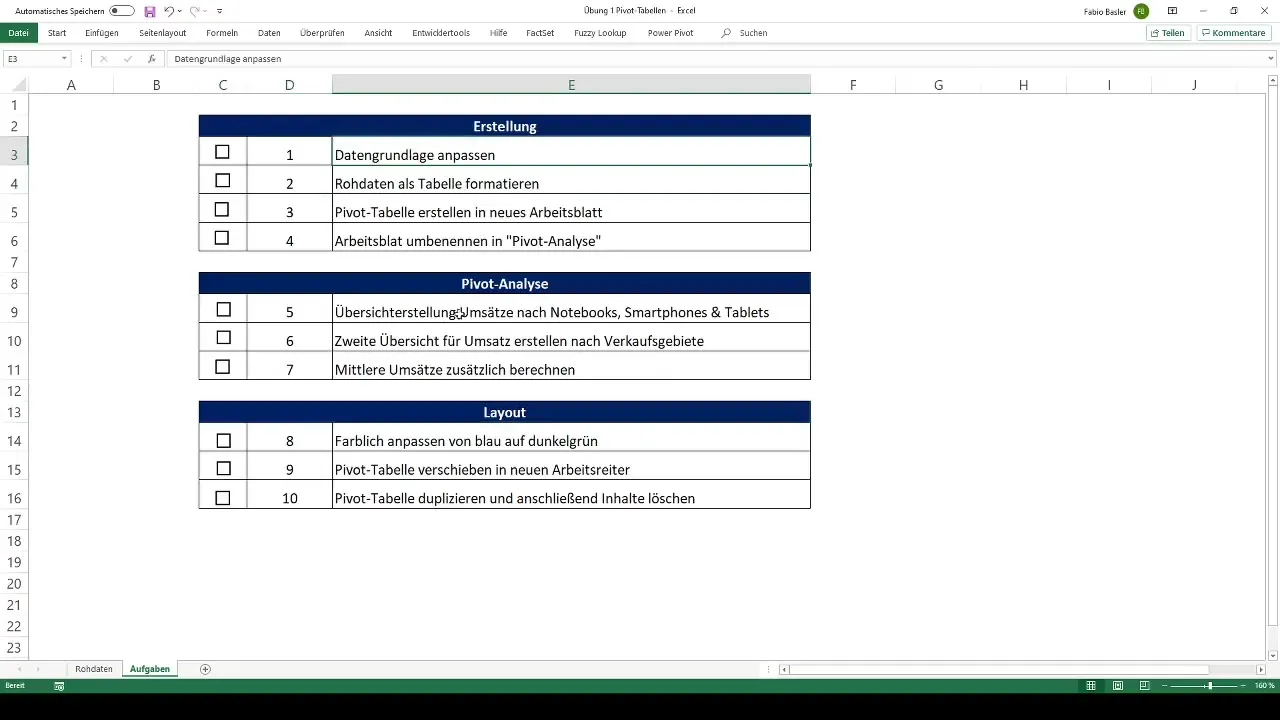
Furthermore, you will calculate the average revenues. For this, you will use a suitable Pivot formula to determine the arithmetic mean of revenues from different categories. This will give you a deep insight into sales performance.
Now it's time to customize the layout of your Pivot Table. You can change the colors – in this case from Blue to Dark Green – to make the results visually appealing.
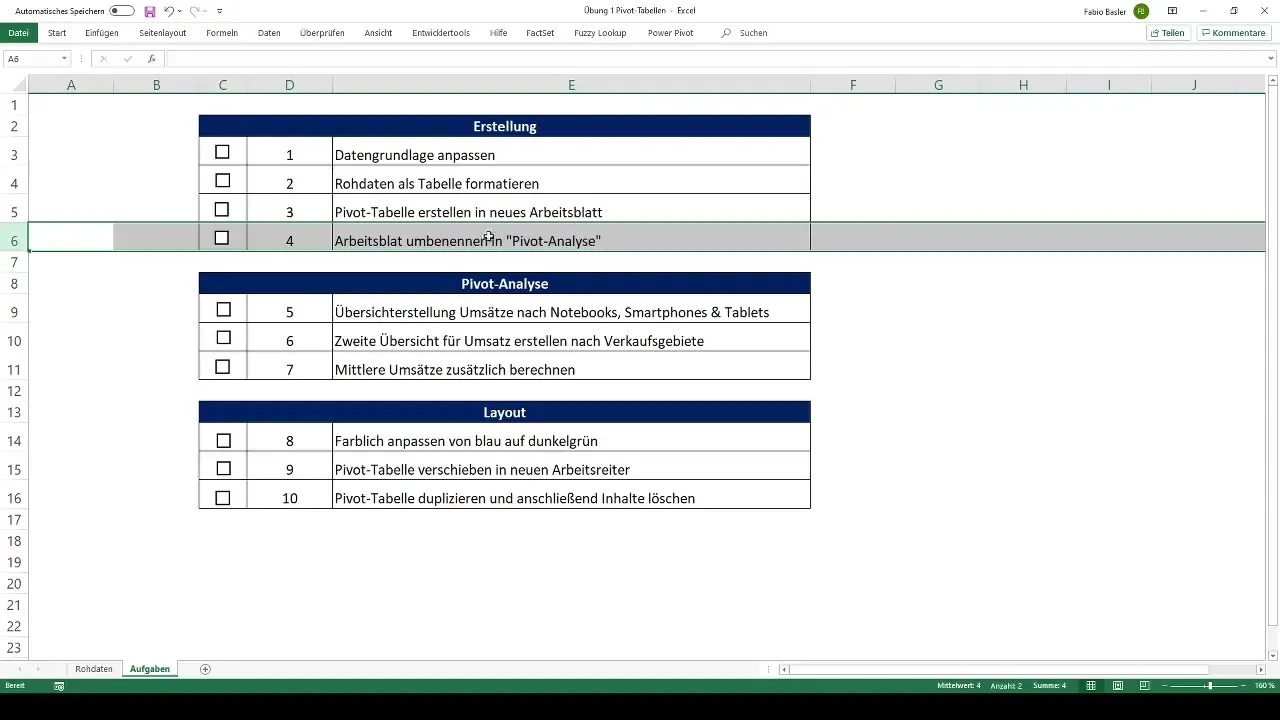
Additionally, the Pivot Table should be moved to a new worksheet. This improves the structure and avoids confusion.
In the final step, the created Pivot Table will be duplicated. The contents of the Pivot Table will then be deleted to preserve the structure for further analyses or presentations, without displaying old data.
Follow these ten tasks diligently and use the checkpoints to mark your progress. If you are unsure about a step, you can also refer to the previous theory lessons for guidance.
I encourage you to carry out these exercises independently and strengthen your knowledge in using Pivot Tables in Excel. This way, you will be well-prepared for the next lesson, where we will work together on the solutions to the tasks.
Summary
In this tutorial, you have learned how to create and customize a Pivot Table in Excel. The practical exercise imparted skills that will help you analyze data and visually present them.
Frequently Asked Questions
What are Pivot Tables?Pivot Tables are an analytical tool in Excel that allows you to condense and analyze large amounts of data.
How do I create a Pivot Table?You create a Pivot Table by Insert -> PivotTable, select your data table, and drag the desired fields into the Pivot Table.
How do I customize the layout of a Pivot Table?The layout of a Pivot Table can be customized using the design options in Excel, including colors and format.
What is the benefit of table formatting?Table formatting facilitates working with data in Excel by structured and visually appealing data organization.
Why should I delete the contents of a Pivot Table?Deleting the contents of a Pivot Table allows you to maintain the structure and reuse it for new data or analyses without showing old data.


