Pivot tables are one of the most powerful tools in Excel to analyze and summarize complex data. In this tutorial, I will show you how you can group different elements within a pivot table. Whether it's about time dimensions or custom attributes - I will guide you step by step through the various ways to efficiently organize and present your data.
Main insights
- Pivot tables allow easy grouping of data.
- Excel offers automatic groupings for time dimensions.
- You can create manual groups to form your own hierarchies.
- The order of features is crucial for data representation.
Step-by-step guide
Prepare raw data set
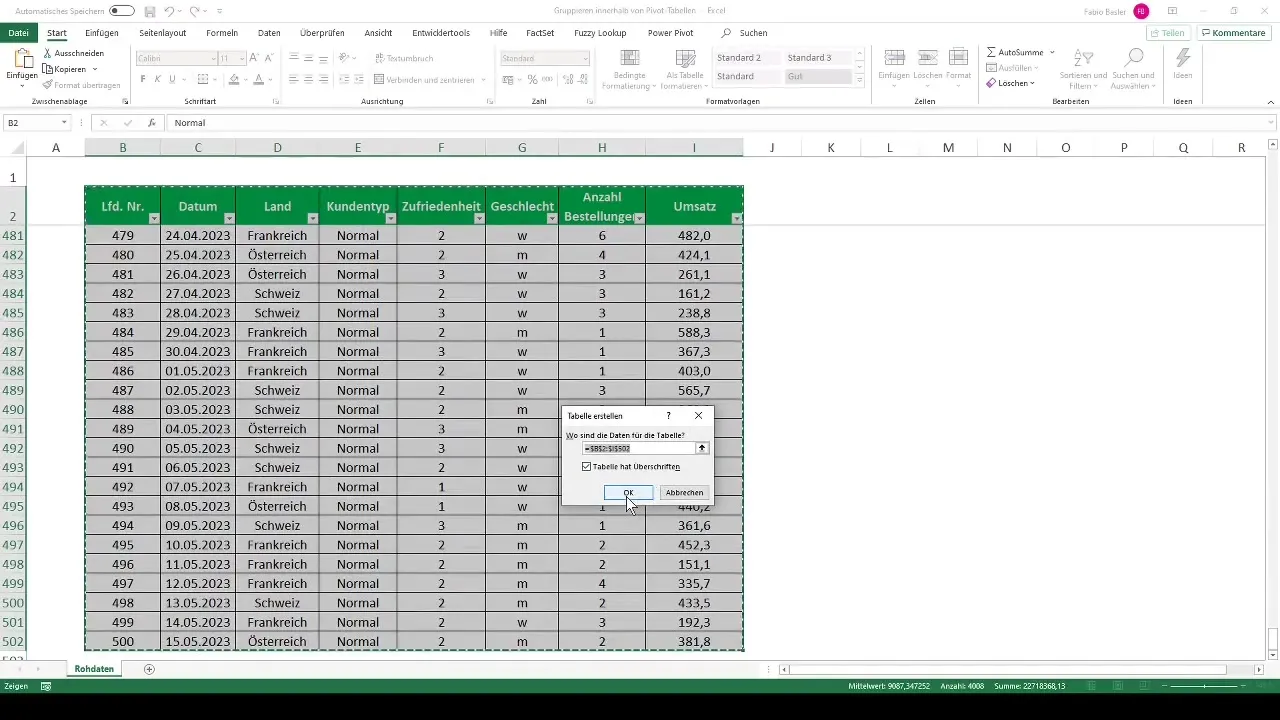
To start creating your pivot table, you first need to prepare your raw data set in Excel. Press "Ctrl + A," followed by "Ctrl + T." This formats your data set as a table, making it easier for you to work with pivot tables later on.
Create pivot table
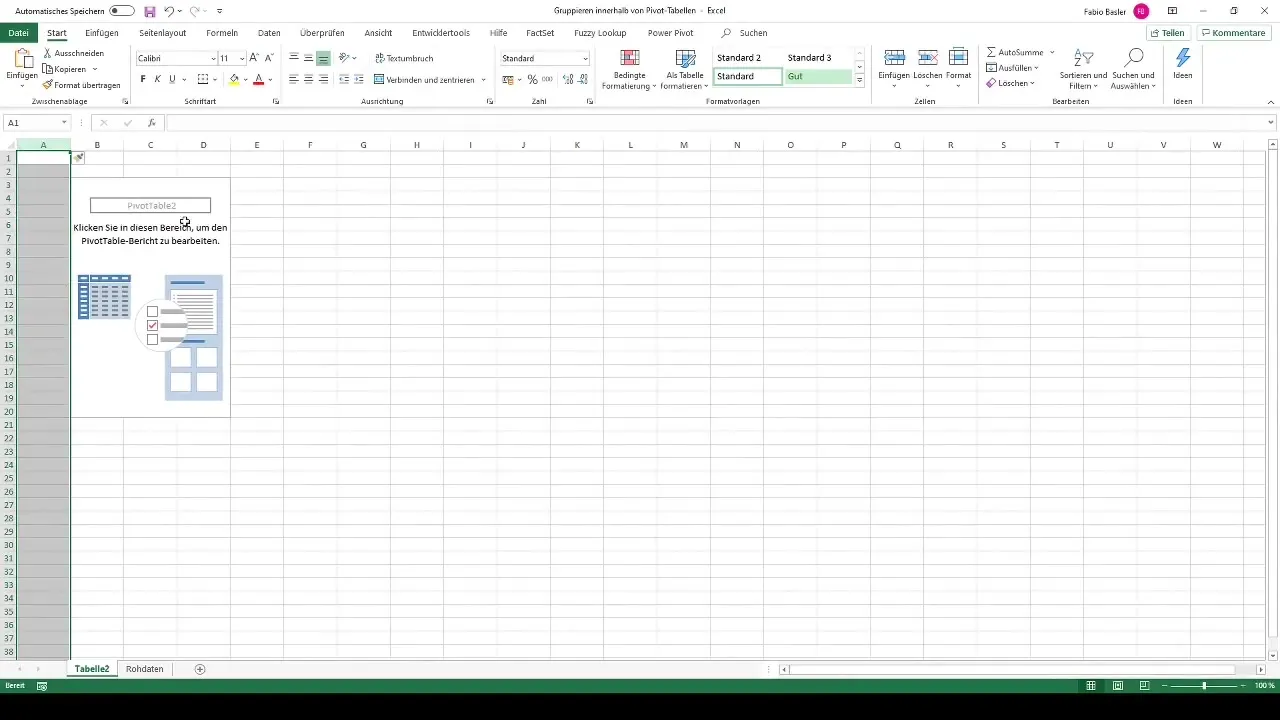
Once your table is formatted, the next step is to create a pivot table. Go to the "Insert" tab and select "PivotTable." Excel will then prompt you to export the new data to a new worksheet. Click "OK" to proceed.
Breakdown data by revenue
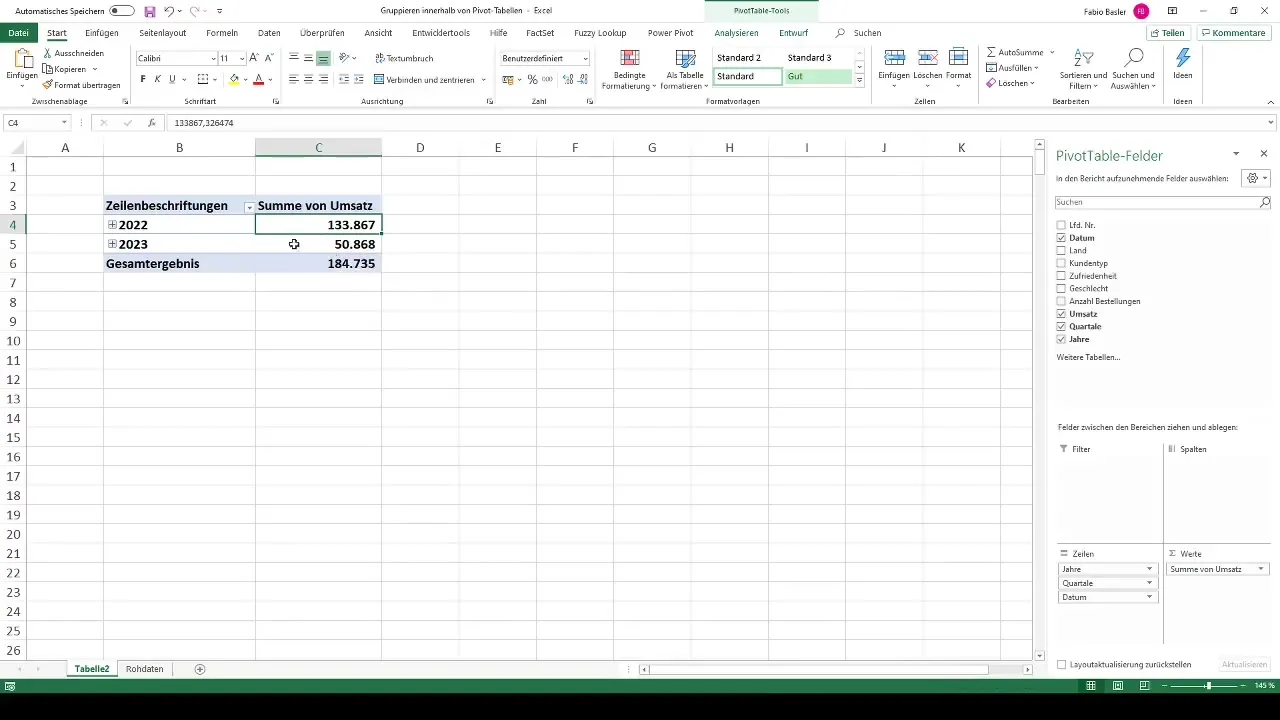
Now that the pivot table has already been created, you can generate the first overview. For example, you could break down revenue by date. When you drag the corresponding fields into the row and value areas, you will immediately see a summary of your data.
Automatic groupings of time dimensions
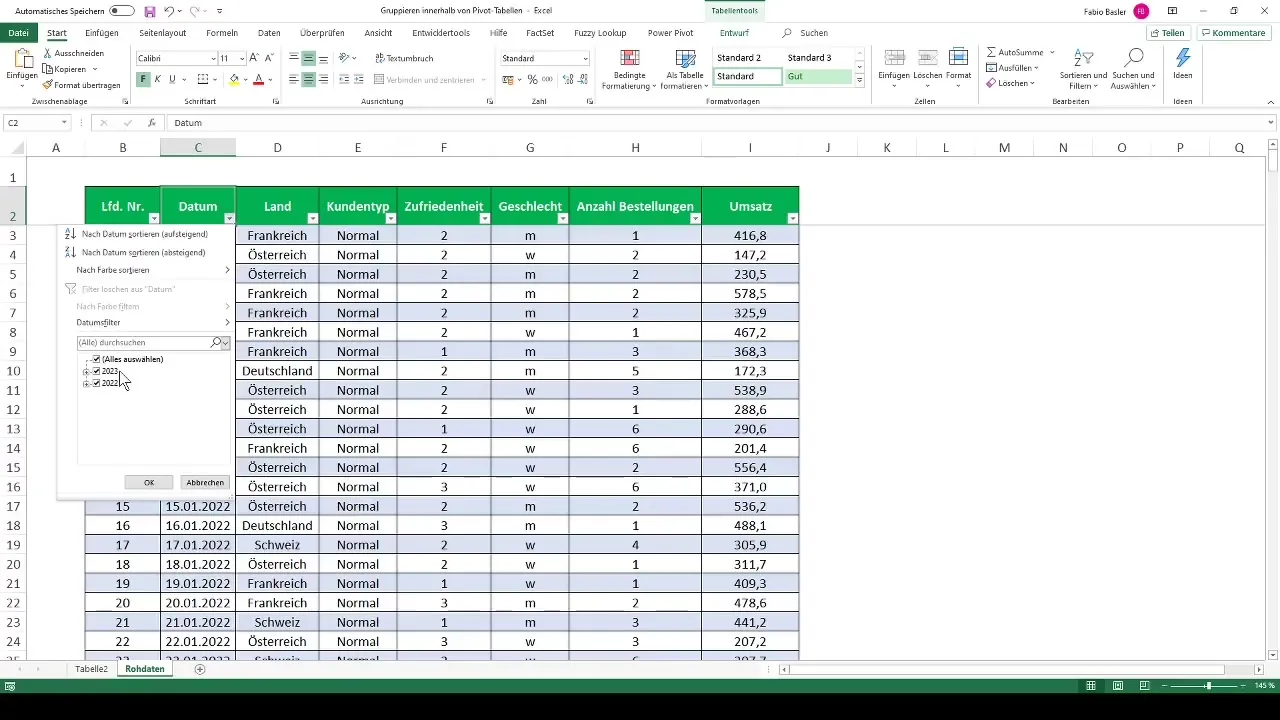
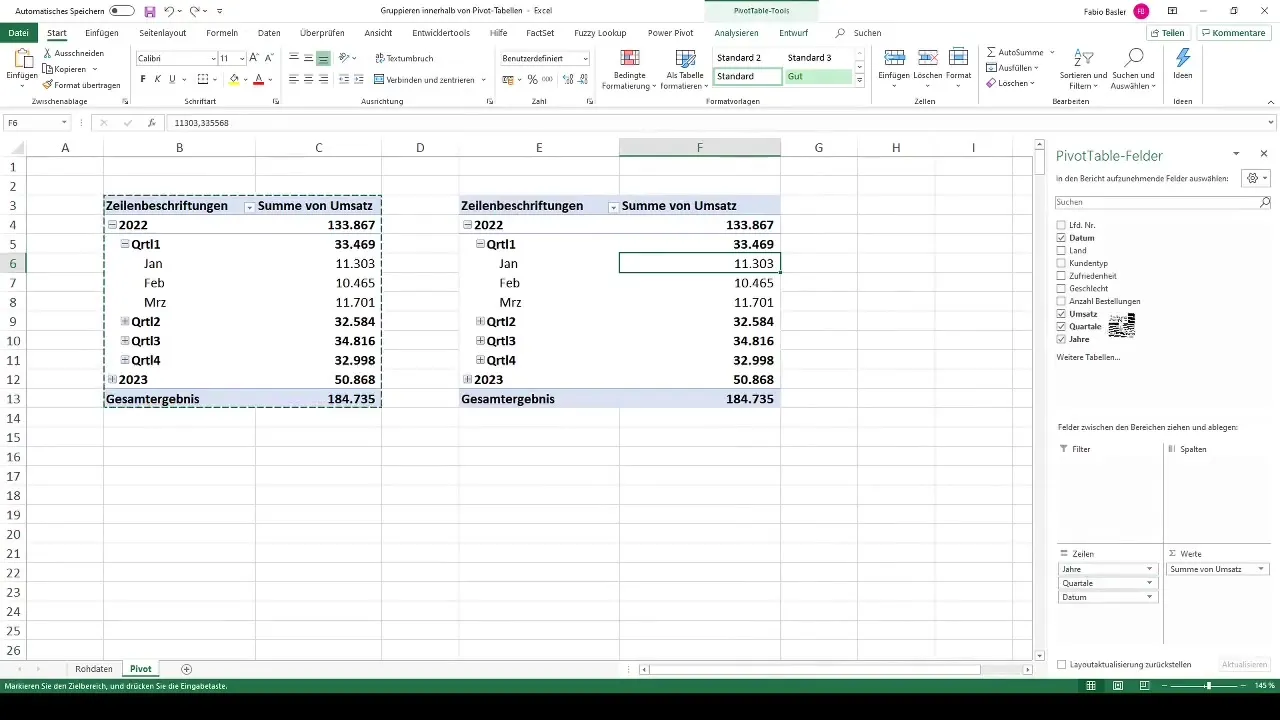
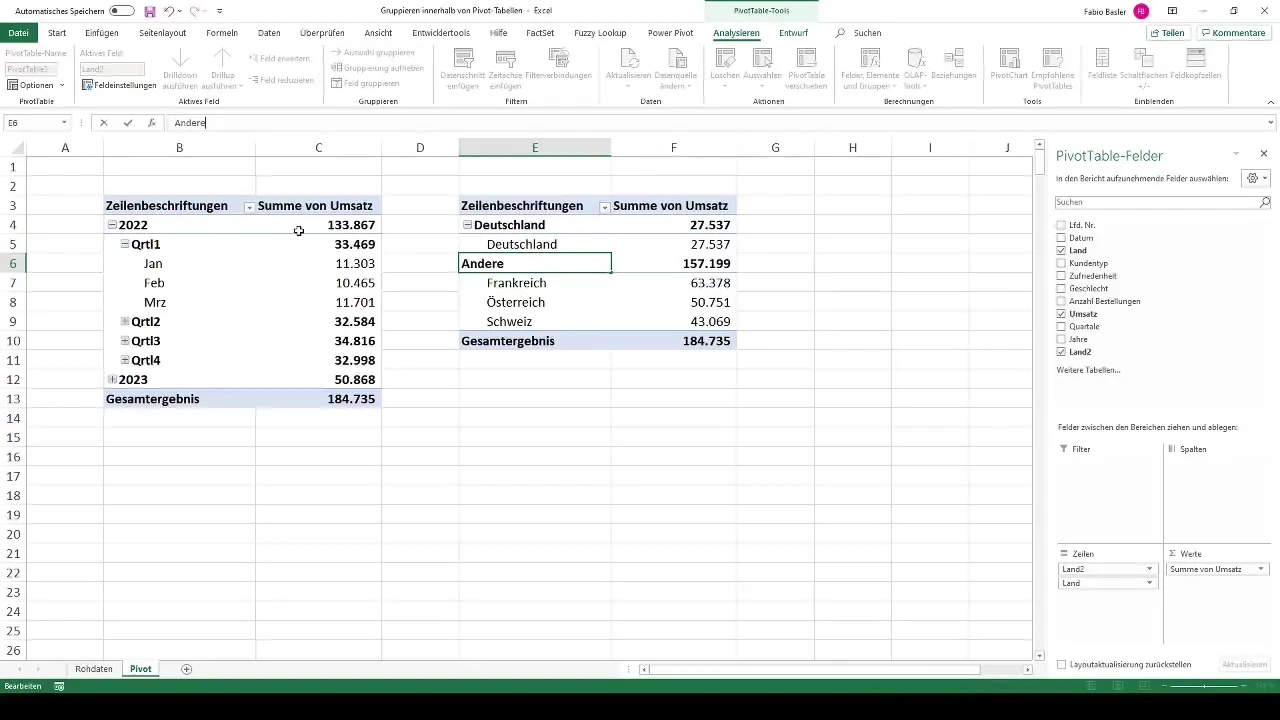
A special feature of your pivot table is the ability to automatically group by time dimensions. Excel automatically recognizes the year, quarter, and months, allowing you to use these hierarchical time dimensions directly in your table.
Create custom groups
If you want to consider custom attributes in your analysis, it is important to create a new copy of your pivot table. By pressing "Ctrl + A" and then right-clicking, you can copy the table and paste it into a new position. In this copied table, change the dimensions.
Adjust attributes
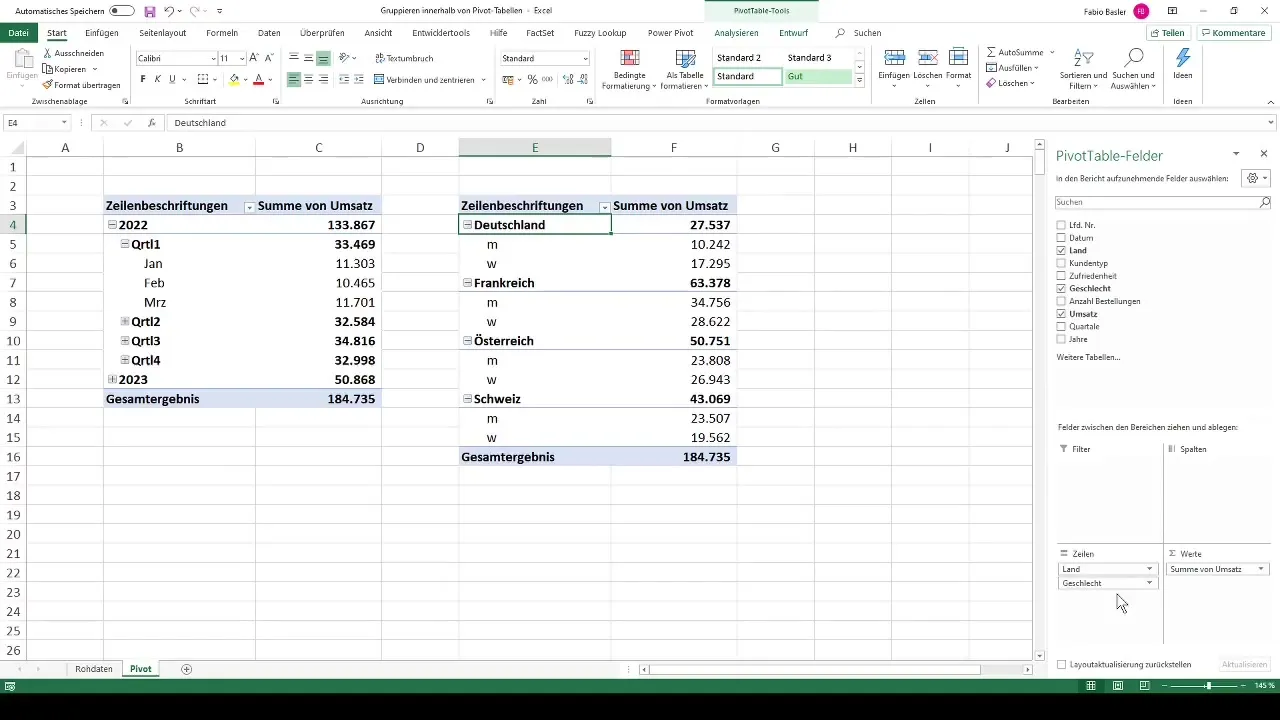
Now decide which attributes you want to see in your pivot table. For example, do you want to analyze revenues by countries and gender? Drag the corresponding fields into the row and column areas to get the desired information.
Groupings with multiple attributes
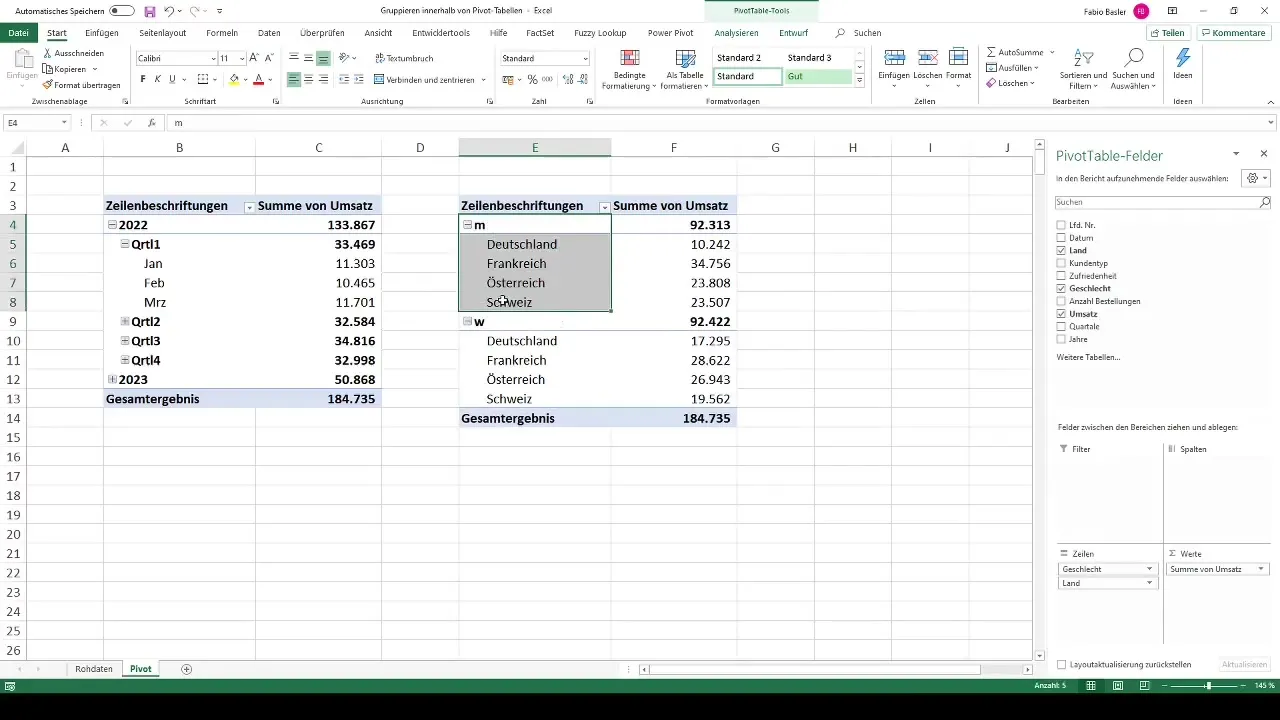
Once you have combined multiple attributes, you can change the order to present the data more clearly. Click on the attribute you want to adjust and drag it to the desired position. This way, you can display the data by gender and then by countries.
Grouping with single attribute
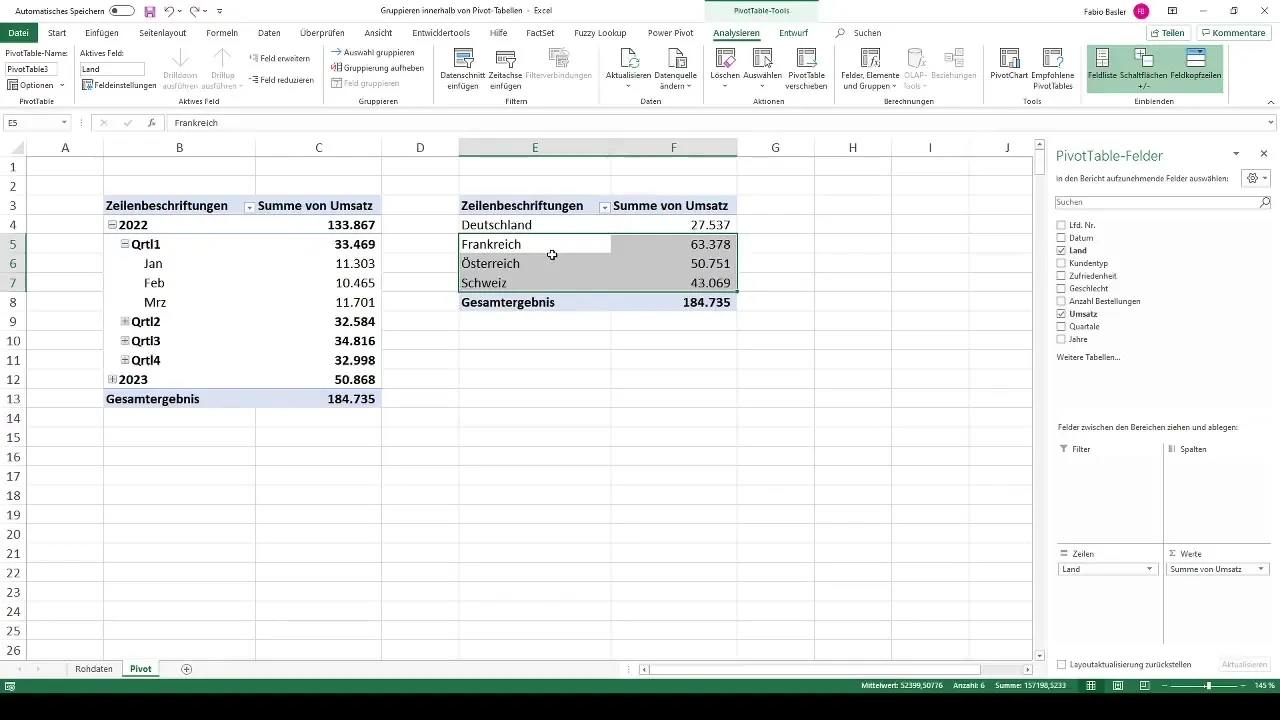
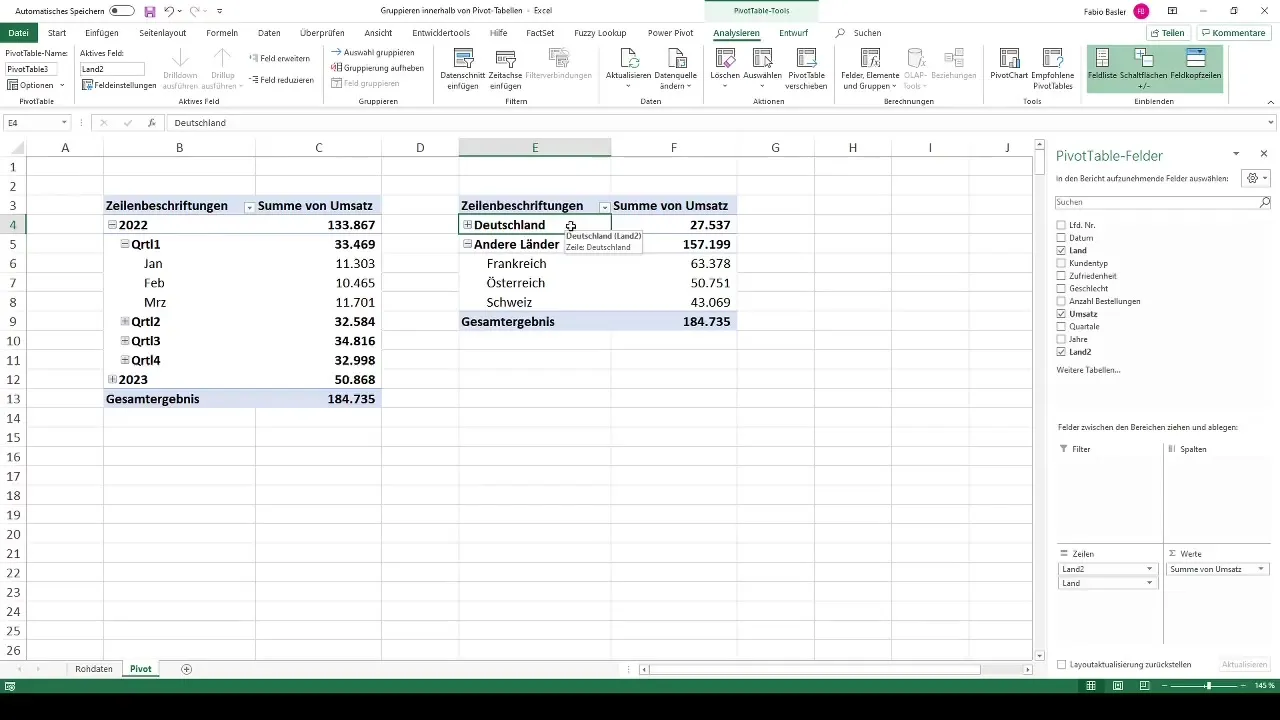
If you only have one attribute in your table, you can also group it. An easy way is to isolate the revenue for Germany and combine the other countries. Highlight the relevant countries, right-click and select "Group."
Rename groups
You are now shown a new group that you can rename to make it clearer for your analysis. For example, you could name the group of other countries "Other Countries". This renaming option ensures that your pivot table appears more organized.
Time Dimension and Manual Groupings
With the existing automatic groupings, you are often dependent on the hierarchies offered by Excel. If you want more flexibility, you can make manual groupings. This is particularly useful when you want to display multiple characteristics in random order.
Summary
In this tutorial, you have learned how to use pivot tables in Excel to efficiently group your data. You have learned the basic functions for automatically grouping time dimensions and how to manually create your own groups. With the techniques shown here, you can present your data more clearly and perform the analyses you need.
Frequently Asked Questions
How do I group data in a pivot table?You can group data by dragging the characteristics into the rows or columns area and then selecting the respective grouping option.
Can Excel automatically group time dimensions?Yes, Excel offers the ability to automatically group by year, quarter, and month.
Can I use multiple features simultaneously in a pivot table?Yes, you can combine multiple characteristics to perform detailed analyses.
How can I rename groups in a pivot table?Select the grouped elements, right-click, and choose "Rename".
Where can I find the grouping option for individual characteristics?You can find the grouping option in the PivotTable Tools under "Analyze" or "Options".


