When working with data, it is crucial to analyze and prepare it efficiently. With Power BI, you can create powerful and interactive reports that help you gain important insights from your data. In this guide, I will explain step by step how to start using Power BI and how to import and analyze data from various sources.
Key Insights
- Power BI offers versatile import options from Excel and other data sources.
- You can build and analyze relationships between data models.
- Creating dashboards and visualizing them is essential for reporting.
Step-by-Step Guide
1. Download and Install Power BI
To get started with Power BI, download the software. Simply open your web browser and search for "Power BI Download". Visit the official Microsoft page and download the desktop version, as it is best suited for most enterprise applications.
2. Import Data from Excel
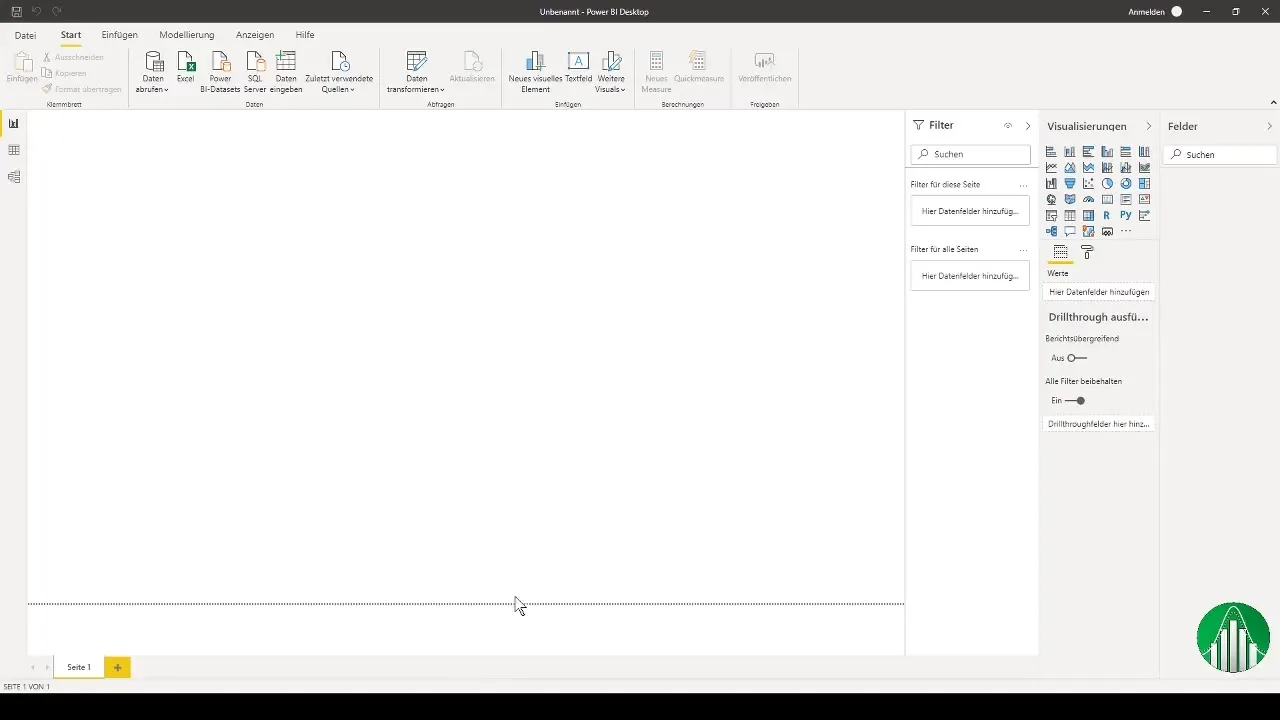
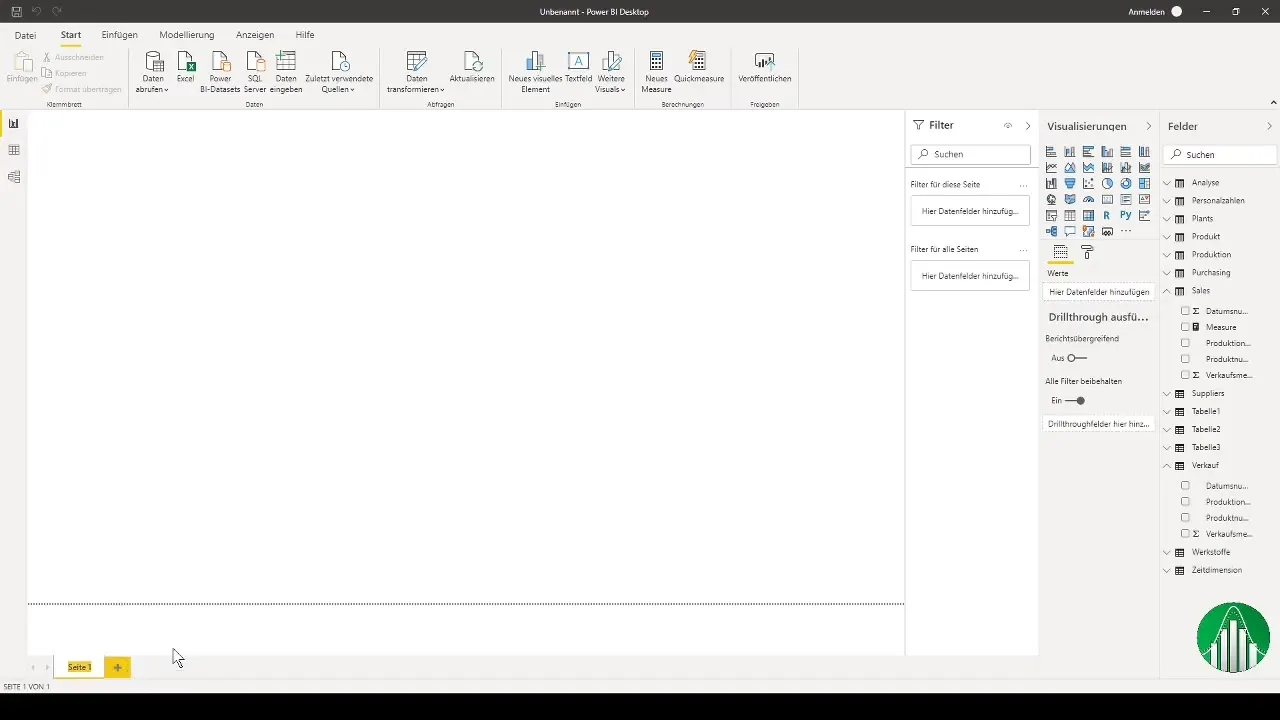
After installation, start Power BI. You will now see a blank workspace. To import your data, click on "Get Data" and select "Excel Data". Here you can choose the Excel file containing your sales figures. Check the preview to ensure all necessary columns are loaded correctly.
3. Add More Data Sources
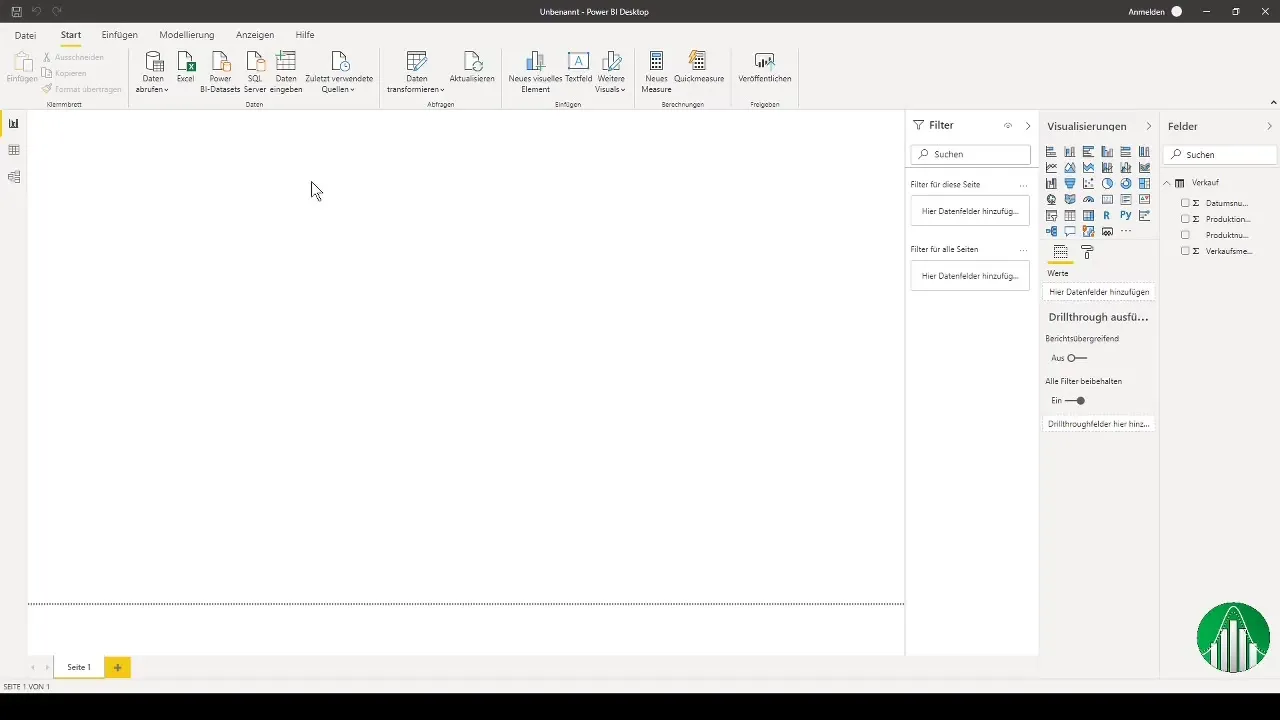
After importing the sales data, you can add more data sources. Again, choose "Get Data" to integrate additional Excel sheets, CSV files, or databases. For example, you can import production numbers from another Excel file and personnel data from a CSV file.
4. Check Data Connections
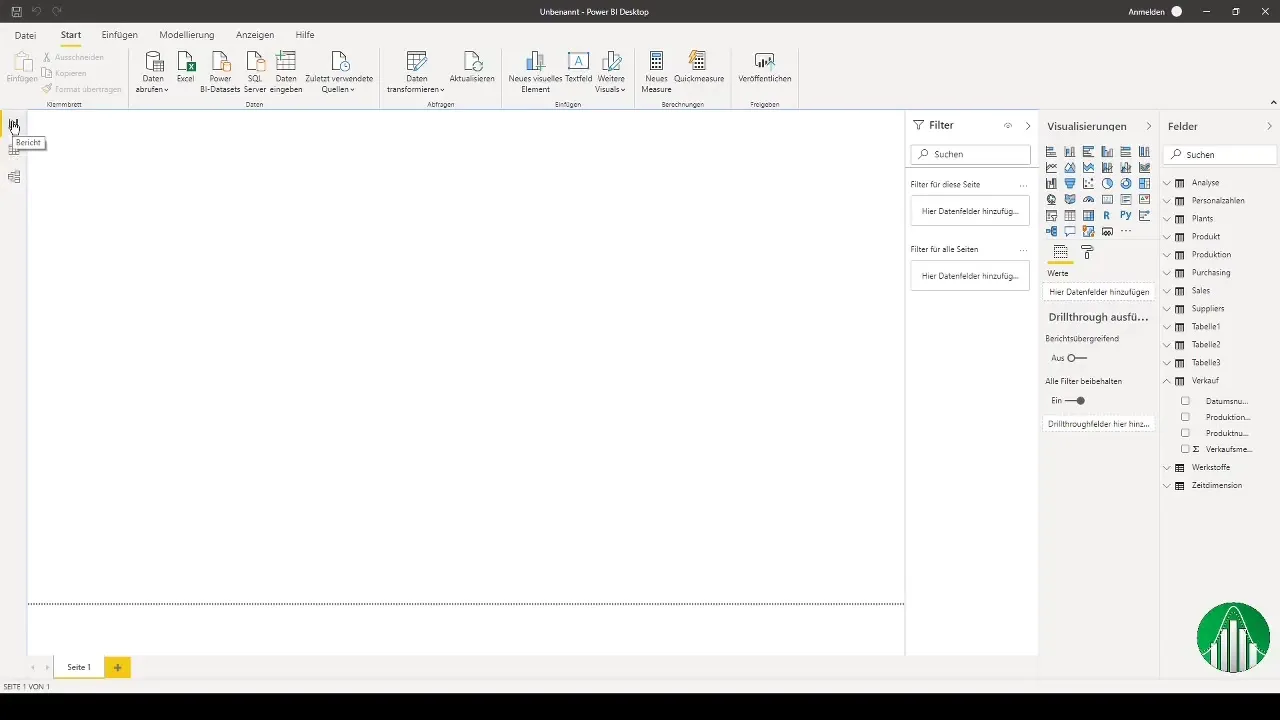
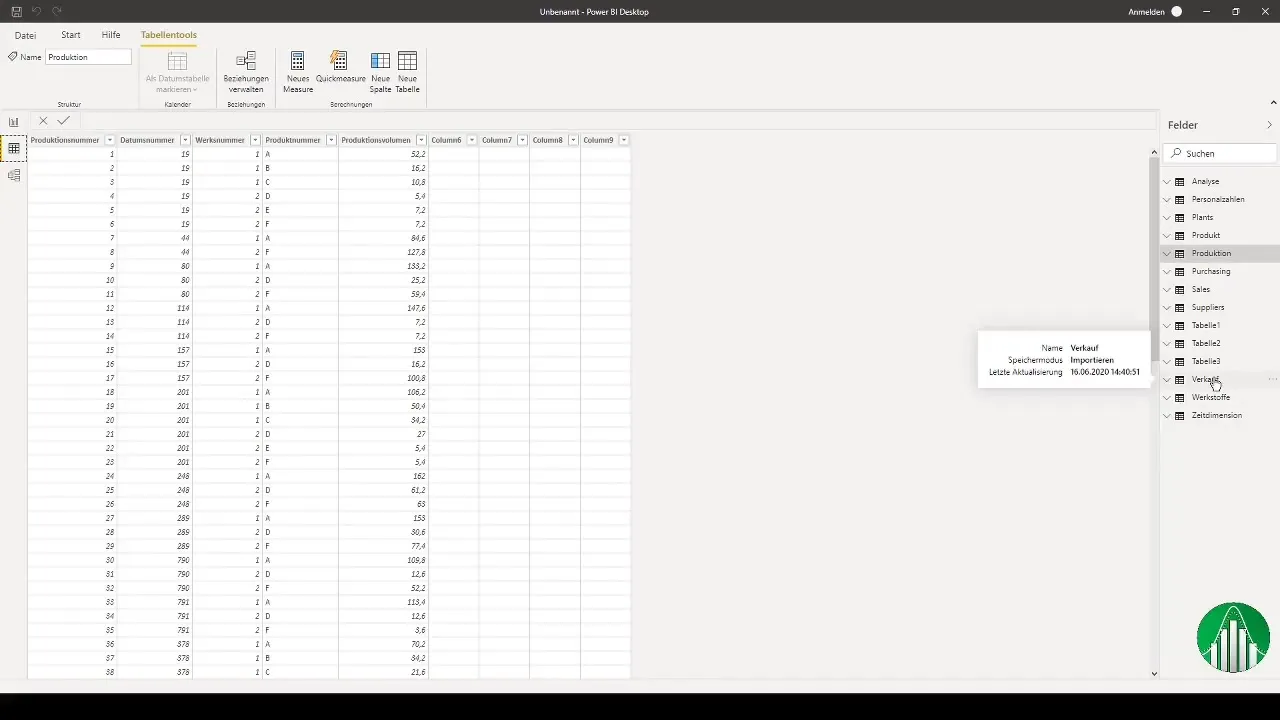
With the successful data import, you will see various icons for reports, data, and modeling on the left side of Power BI. Click on the data view to display the imported tables. Check the relationships between the tables – Power BI detects these automatically. If not, you can manage the relationships manually.
5. Establish Relationships Between Tables
If you find that some relationships are missing or incorrect, you can easily create them. Go to the modeling view and click on "New". Choose the dimension you want to connect and drag a connection to the corresponding table. This ensures that analyses across different dimensions are meaningful.
6. Create Measures
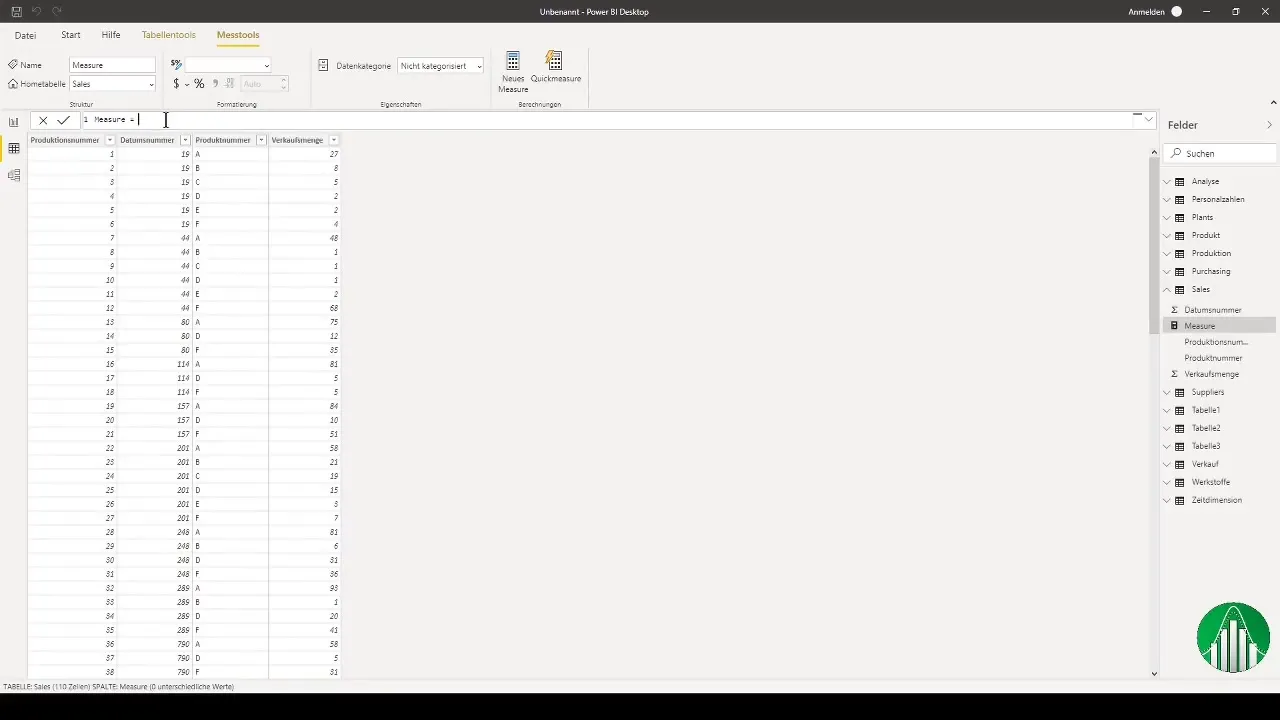
In Power BI, you can create measures similar to Excel. Go to the table where you have the sales figures and select "New Measure". Write the DAX formula for your measure, such as the sum of sales quantity multiplied by the sales price. Once you enter the formula, it will be saved automatically and available immediately.
7. Dashboard Creation
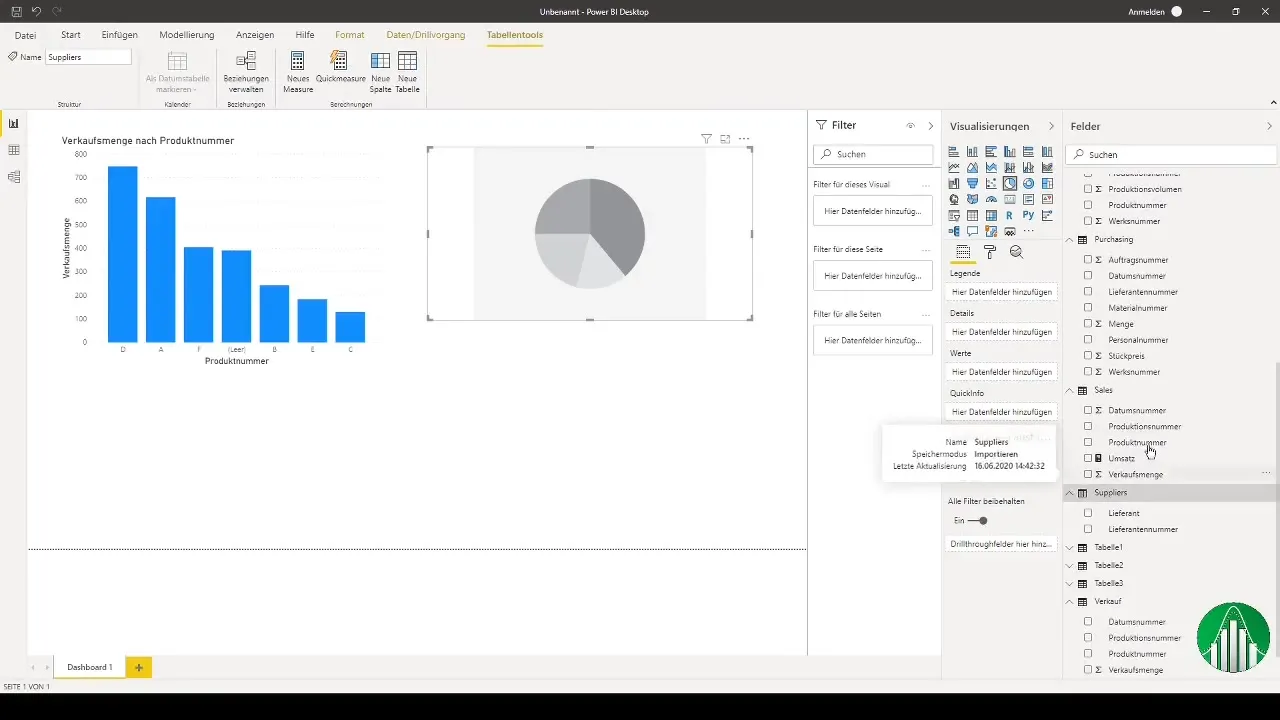
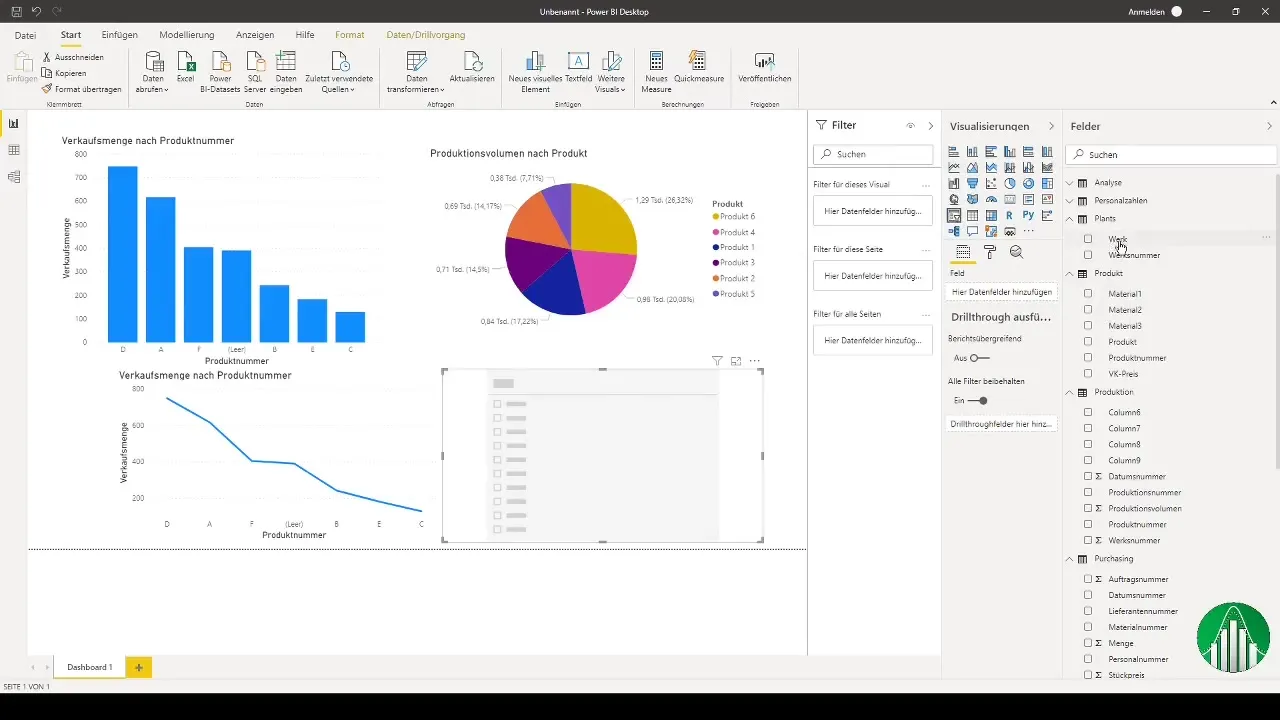
To visually present your data, click on the report tab and create your initial visualizations. Start with a simple bar chart by dragging your measures into the values. You can adjust the dimensions for the axes to represent different time periods, such as quarters or months.
8. Utilize Diverse Visualizations
Power BI offers many visualization options – from bar charts to pie charts to maps. Experiment with different chart types to extract the best insights from your data. Each chart type can help you view your data from a new perspective.
9. Create Interactive Dashboards
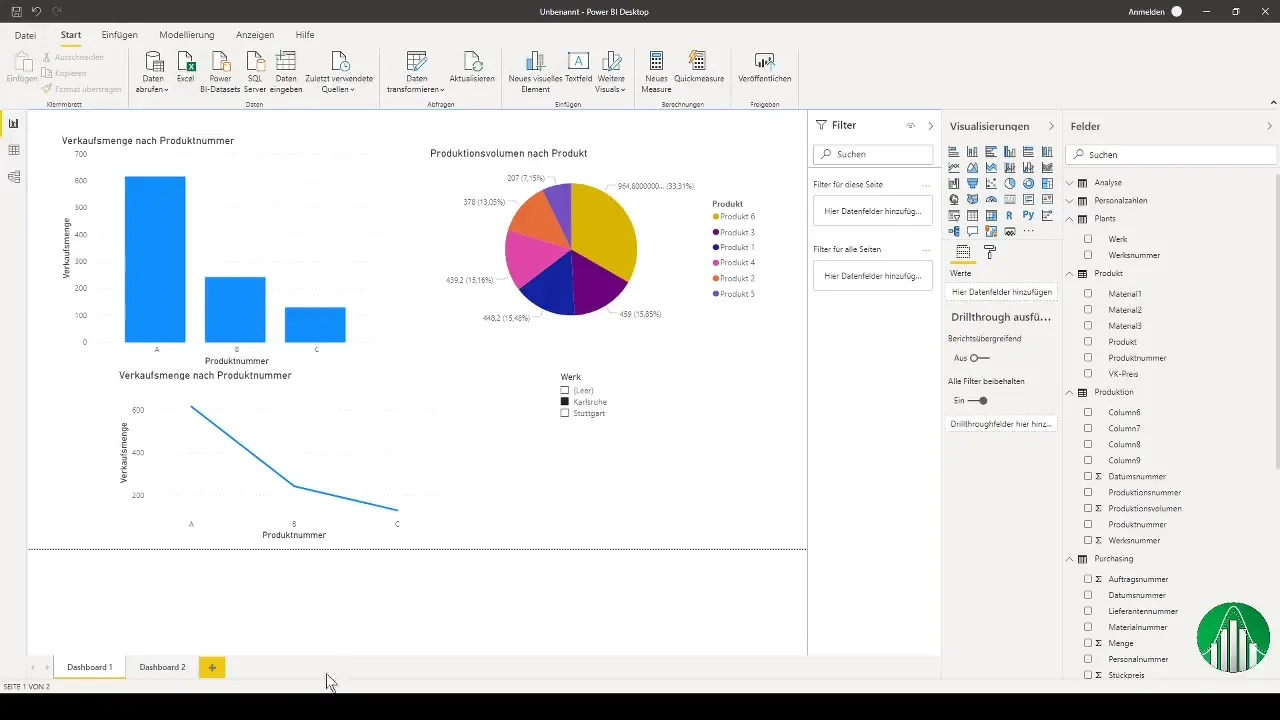
Use the interactivity of Power BI to make your dashboards dynamic. Add slicers to select specific data points and update the charts accordingly. This makes the analysis particularly user-friendly and clear.
10. Data Refresh and Linking to Excel
It is important that your Power BI dashboards contain up-to-date data. Make sure that the links to the Excel files are correct. If the path of your data source changes, you need to update the links in Power BI to ensure that your reports continue to function reliably.
Summary
In this guide, you have learned how to start with Power BI, import data, establish relationships between tables, and create meaningful dashboards. The tool offers you flexible ways to analyze and present your data, saving you considerable time and effort in your daily work as a controller.
