With Pivot Tables in Excel, you can quickly and precisely extract answers from large data sets. One of the most impressive features that Pivot Tables offer is the ability to add slicers. These provide a user-friendly way to filter data and replace static filter options with dynamic, visual elements. In this guide, I will show you step by step how to add slicers to your Pivot Tables to make your reports even more visual and flexible.
Main Insights
- Slicers allow for a visual and user-friendly filtering of data in Pivot Tables.
- A well-formatted table makes it easier to create Pivot Tables.
- By using Slicers, you can dynamically link multiple Pivot Tables together.
Step-by-Step Guide
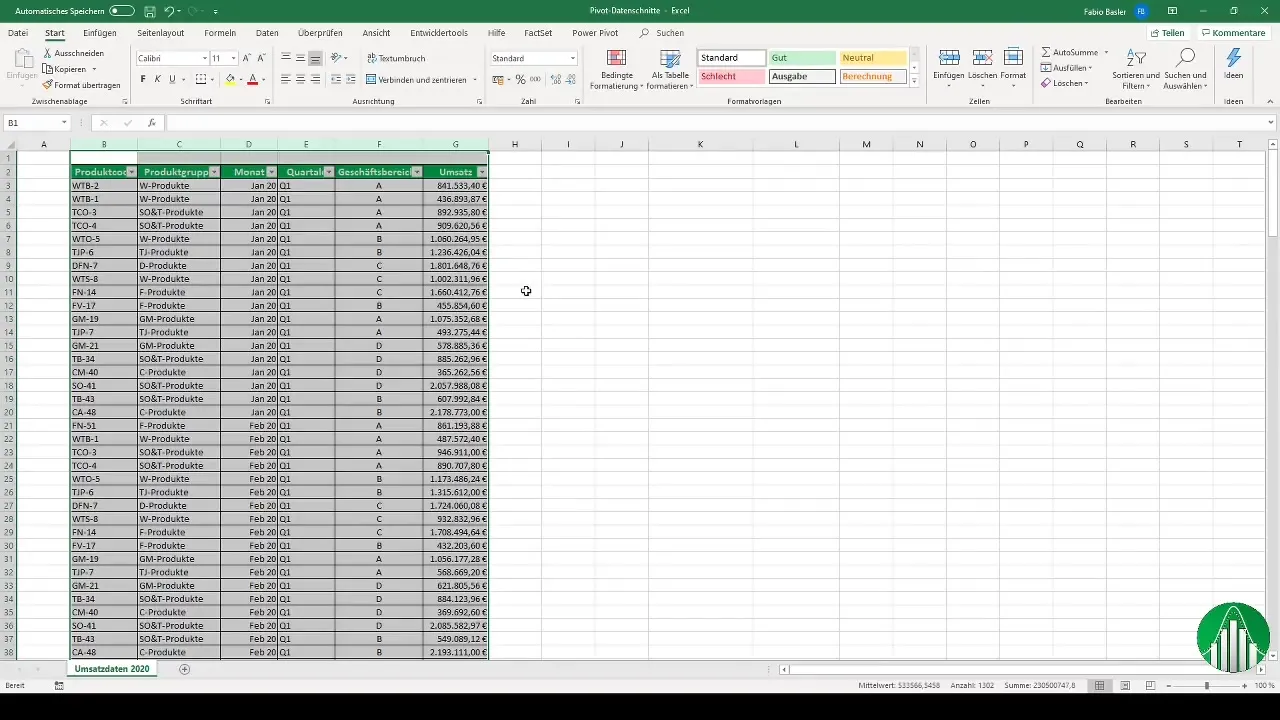
1. Format data into a table Before working with Pivot Tables, it's important to format your data into a table. This ensures that Excel will recognize new data automatically when added. To format your data as a table, select all relevant cells and press the shortcut Ctrl + T. Confirm that the first row contains the headers and click "OK".
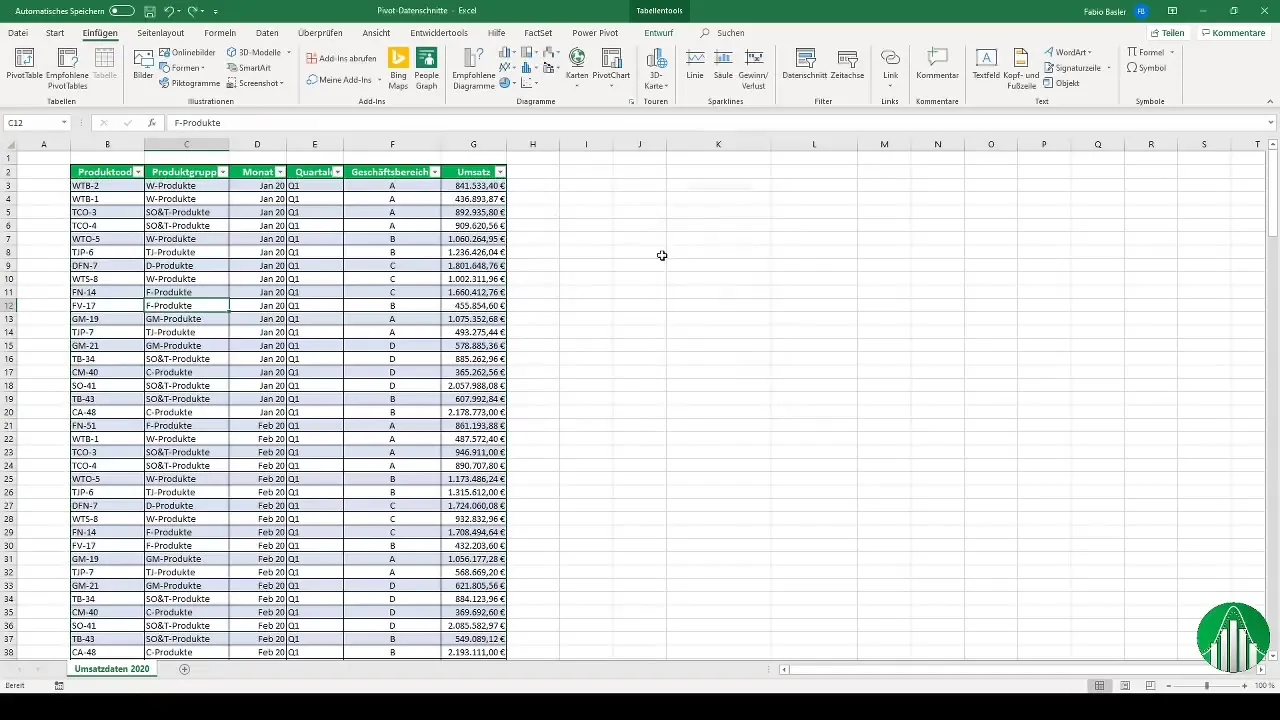
2. Create a Pivot Table After formatting the table, you can create a Pivot Table. Click within the table and go to "Insert" and select "PivotTable". Choose whether you want to insert the Pivot Table in a new worksheet or the same one, and click "OK".
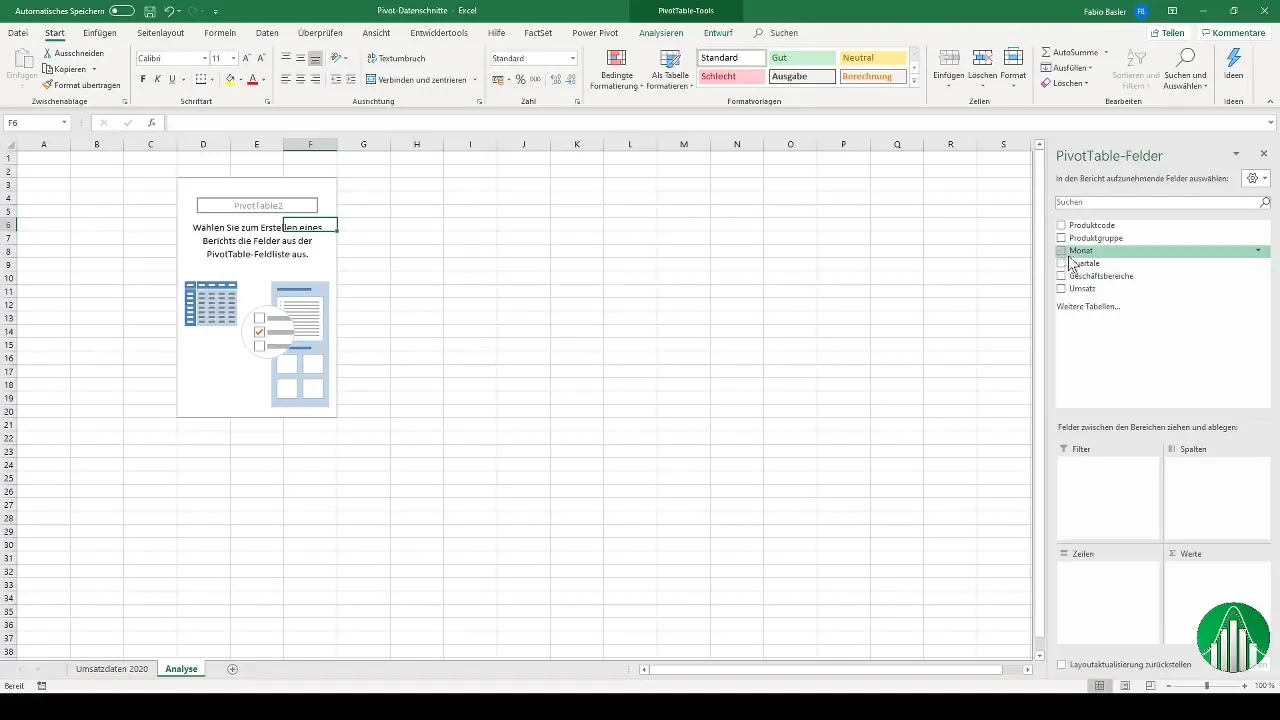
3. Drag data into the Pivot Table Now you have the option to drag the relevant data fields into the rows and columns areas of the Pivot Table. Start by placing the months in the rows field. Add the business areas to the columns fields to get a structured overview.
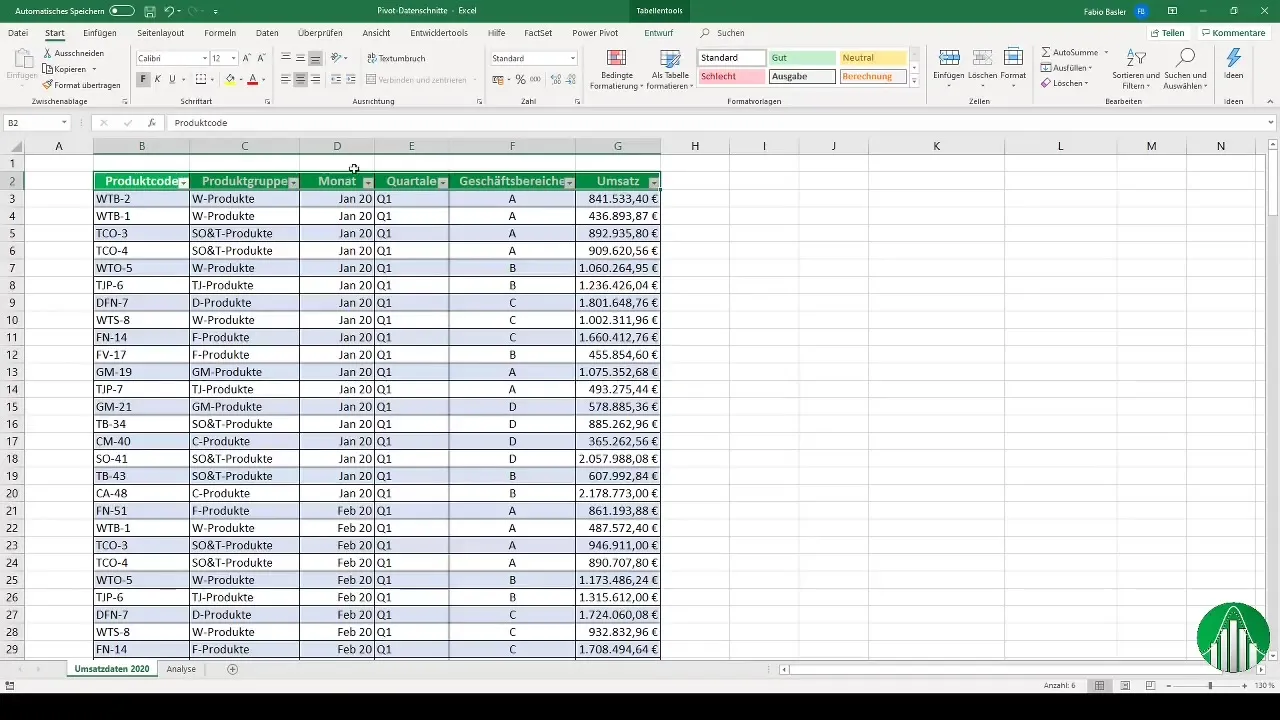
4. Add filters To make the Pivot Table more effective, you can add filters. A practical method is to use the shortcut key Ctrl + Shift + L, which allows you to add filters. Select the appropriate column headers to activate the filters.
5. Adjust layout To ensure that your Pivot Table remains clear and organized, you need to adjust the layout. Right-click on the Pivot Table and navigate to "PivotTable Options" to adjust the column widths. Disable the option for columns to be automatically adjusted.
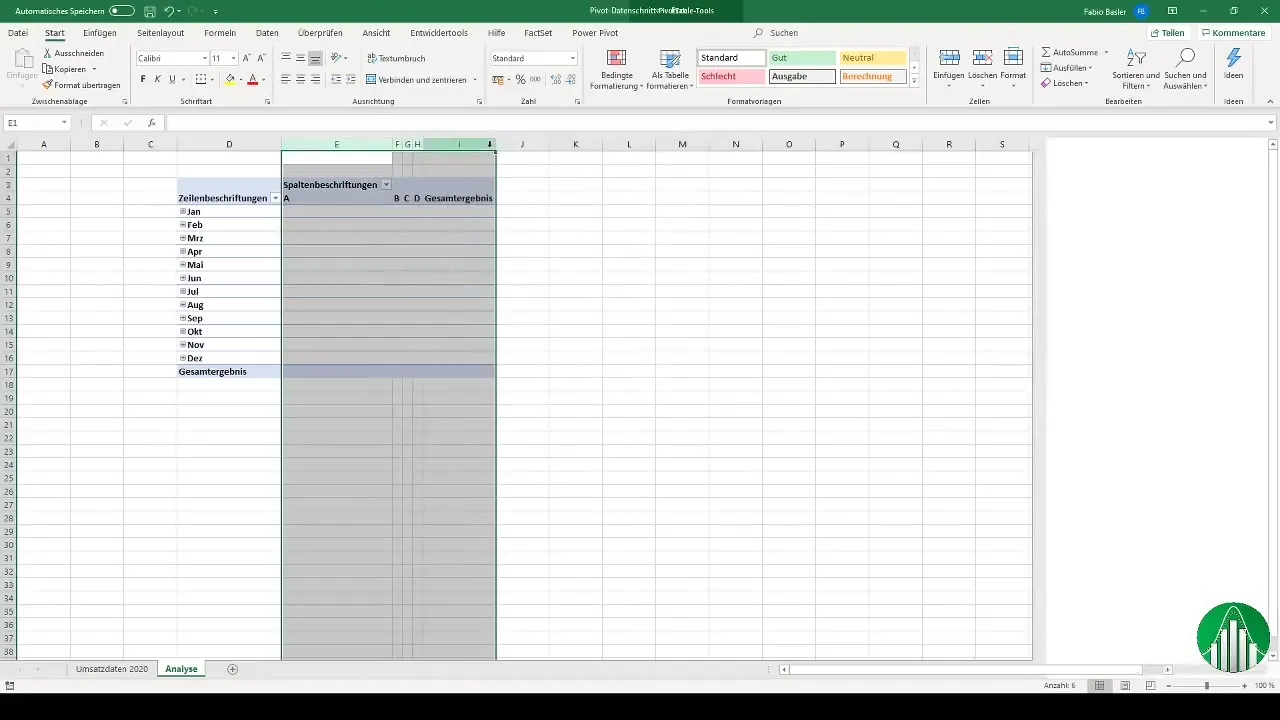
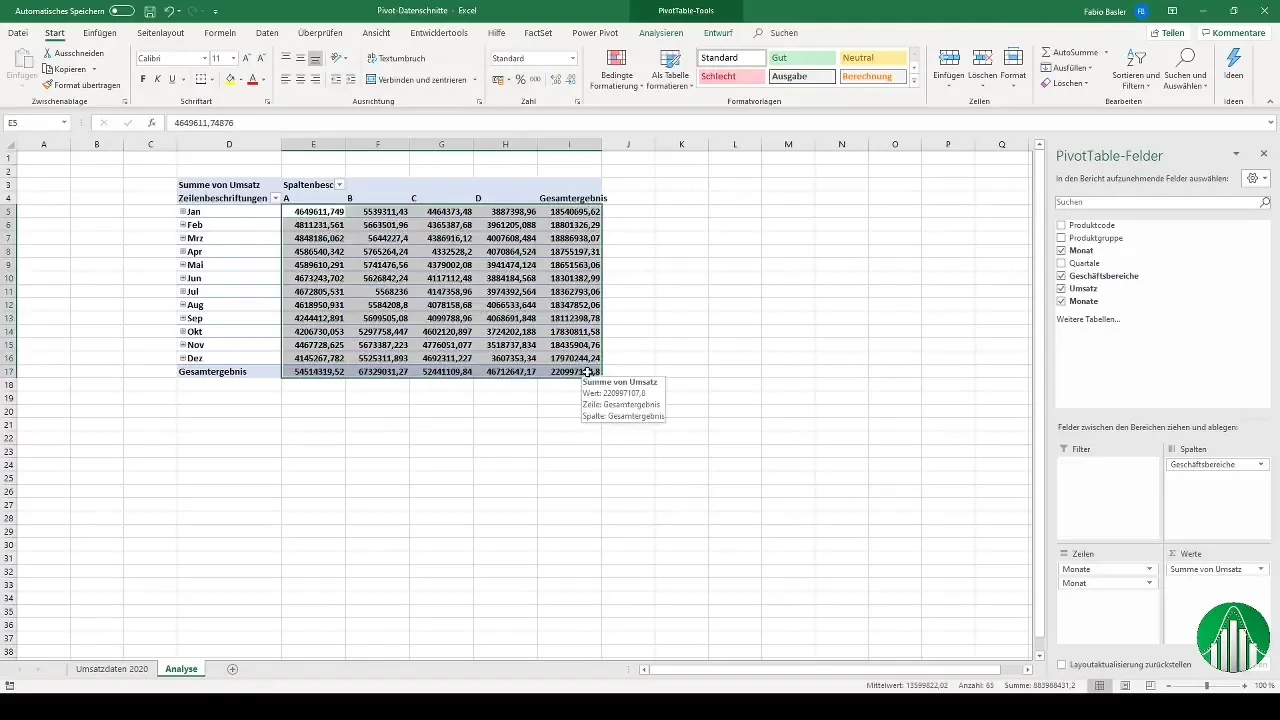
6. Add sales values To further enhance clarity, add the sales values to your Pivot Table. You can drag these into the value area of the Pivot Table. Ensure the numbers are formatted and activate thousand separators if needed.
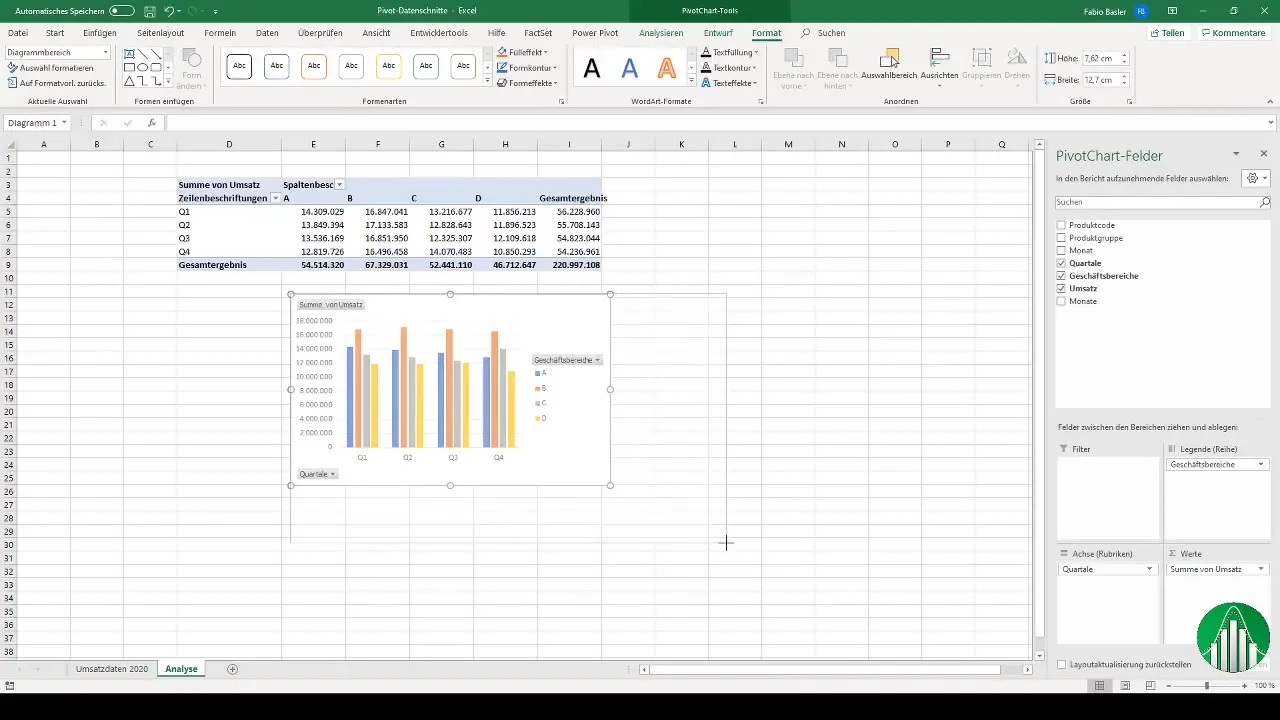
7. Create a PivotChart To visually represent your data, choose an appropriate chart type through the "PivotChart" menu. Here, you can select whether you prefer a bar chart or other types, for example.
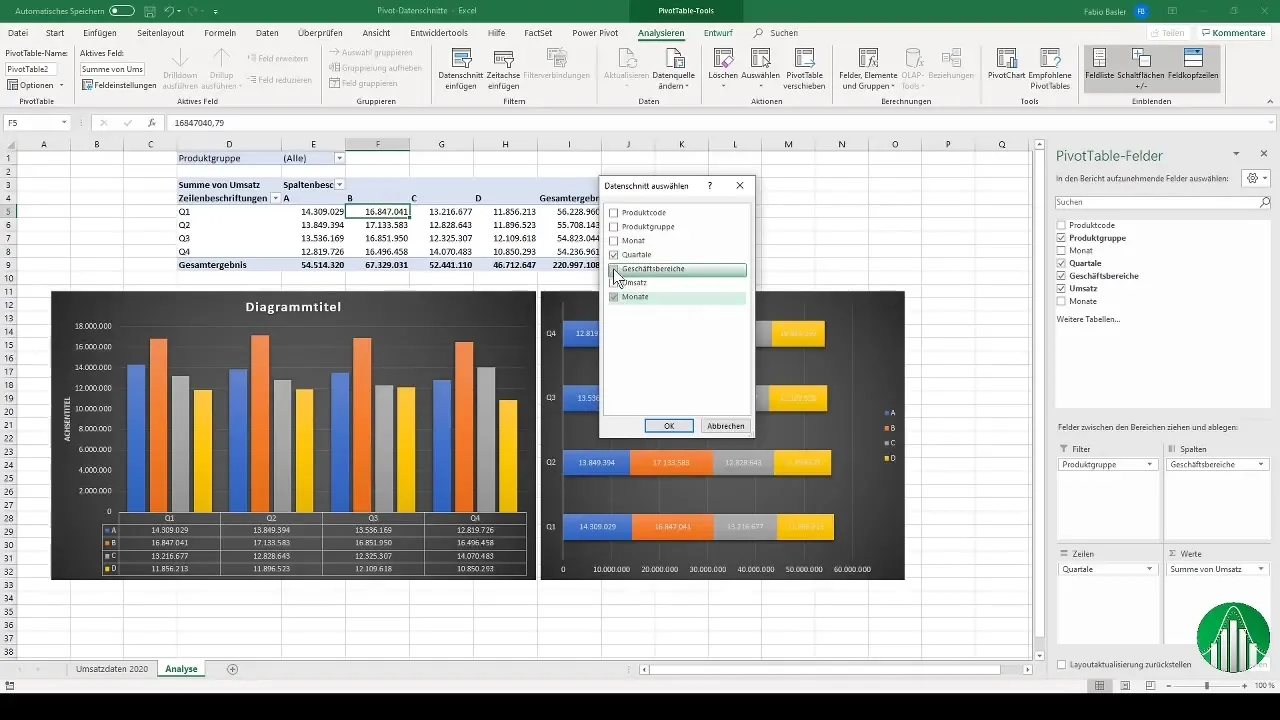
8. Insert slicers Now onto the slicers. These allow for easier visual filtering. Click on "Insert", choose "Slicer", and select the dimensions for which you want to create slicers – such as months, quarters, and business areas. Click "OK" to add the slicers.
9. Format slicers You can further customize the slicers by, for example, placing them side by side or changing their size and formatting. This significantly improves user-friendliness.
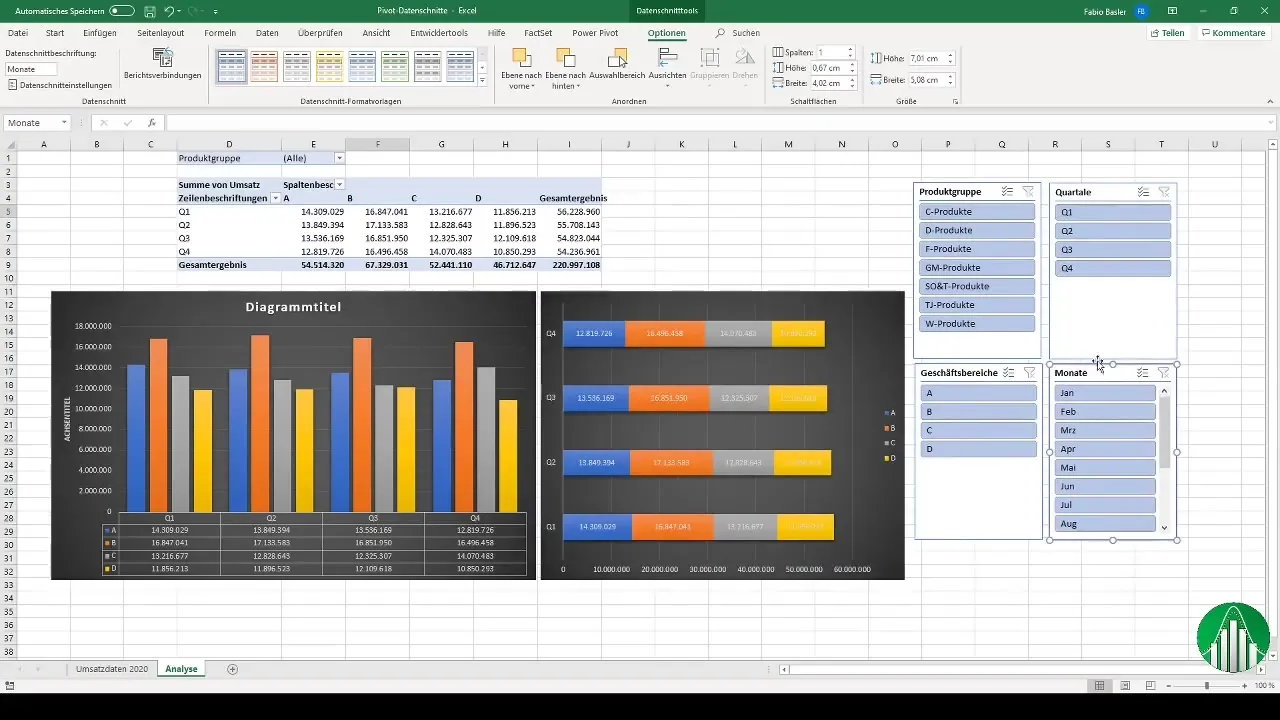
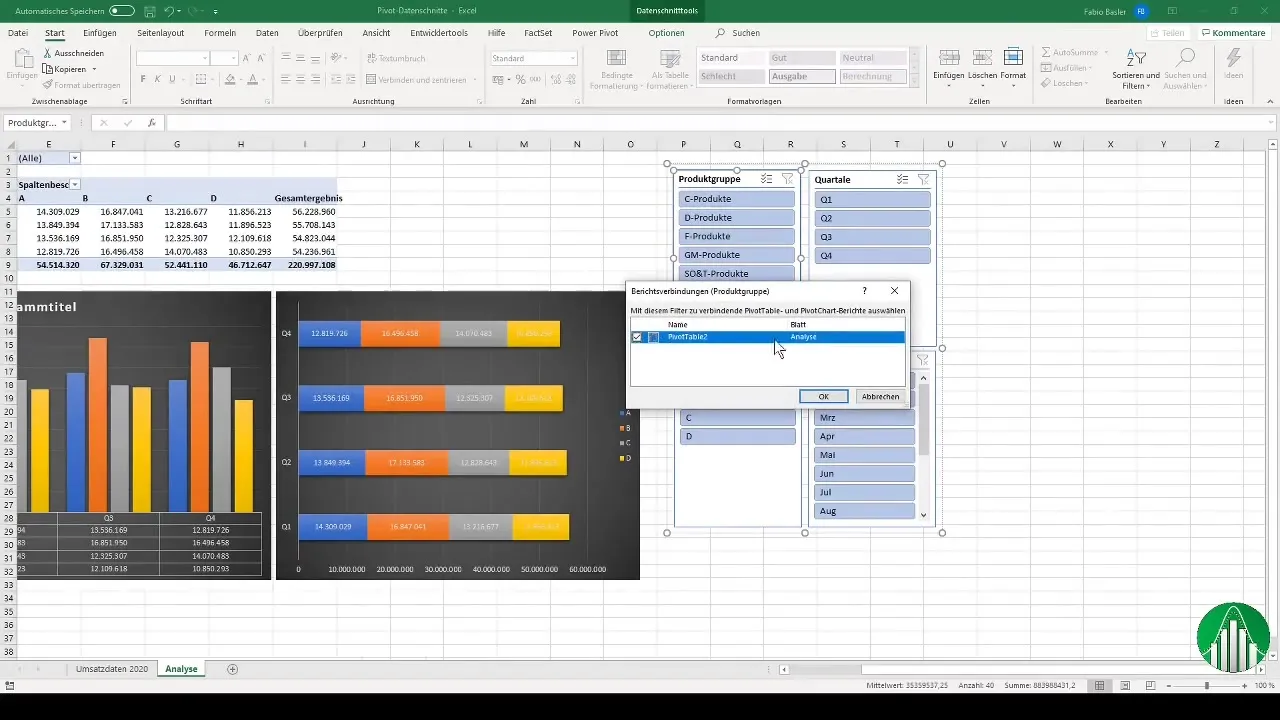
10. Linking Pivot Tables If you have multiple Pivot Tables, you can also link the slicers to them. Right-click on the slicer and select "Report Connections". This will apply the filtering to the other Pivot Tables as well.
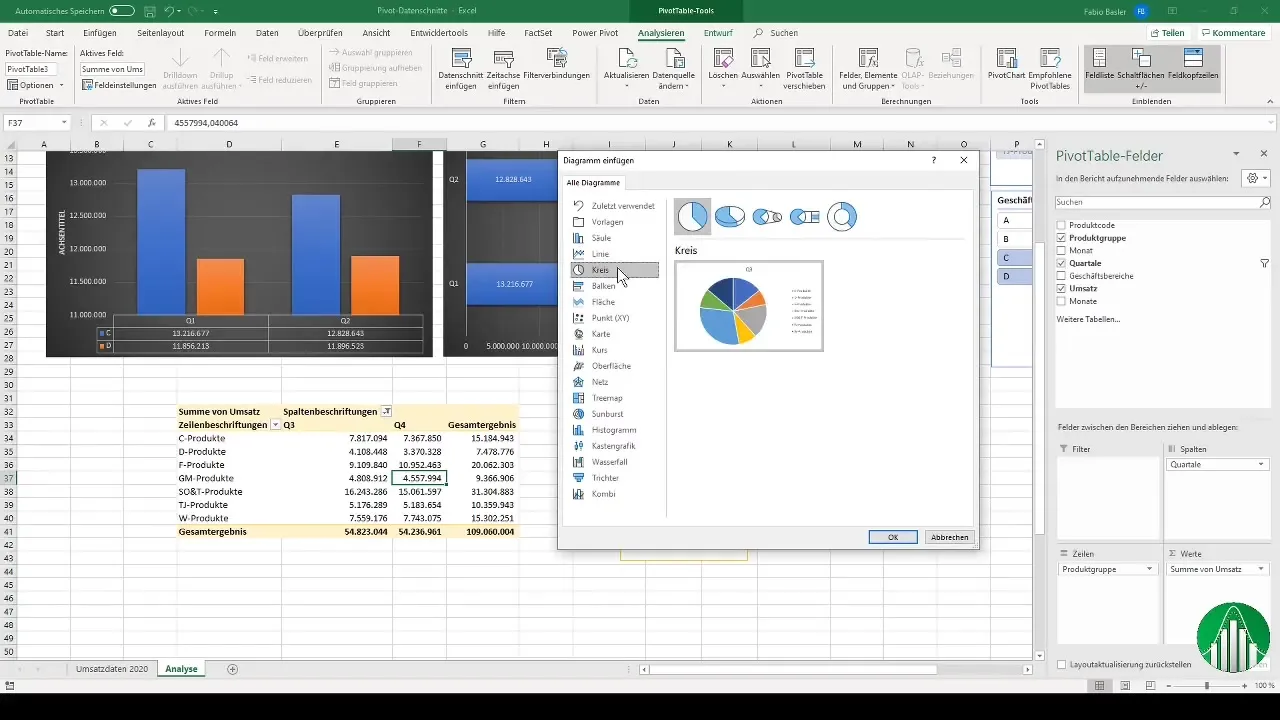
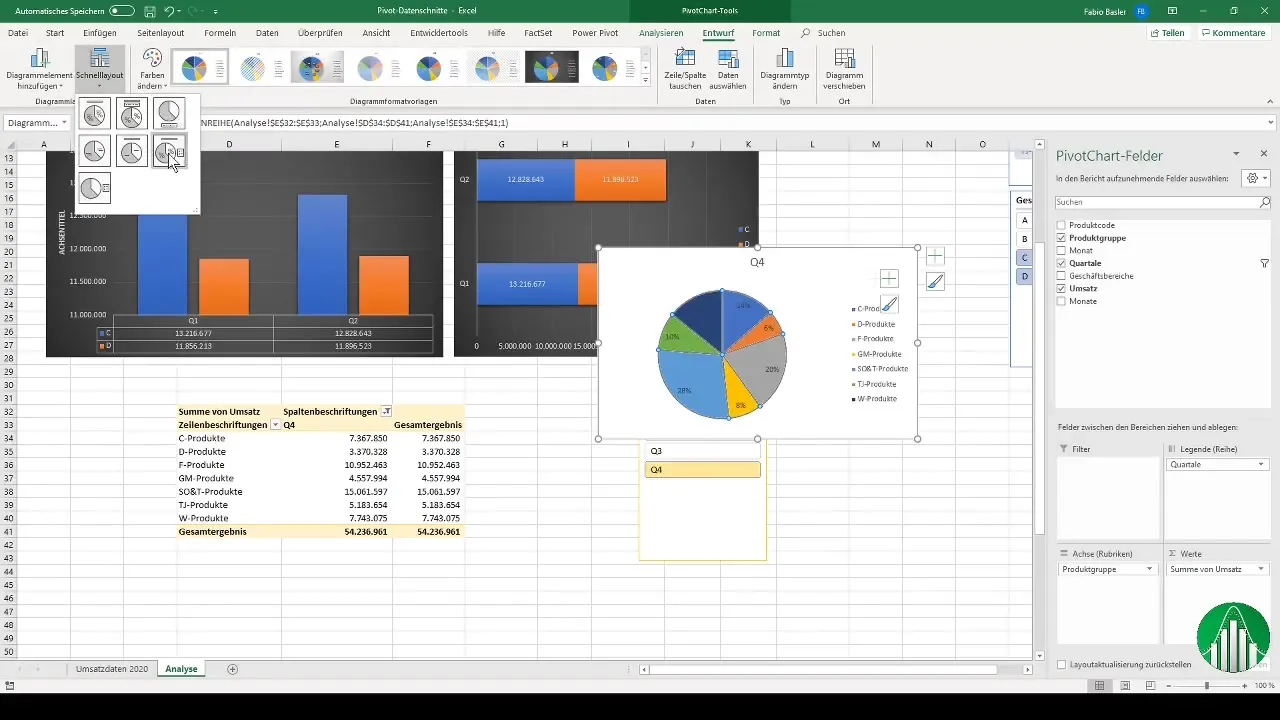
11. Adjustment of Data Visualization The representation of data in your charts can be further optimized. You can adjust colors, add legends, or rename the chart title to make the representation even more vivid. Experiment with different types of charts to find the best visualization for your data.
12. Analysis of Your Data Utilize the dynamics of data slicers to analyze your data purposefully. You can select a slicer element at any time to quickly update and filter your pivot tables without changing the basic structure of the table.
Summary
Inserting data slicers into pivot tables offers a creative and dynamic way to filter and visualize your data. By formatting your source data correctly and creating a user-friendly view, data analysis is significantly facilitated. Experiment with various types of charts and link your data slicers to efficiently present the desired information.
Frequently Asked Questions
How do I insert a data slicer into my pivot table?Select "Insert", then "Slicer" and choose which dimensions you want to insert.
Can I apply data slicers to multiple pivot tables?Yes, through report connections you can apply data slicers to multiple pivot tables.
What is the advantage of data slicers compared to traditional filters?Data slicers offer a visual and user-friendly way to filter data instead of working with dropdown menus.


