Have you ever wondered how you can efficiently analyze large amounts of data? Especially in Excel, it seems easy to lose track when dealing with many records. This is where pivot tables come into play. They are not only a tool to aggregate data but also allow you to gain deeper insights and dynamically filter information. In this article, I will explain what pivot tables are, their functions, and how you can visually represent them. Get ready to take your data analysis to the next level!
Key Insights
Pivot tables are powerful tools for data analysis in Excel. They allow you to represent data in various dimensions without modifying the source data. With the help of pivot tables, you can reduce, aggregate, and dynamically filter large amounts of data.
What are Pivot Tables?
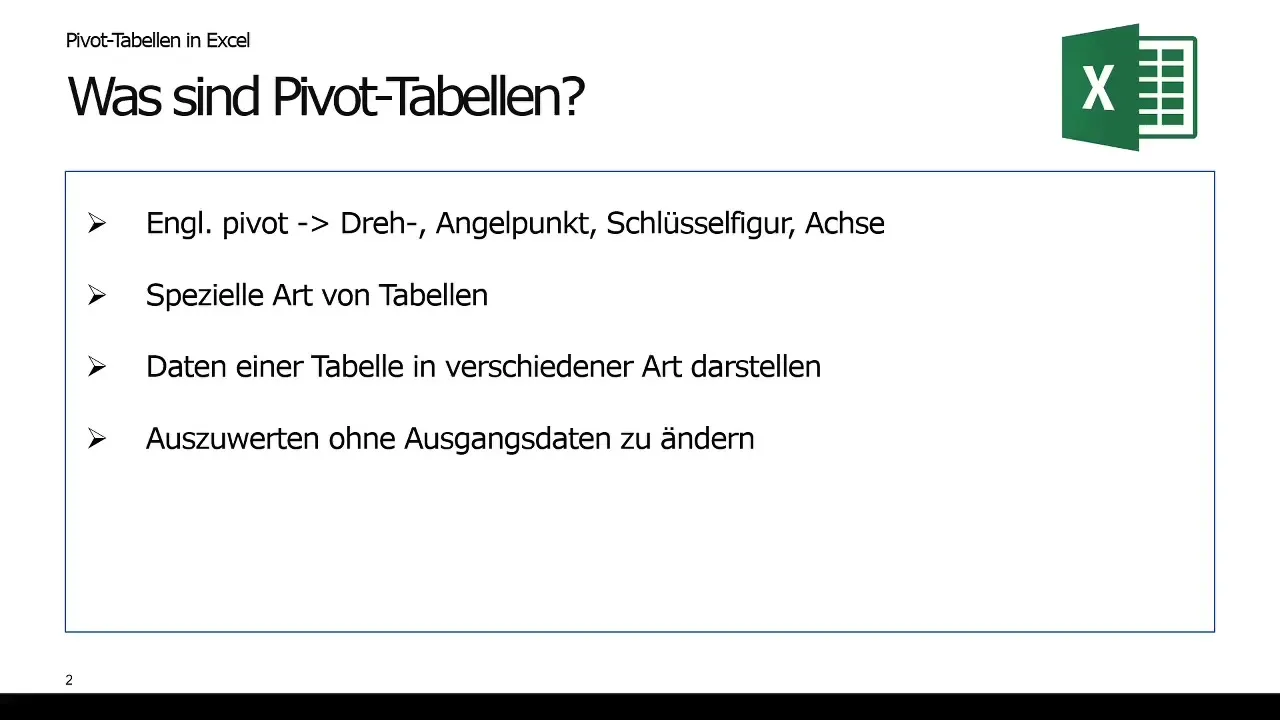
Pivot tables are a special type of table that helps you evaluate data efficiently and multidimensionally. The term "pivot" comes from English and means a pivot point. These tables allow you to analyze data without changing the original data. You can use them to identify patterns and relationships in your data, whether by time, category, or other dimensions.

You have probably tried to filter or sort data in Excel before. But what if you want to apply multiple criteria simultaneously? This is where pivot tables come in. They allow you to apply dynamic filters, such as analyzing sales by regions, year, or product categories.
Use Cases of Pivot Tables
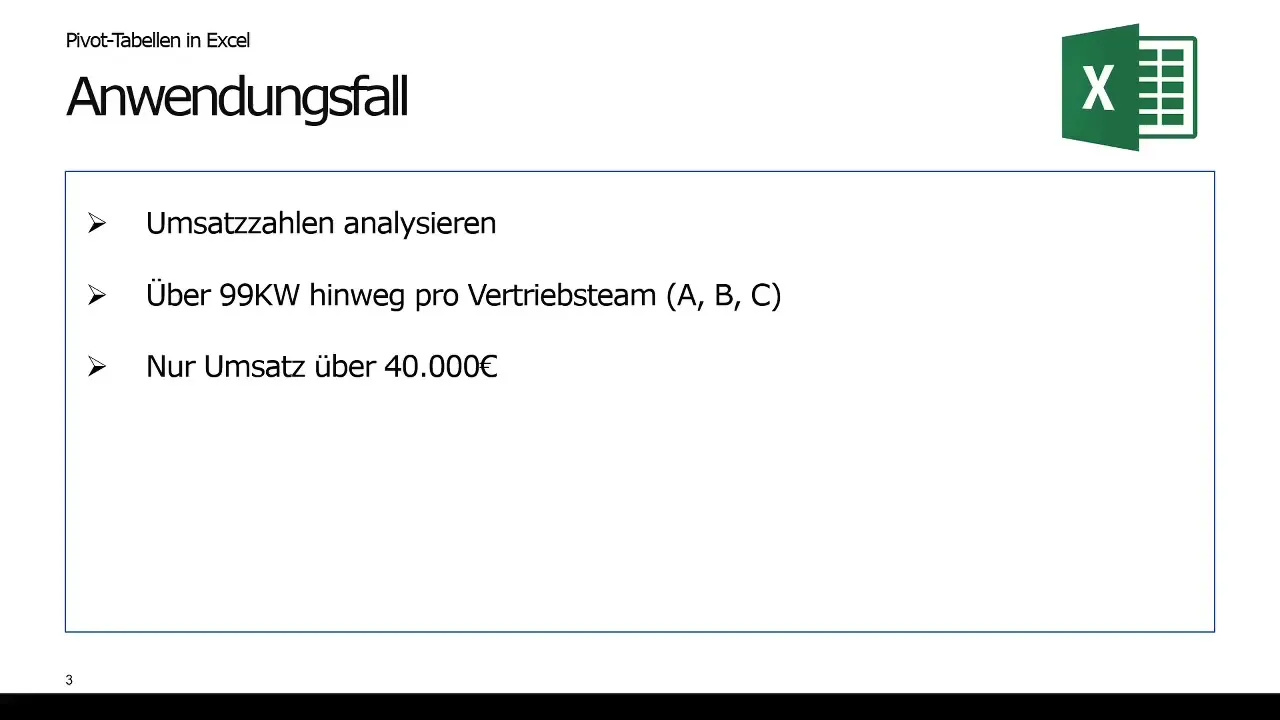
Imagine your boss tasks you with analyzing your company's sales figures over 99 calendar weeks. He wants to see the individual sales of the sales teams A, B, and C, as well as only the sales over 40,000 euros. This task is much easier to accomplish using pivot tables.
Unlike manual filtering and copying of values, which can be time-consuming and error-prone, with pivot tables, you can capture and analyze all relevant numbers at a glance. You can generate the table ready-made from a database and dynamically adjust your views.
Step-by-Step Guide to Creating a Pivot Table
Step 1: Prepare Raw Data
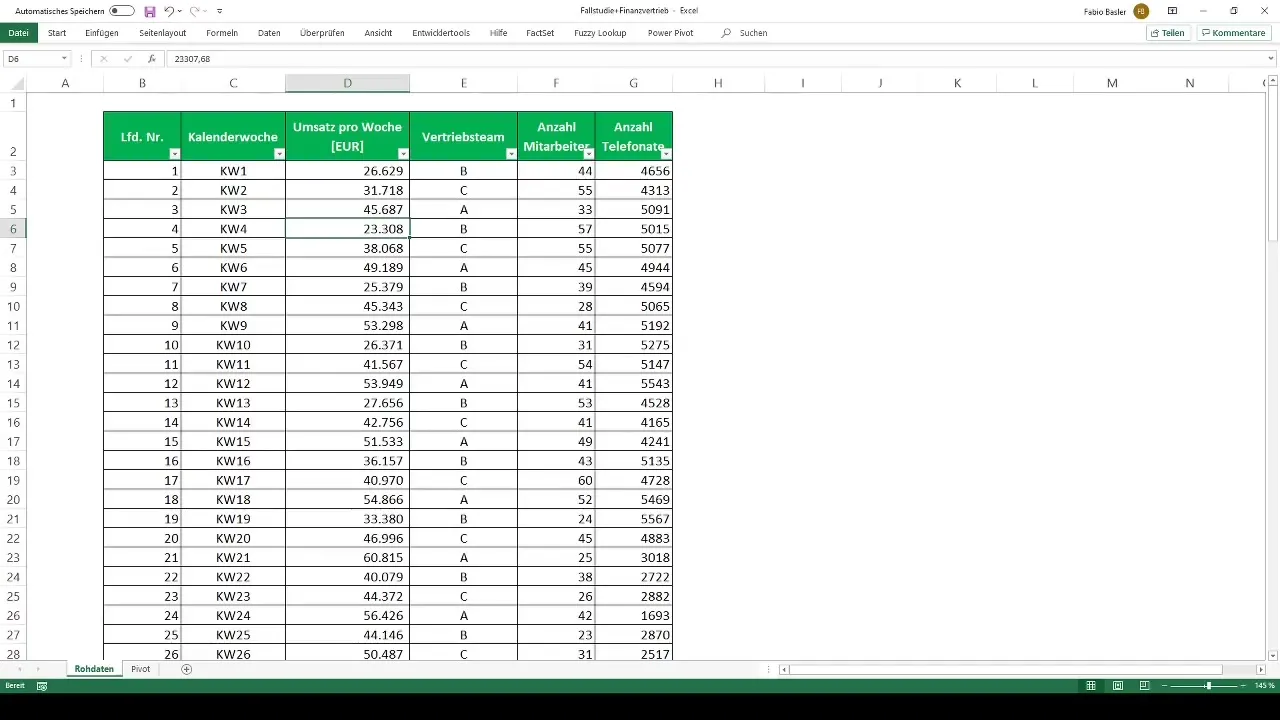
Before you can create a pivot table, you need a thoroughly structured data set. This should include clearly labeled columns and a complete data series. The data should be presented in a tabular schema - simply put: each column represents a property, each row represents a record.
Step 2: Create Pivot Table
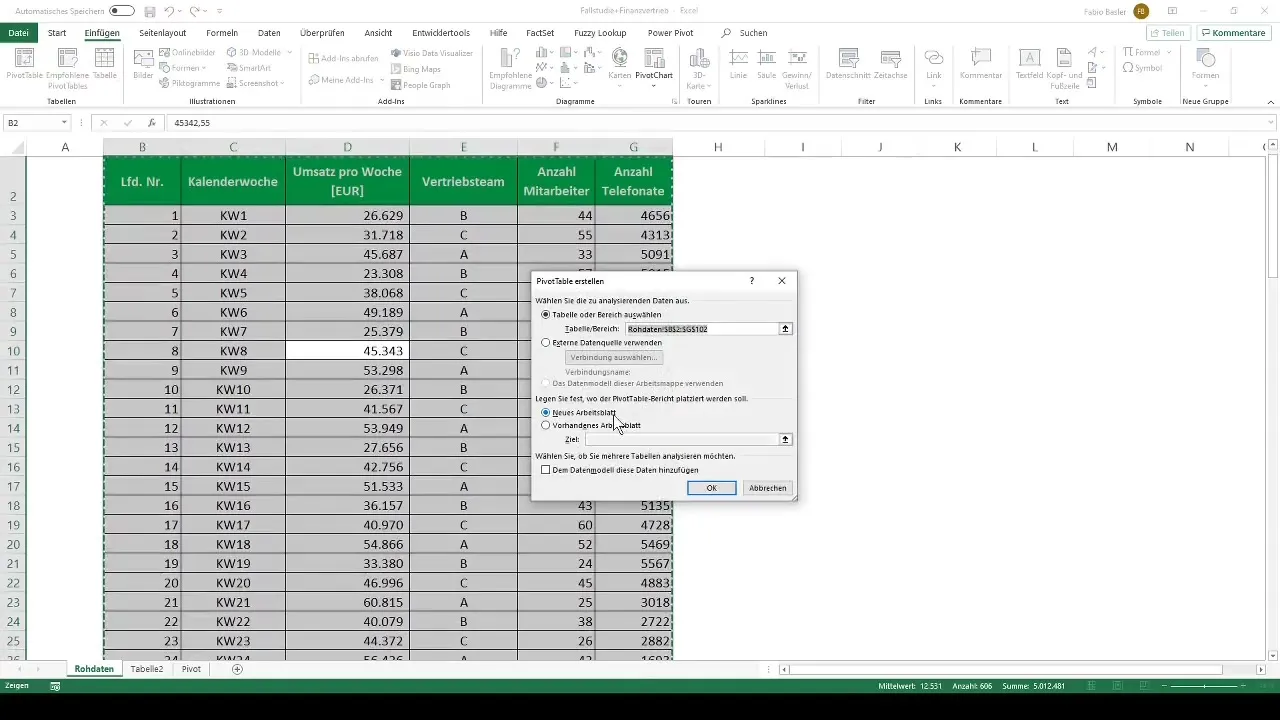
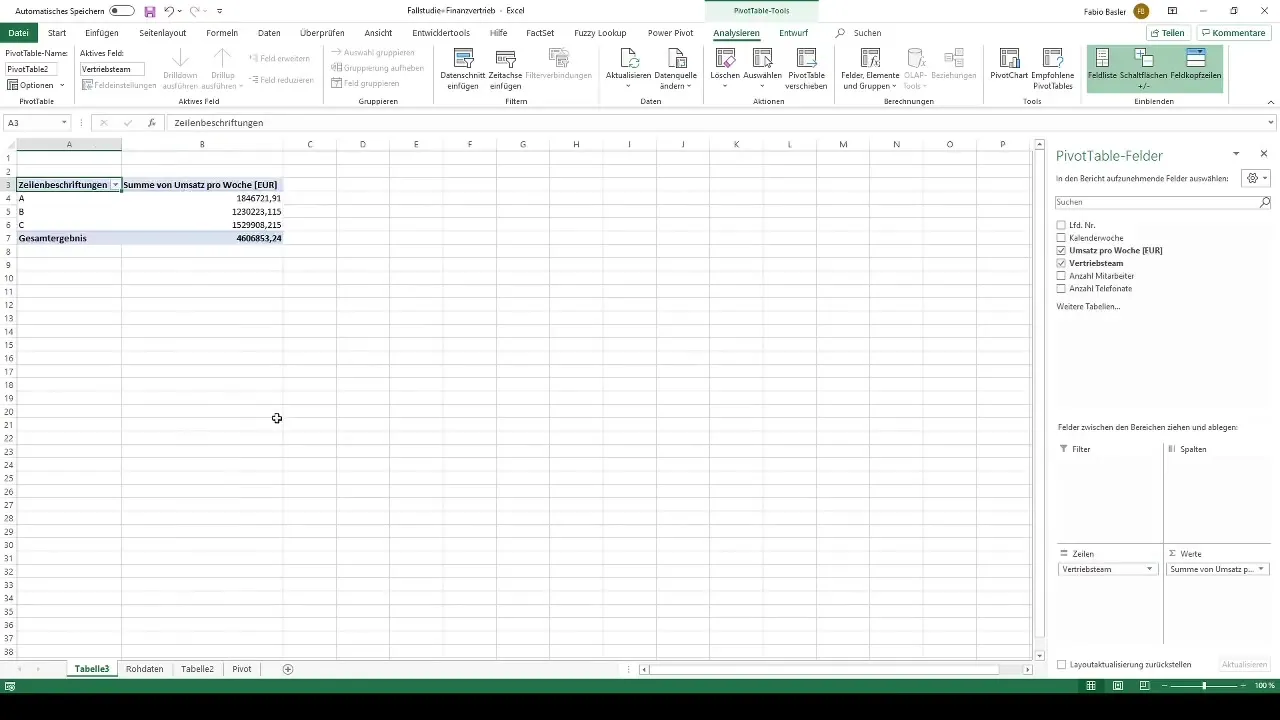
Once your data is structured, you can create the pivot table. Go to the "Insert" tab in the top menu bar and click on "PivotTable". In the dialog box that appears, select the data you want to analyze. Make sure the range is correct.
Step 3: Organize Data Fields
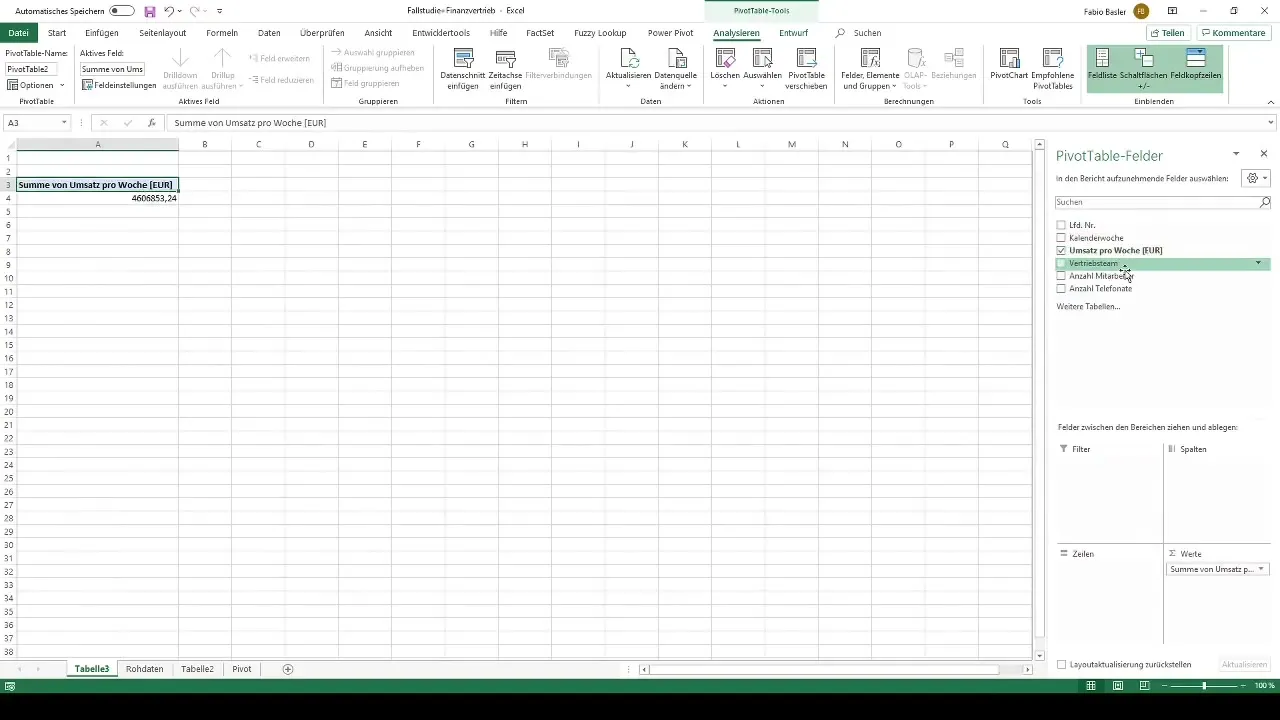
Now it's time to organize the fields for the pivot table. You have the option to display various dimensions in your table: drag the relevant fields to the "Rows", "Columns", and "Values" areas of the pivot table. For example, you can show the sales team as row labels and revenue as values.
Step 4: Add Filters
Want to see only specific data? Then use the filter function. You can narrow down data based on specific criteria, such as only sales over 40,000 euros. Drag the revenue field into the filter area and define the desired criteria.
Step 5: Create Pivot Charts
Do you want to represent your data not only in tables but also graphically? Then create pivot charts. Select your pivot table, go to "PivotChart", and choose the chart type that best suits your analysis - whether it's a bar, line, or pie chart.
Summary
Pivot tables are essential tools for effectively analyzing data in Excel. They provide you with the ability to transform large amounts of data, filter them dynamically, and quickly change views without having to alter the original data. By creating charts, you can present your results more visually.
Frequently Asked Questions
What are pivot tables?Pivot tables are special tables in Excel that allow you to evaluate data efficiently and flexibly.
How do I create a pivot table?Go to "Insert" and select "PivotTable". Choose the data range and arrange the fields.
Can I also graphically represent pivot tables?Yes, you can create pivot charts from your pivot tables to visually represent the data.
How do I filter data in a pivot table?You can add filters by dragging the relevant fields into the filter area of the pivot table and defining the criteria.
Why are pivot tables useful?They allow you to aggregate large amounts of data and bring dynamism to your data analysis without altering the original data.


