If you've ever wondered how to effectively analyze large amounts of data in Excel, you've come to the right place. Pivot tables are powerful tools that help you identify trends, gain insights, and visually present your data in an appealing way. In this guide, I will introduce you to the basics, advanced techniques, and practical exercises to help you take control of your data.
Key Insights
- Pivot tables allow the analysis of large amounts of data without changes to the source data.
- You will learn step by step how to create and customize a pivot table.
- Advanced functions enable custom calculations and the creation of dynamic dashboards.
Understanding the Basics of Pivot Tables
Before creating your first pivot table, it is important to understand what they are and what functions they have. Pivot tables are multidimensional analysis tools in Excel that allow you to prepare data flexibly to gain different perspectives.
You start with a clean data foundation. This includes having your data in a structured table, ideally designed as an Excel table.
Creating Your First Pivot Table
To create your first pivot table, follow these steps:
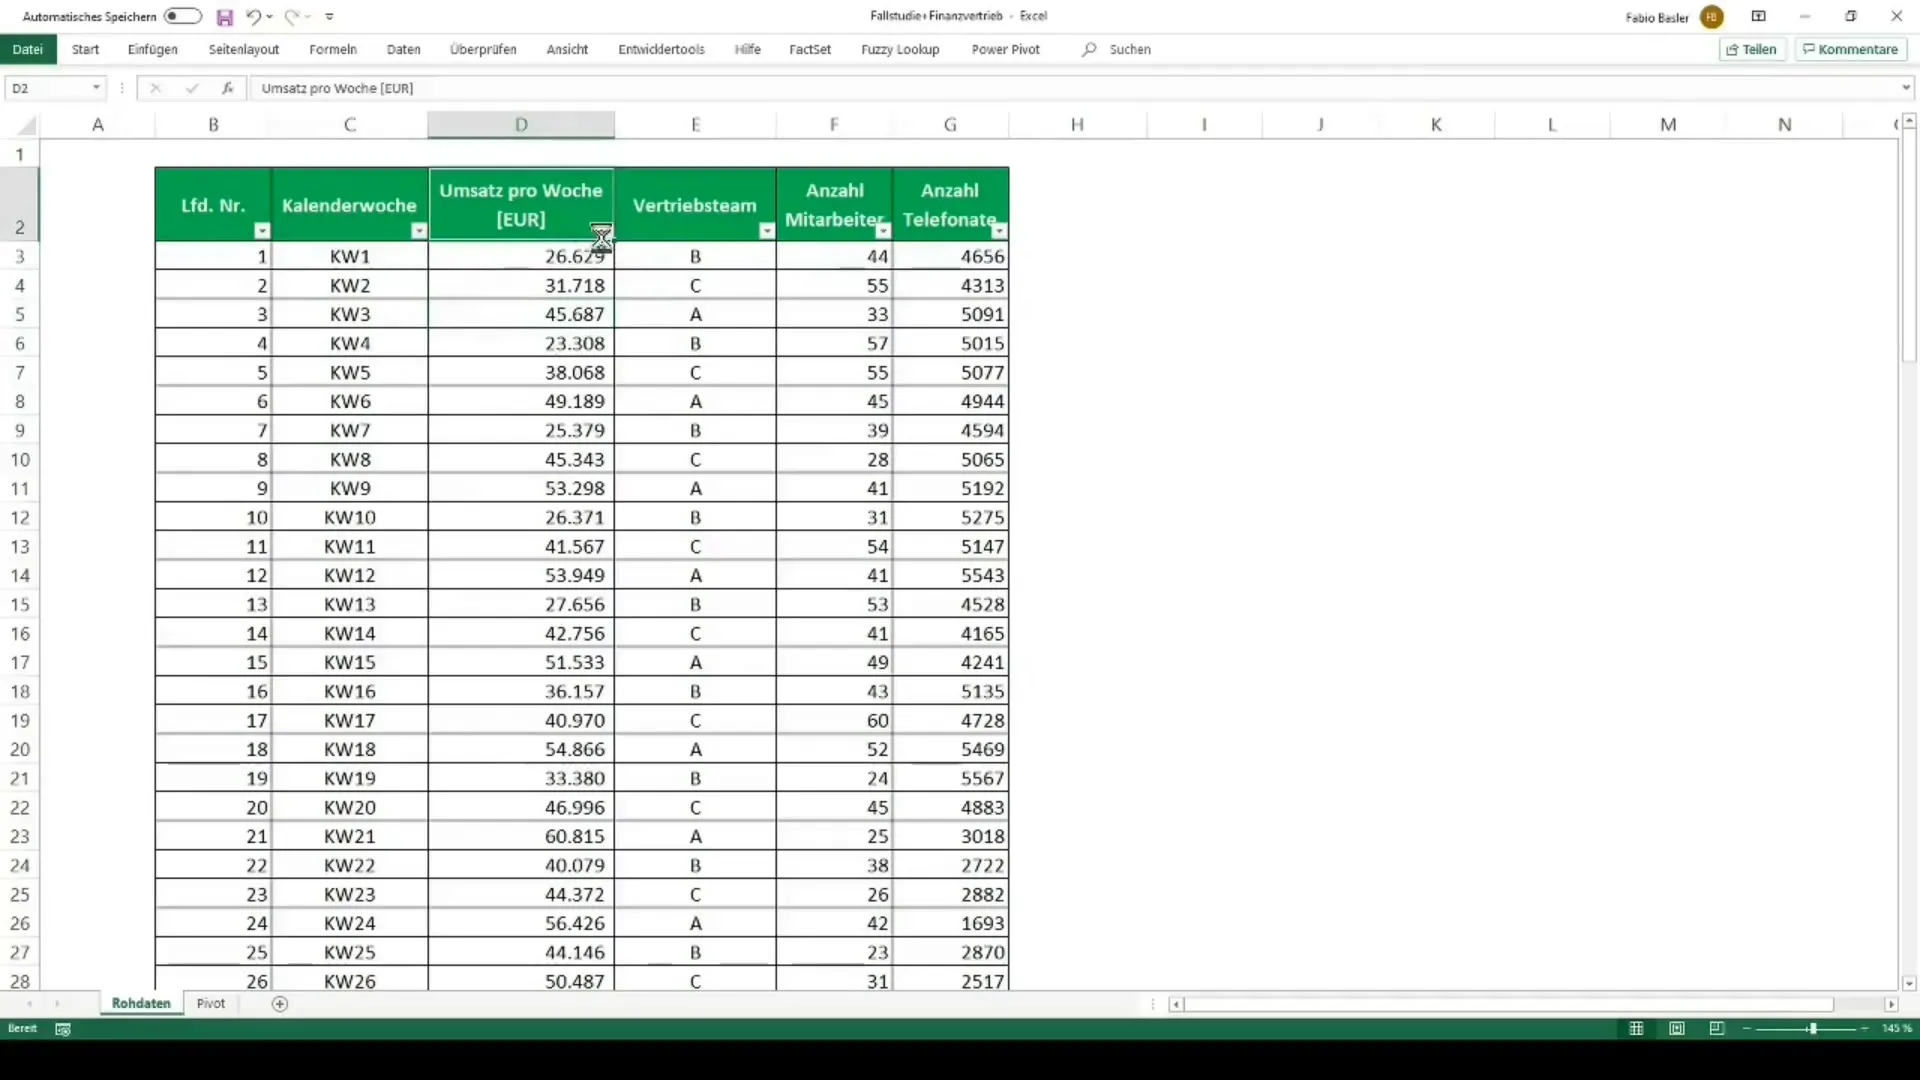
- Select your data, go to the "Insert" tab, and click on "Pivot Table."
- You have the choice between creating a new table or using an existing worksheet. Choose the appropriate option and click "OK."
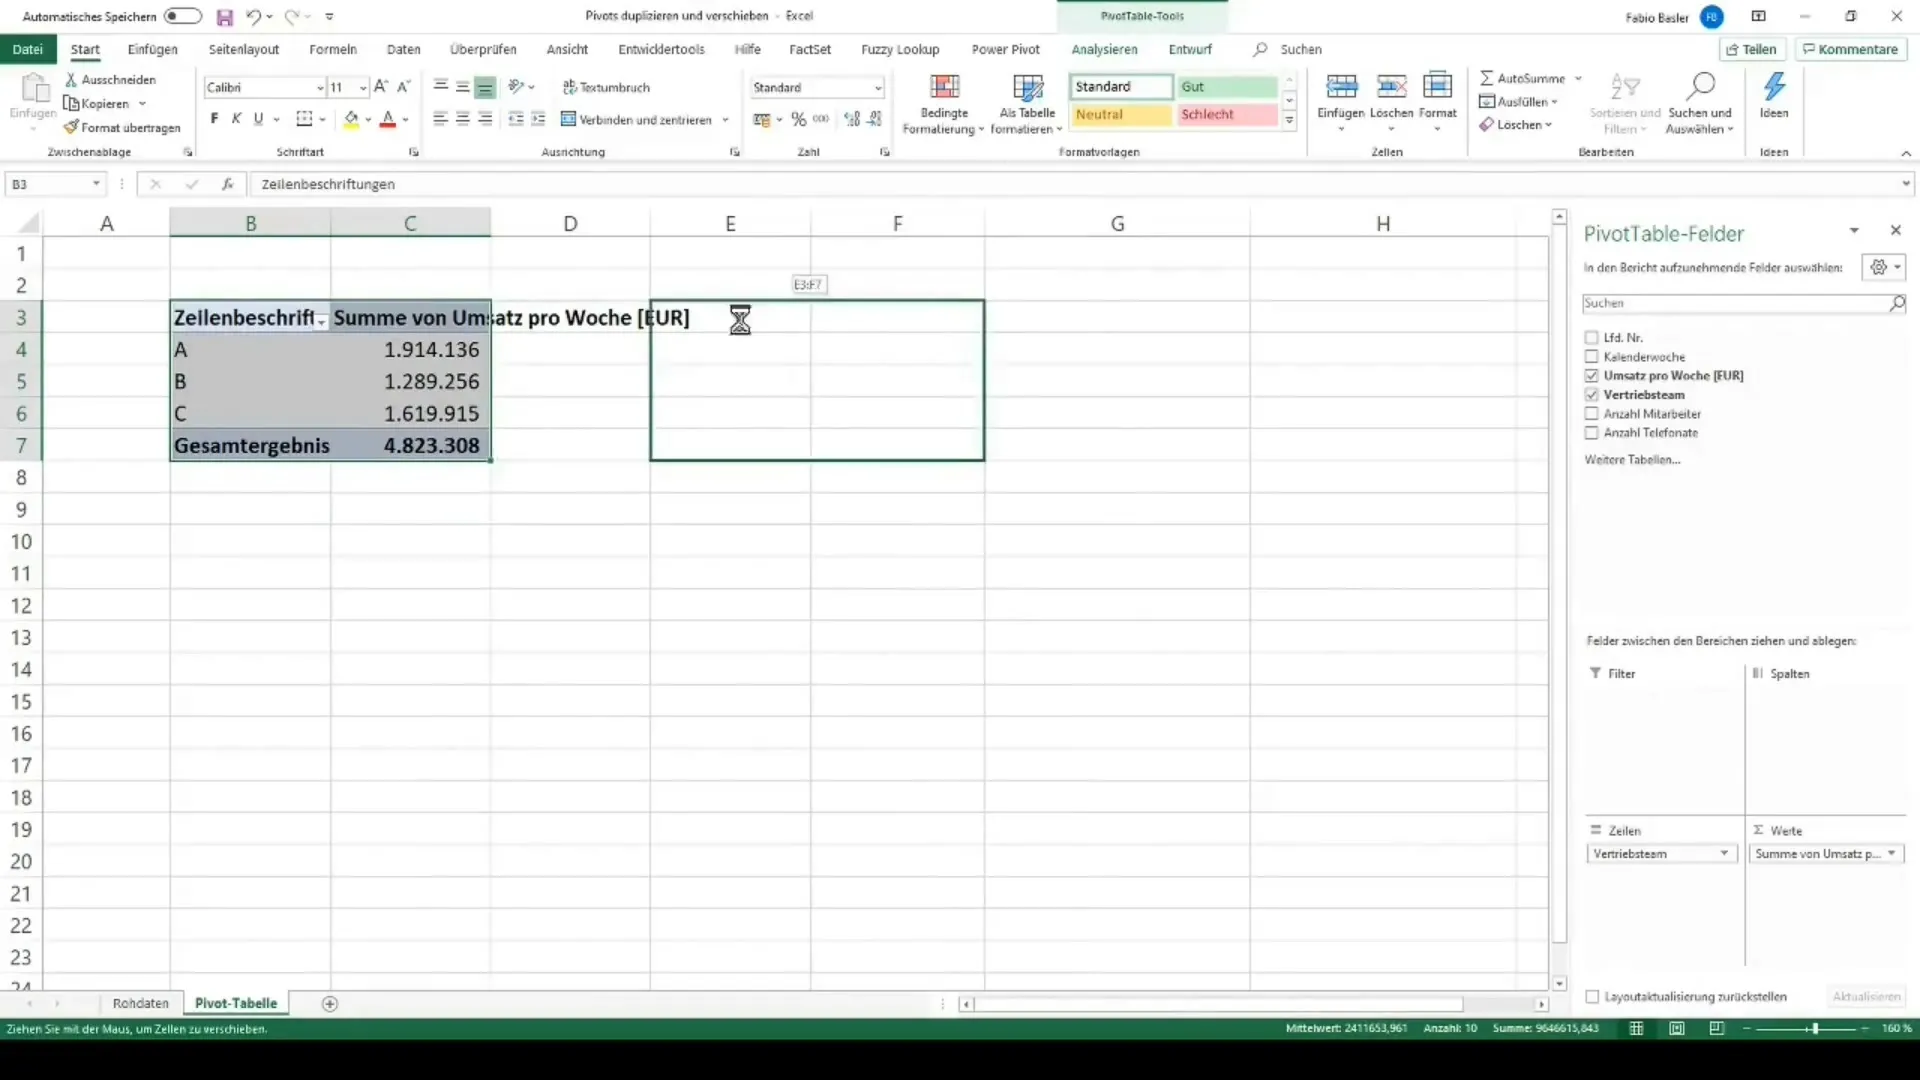
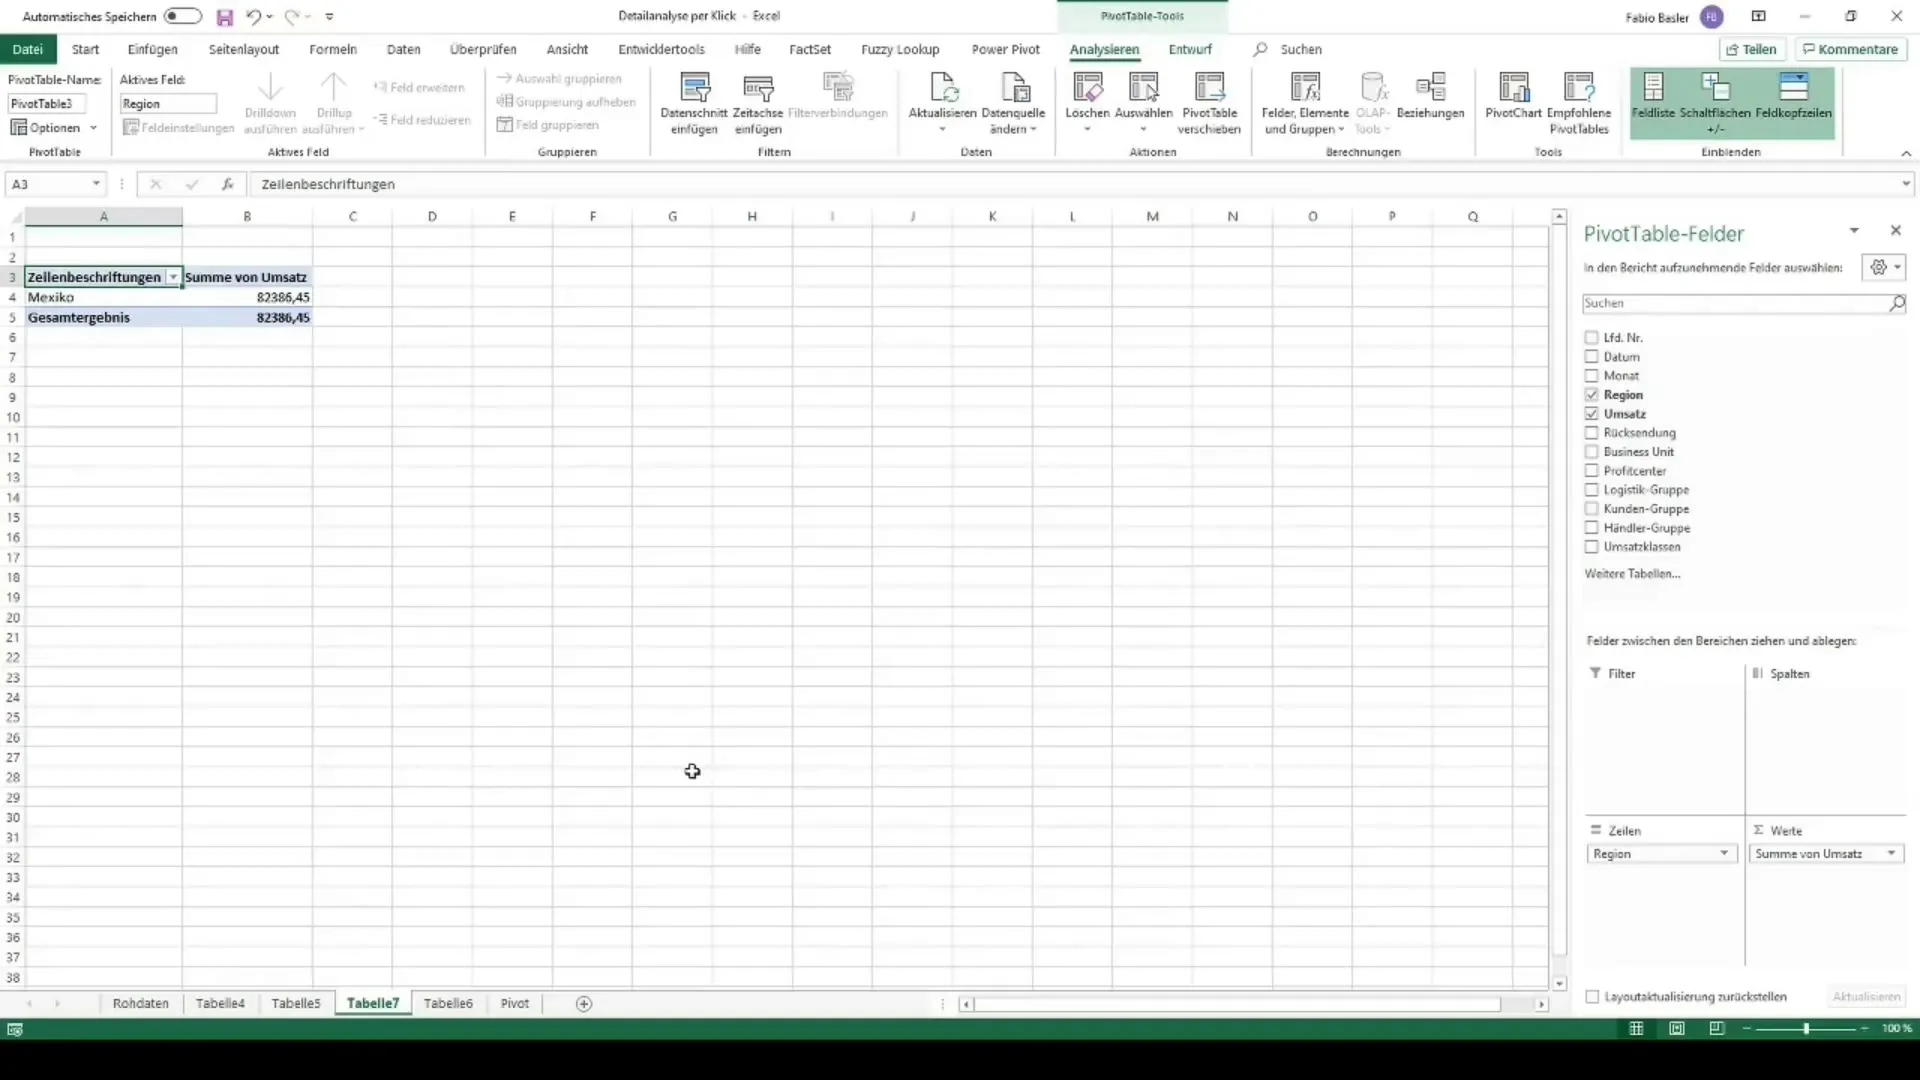
Now the PivotTable Field List window opens, where you can select the fields for your new pivot table. You can arrange categories in the row or column area, while values are placed in the value area.
Advanced Functions and Custom Metrics
Once your first pivot table is created, you can explore advanced functions & calculations. Here you will learn how to calculate custom metrics, such as sums, averages, or measures like standard deviation and maximum in your pivot table.
This can be done through the "Value Field Settings" function, where you can select the type of calculation.
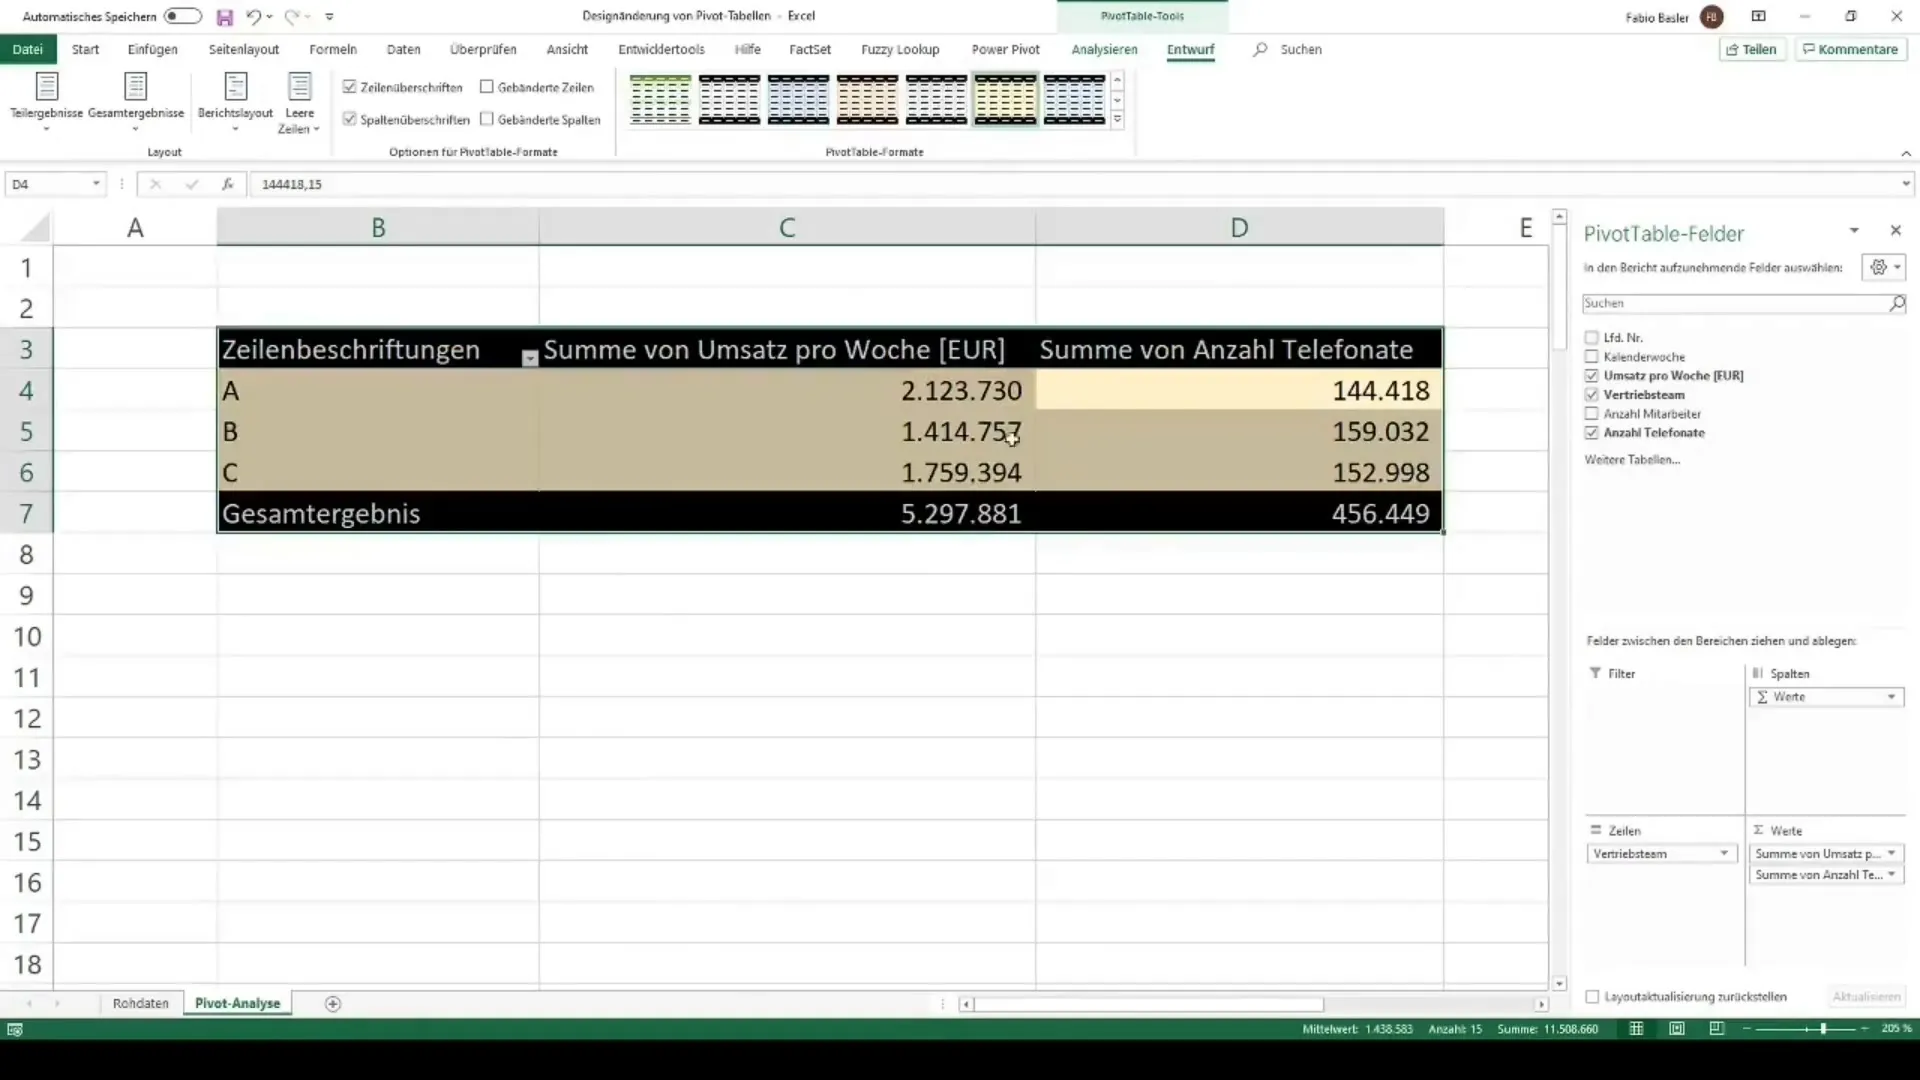
Another interesting aspect is filters and groupings. You can filter data based on specific criteria, making your analyses more precise.
Data Visualization
To present the insights gained more effectively, it is advisable to visualize your pivot table with charts. You can create basic chart types such as column and line charts as well as more complex visualizations like combination charts or network diagrams.
- To do this, select your pivot table and go to "Insert" > "Chart." There you can choose from the various chart types.
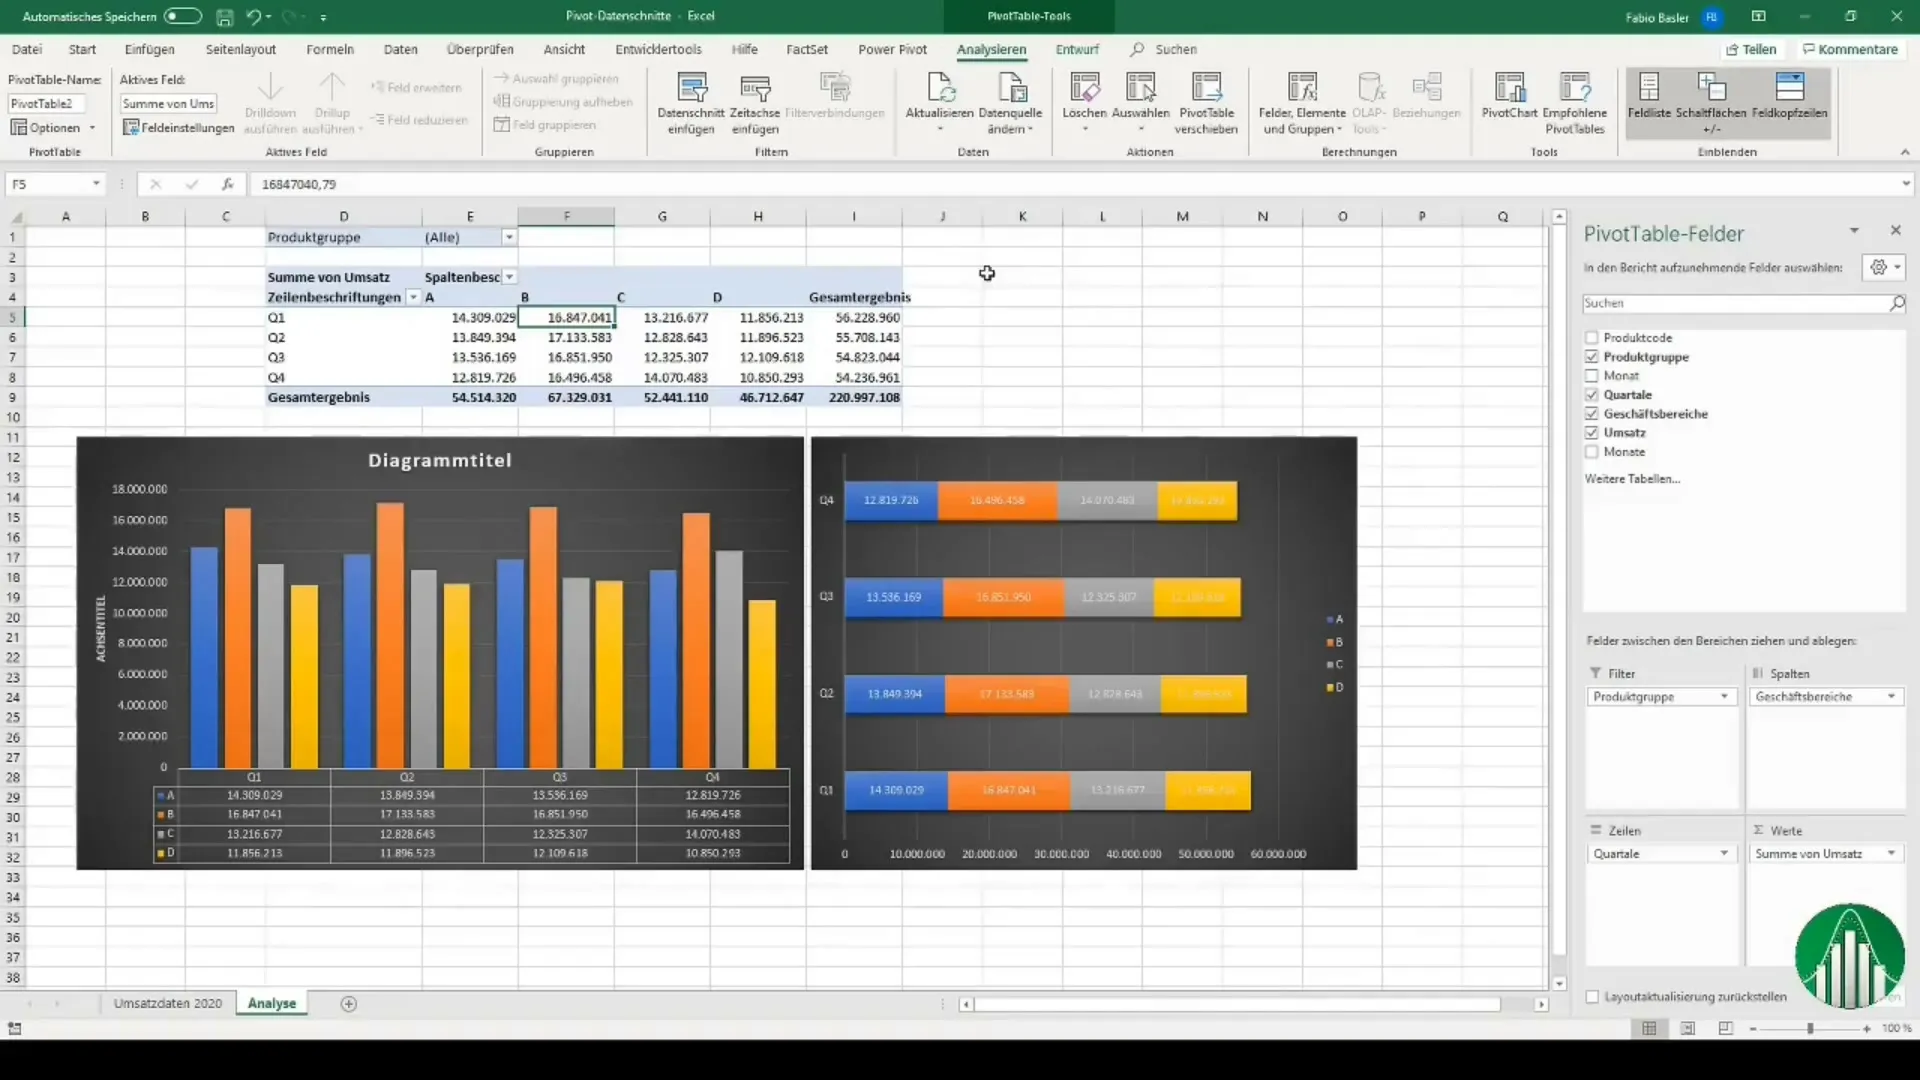
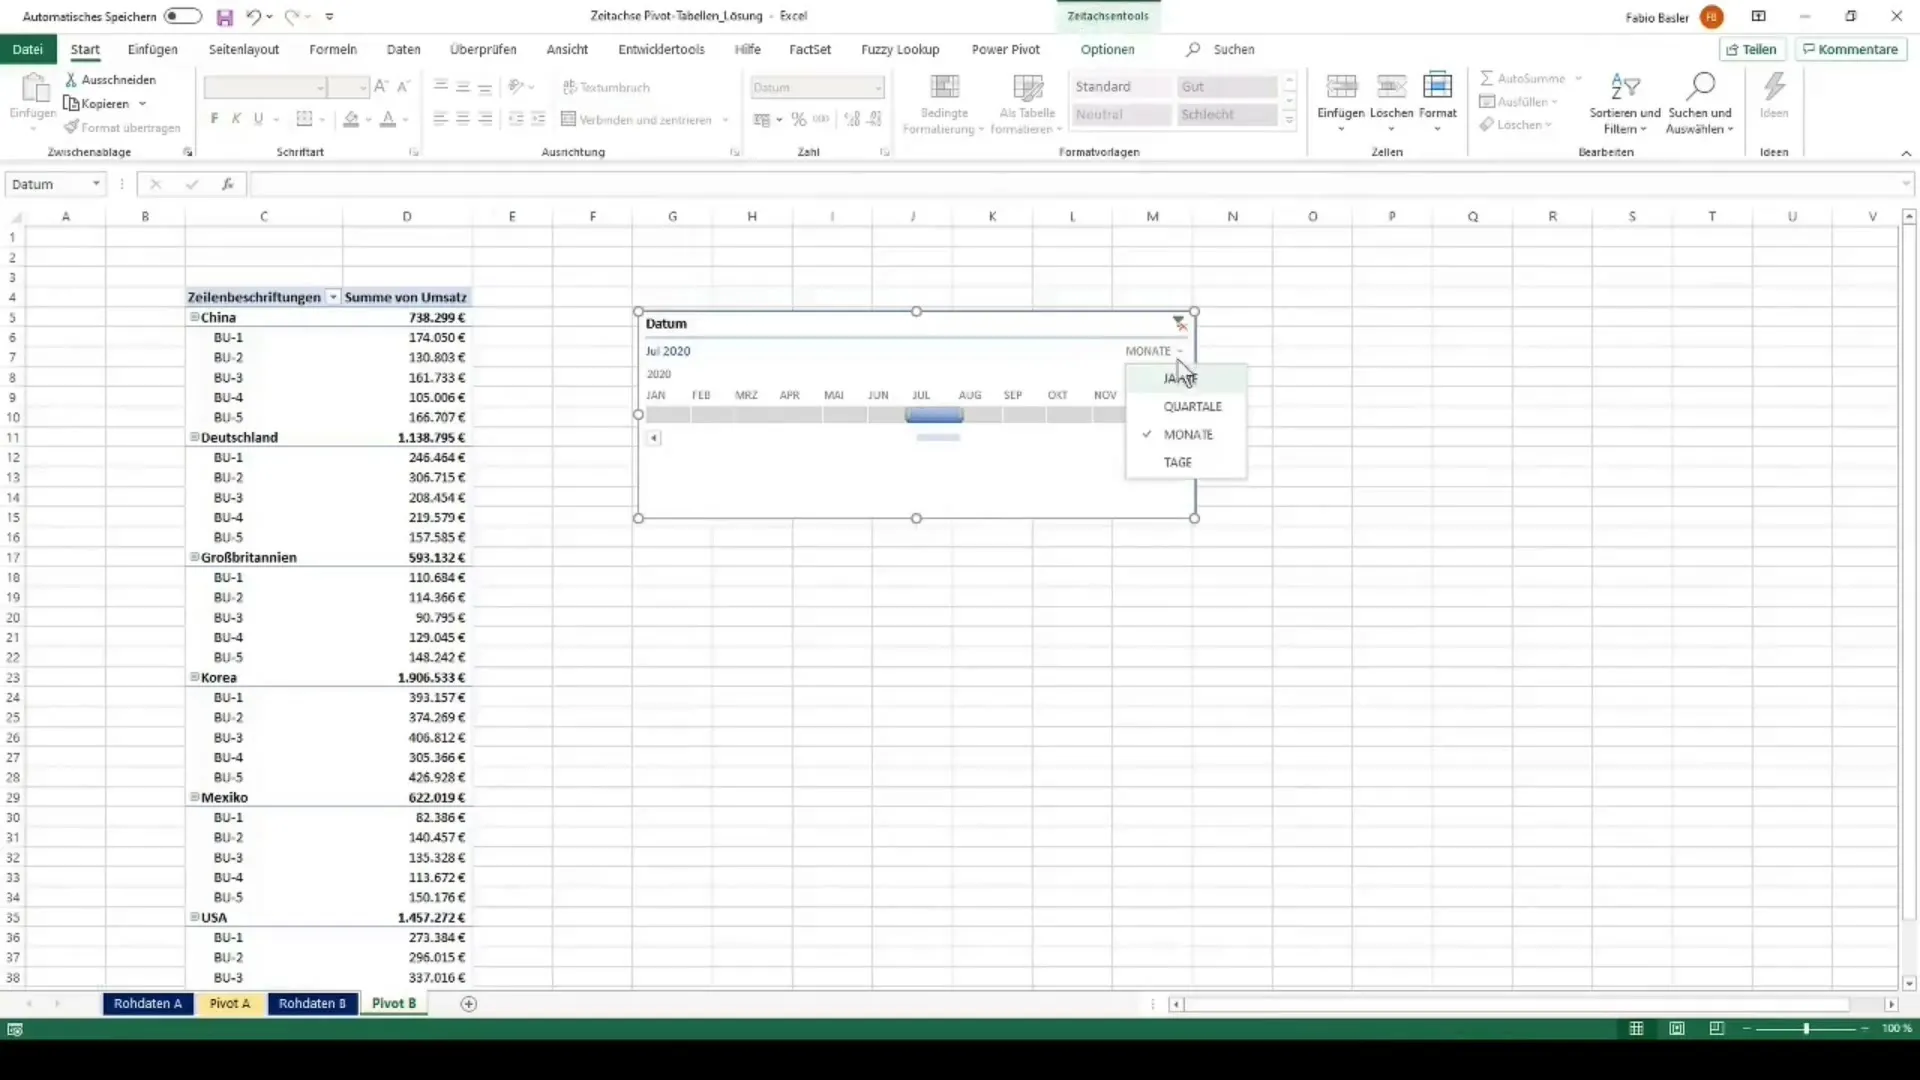
Creating a dynamic dashboard with the corresponding charts also requires the use of slicers. These allow you to actively filter the data in your charts.
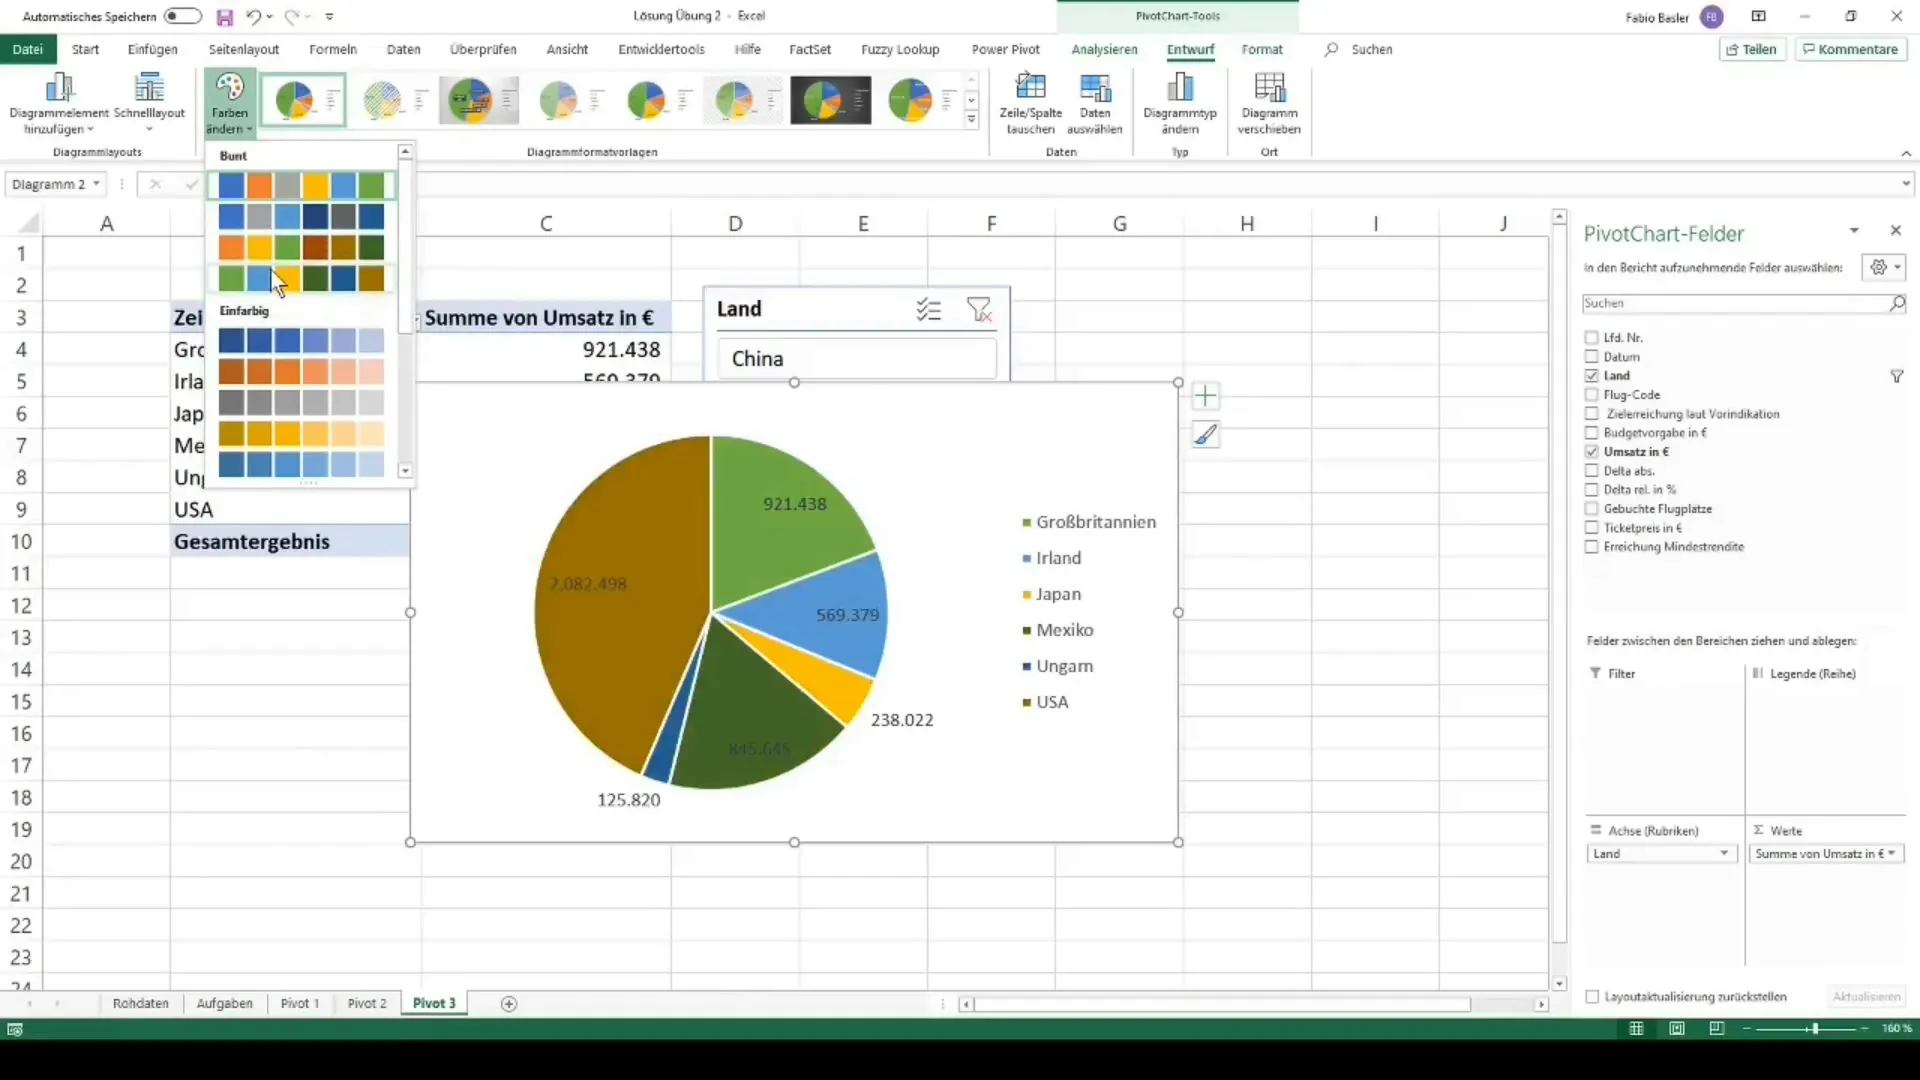
Design and Customizations
The design of your pivot table is crucial for how clearly and attractively the data is presented. You can customize colors, fonts, and layouts to visually enhance your pivot table.
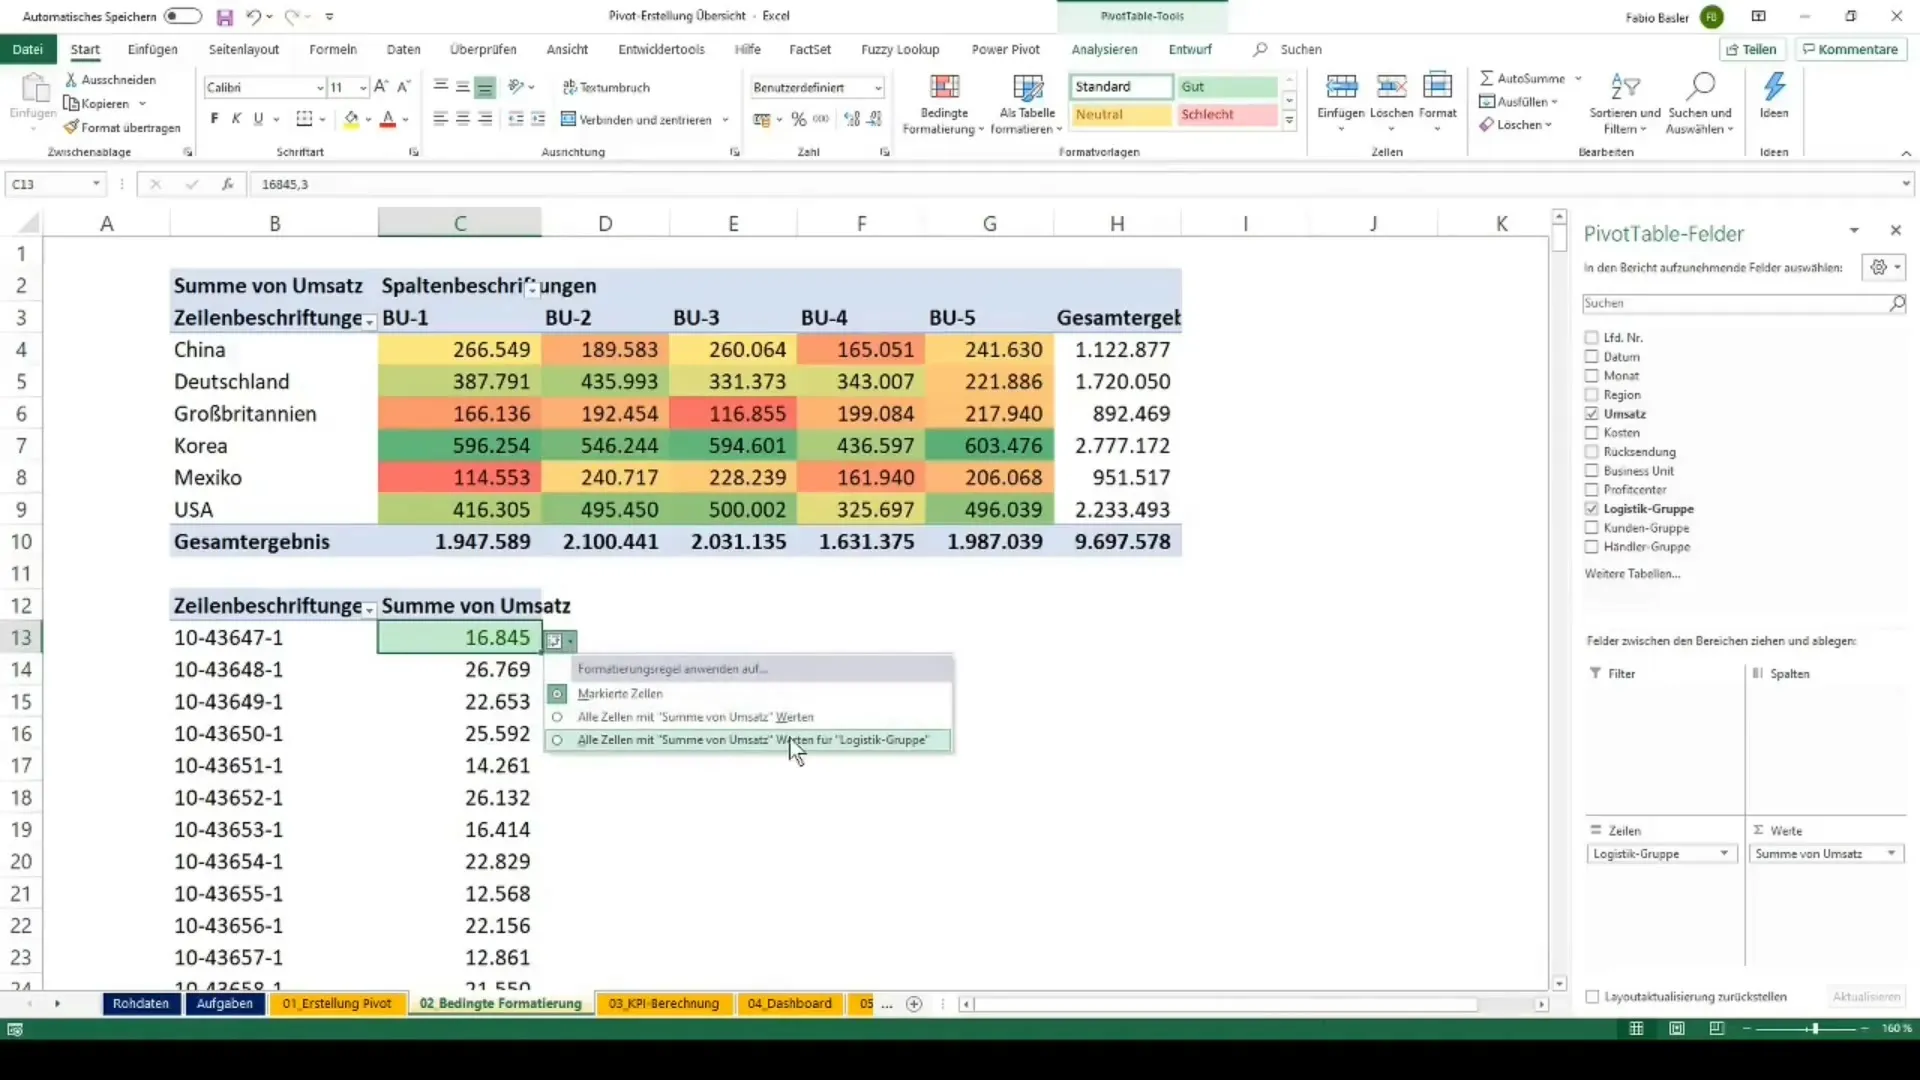
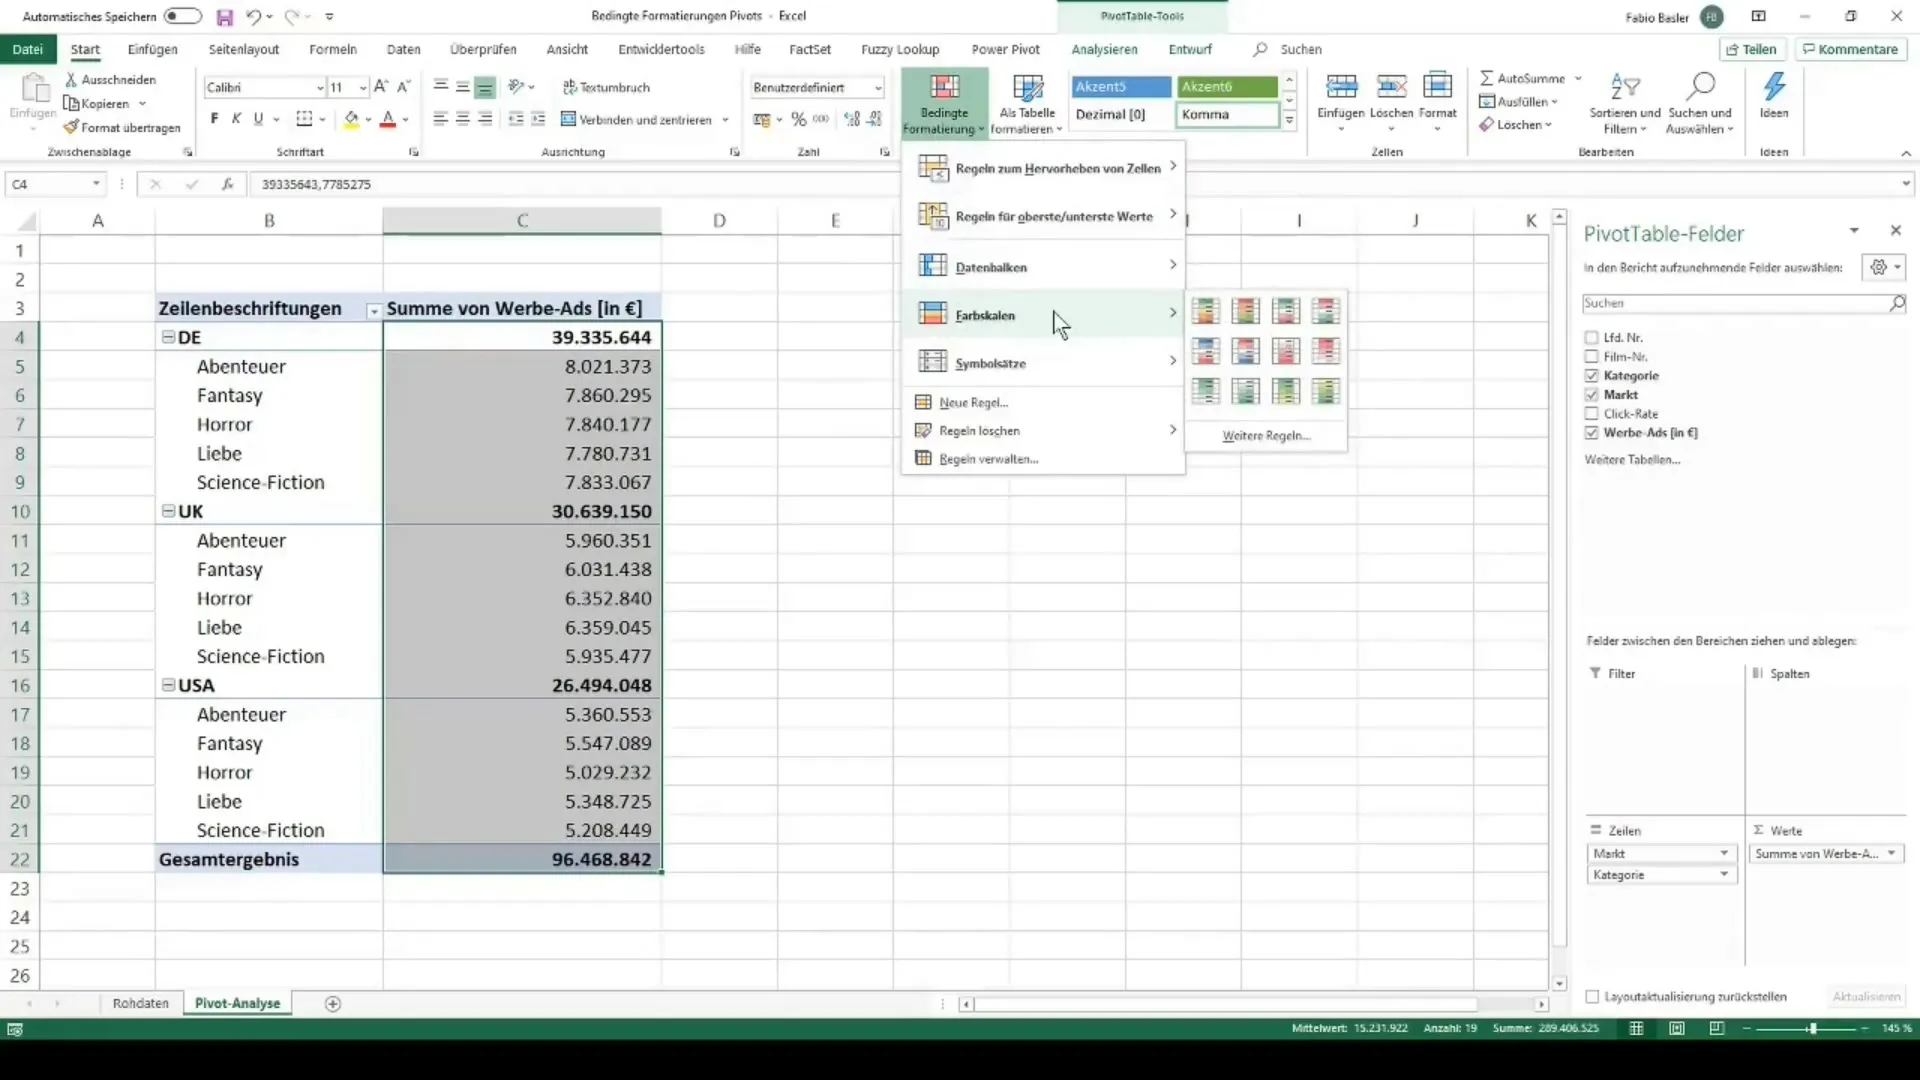
Conditional formatting is another helpful tool to visually highlight your data. Through the "Home" tab, you can specify which cells should be highlighted based on certain conditions under "Conditional Formatting."
Practice Examples for Reinforcement
After each of these sections, there is a practical exercise where you can test your knowledge. These exercises are designed so that you can directly apply what you have learned into practice and further develop your skills.
Summary
Mastery of pivot tables in Excel opens up a new world of data analysis for you. Not only can you manage large datasets, but you can also present them flexibly and attractively. The various steps, from basics to custom calculations to dynamic dashboards, provide you with the tools you need to become an expert in your field.
Frequently Asked Questions
How can I filter data in my pivot tables?You can easily filter data by adding a slicer or using the filtering options directly in the pivot table.
Can I create multiple pivot tables from the same data source?Yes, you can create multiple pivot tables from the same data source and customize them independently.
How can I customize the formatting of my pivot table?You can customize the formatting by using the design options in the "PivotTable Design" tab.
How do I save my pivot table as a template?To save your pivot table as a template, you can save the workbook and later open it as a template.
Can I export pivot tables to other programs?Yes, you can export screenshots or the data in CSV format and then import them into other programs.

