Data visualization is an art in itself that allows you to present complex information in a way that is understandable. In this tutorial, we will delve into creating charts in Excel. Whether you are a beginner or looking to deepen your skills, here you will learn how to effectively apply different types of charts. Let's dive into the world of data visualization together!
Key Insights
- Excel offers a variety of chart types that can be used for different data visualizations.
- Working with charts in Excel requires basic knowledge of the software's functionalities.
- Projects utilizing dynamic and interactive charts benefit from improved clarity and user interaction.
Step-by-Step Guide
Basic Information on Charts in Excel
First and foremost, it is important to understand the basics of chart creation. Excel offers you a wide range of graphic types, including column, line, and pie charts. The decision on which type of chart is best suited for your data depends on the nature of your data and the intended purpose of the information.
Getting Started: Creating a Chart
To create your first chart, select the data you want to visualize. Click on the "Insert" tab and choose the desired chart type. Excel will automatically create a chart based on your data.
Chart Customization
After creating a chart, you can customize it. Click on the chart to activate the chart tools. Here you can change the design, adjust the colors, and customize the layout to your liking. These customizations help convey the desired message more clearly.
Detailed Visualization Options
In the next step, we will take a look at some common types of charts.
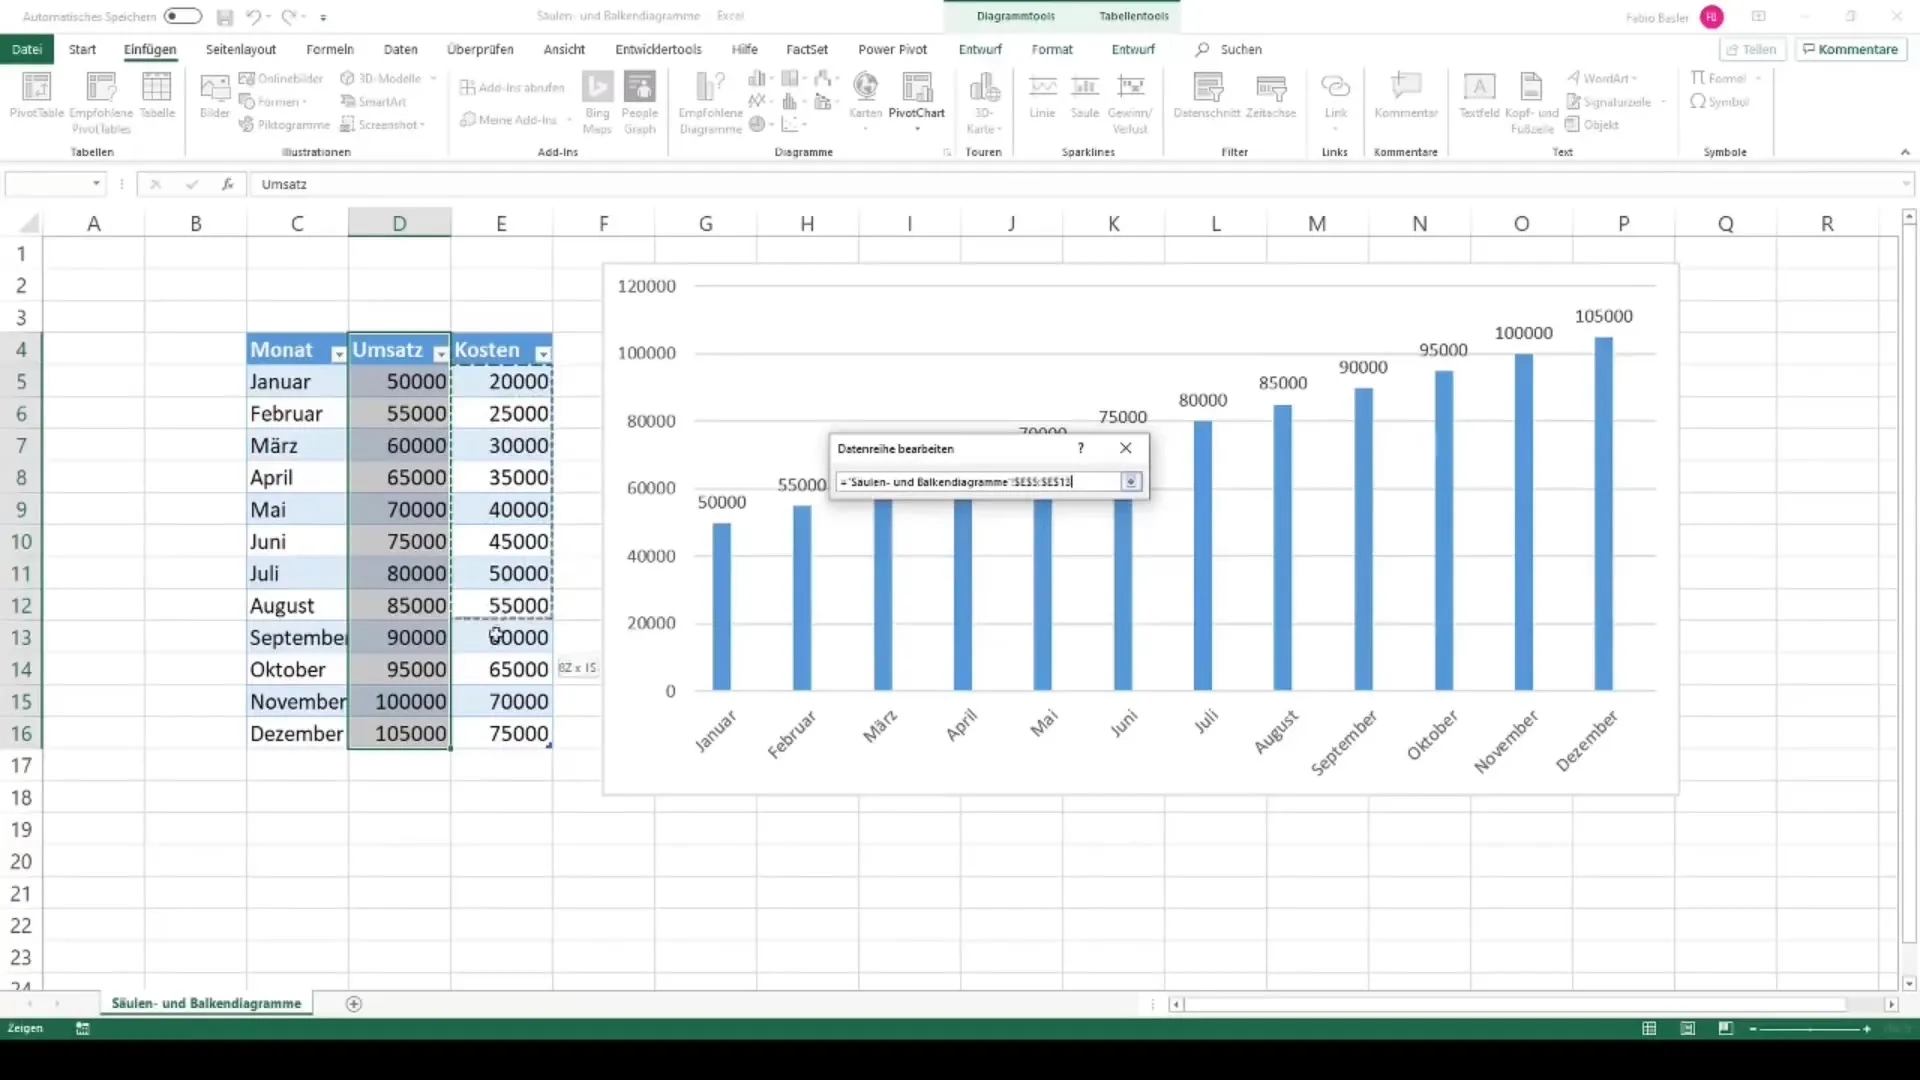
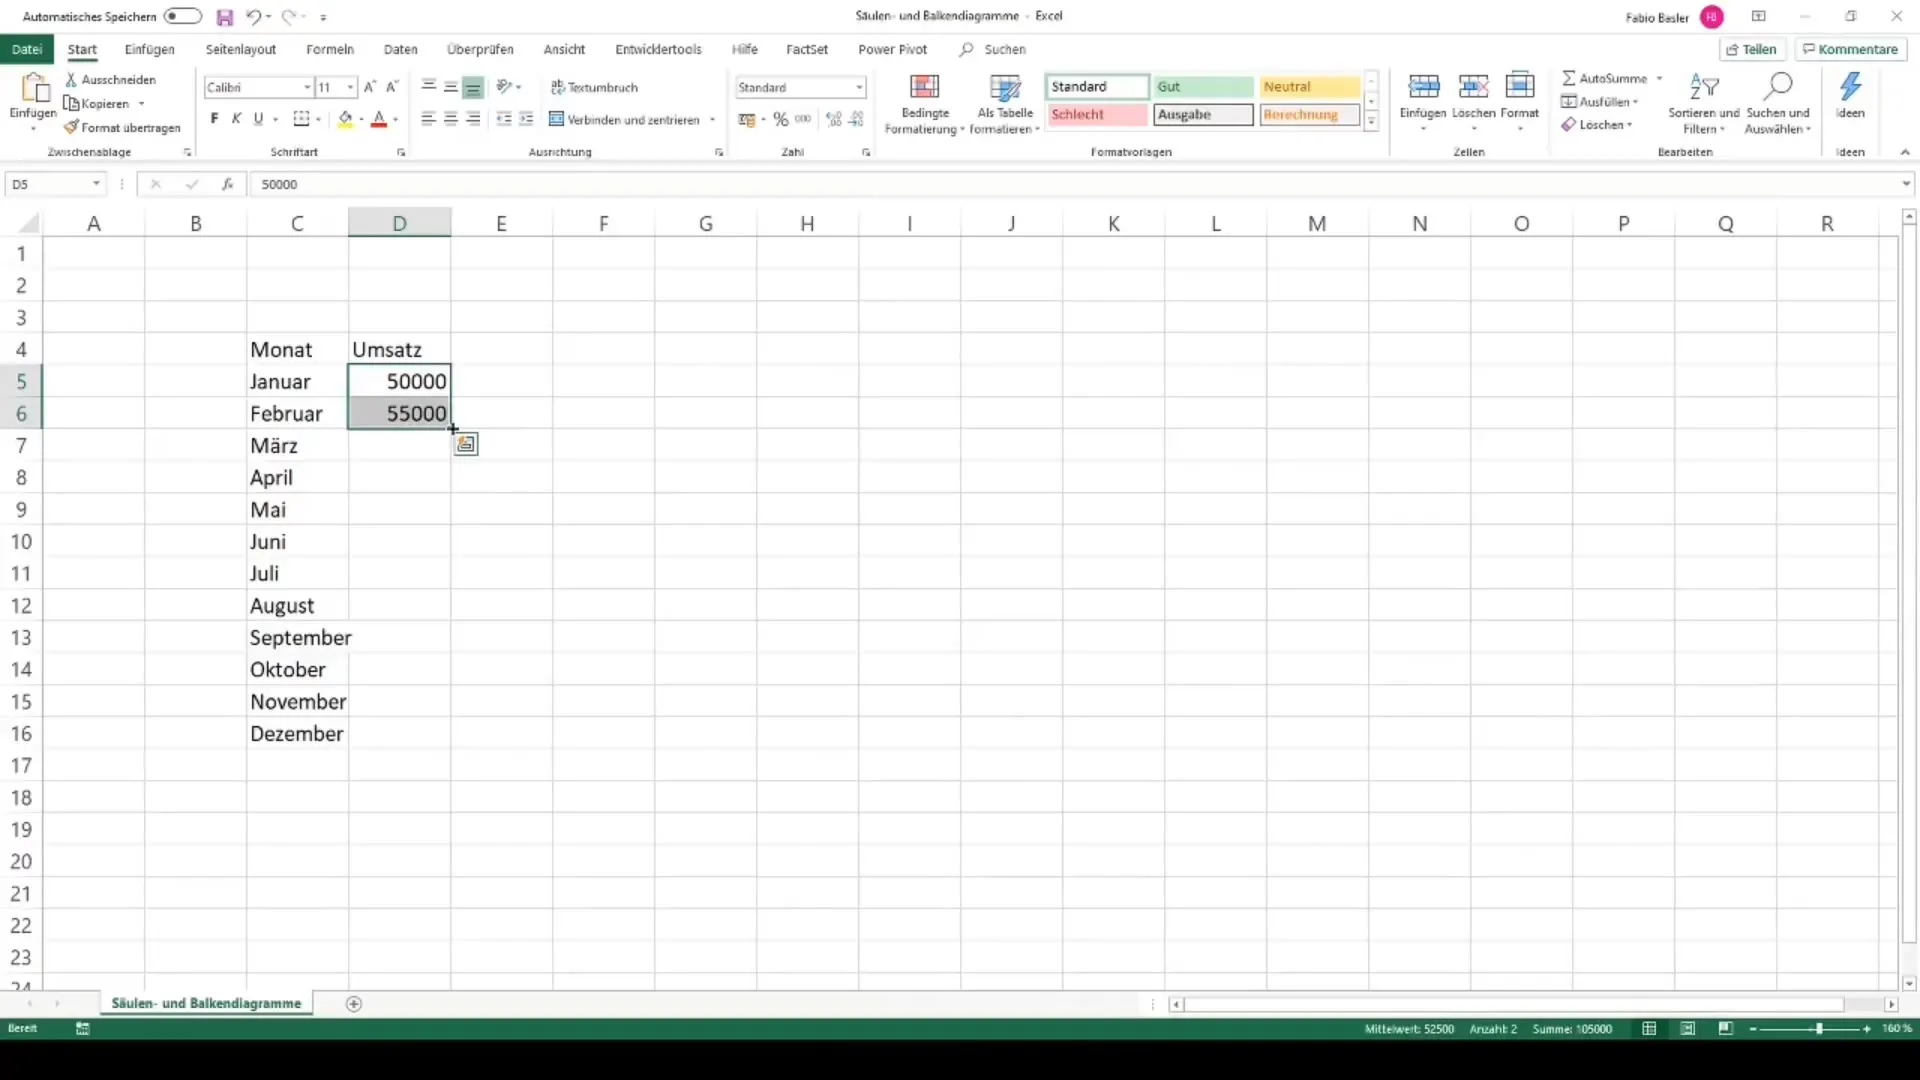
Column and bar charts are useful for comparing values. To create these types of charts, select your data and go back to the "Insert" tab. Then choose "Column" or "Bar". Remember to edit the axis labels and legends to improve readability.
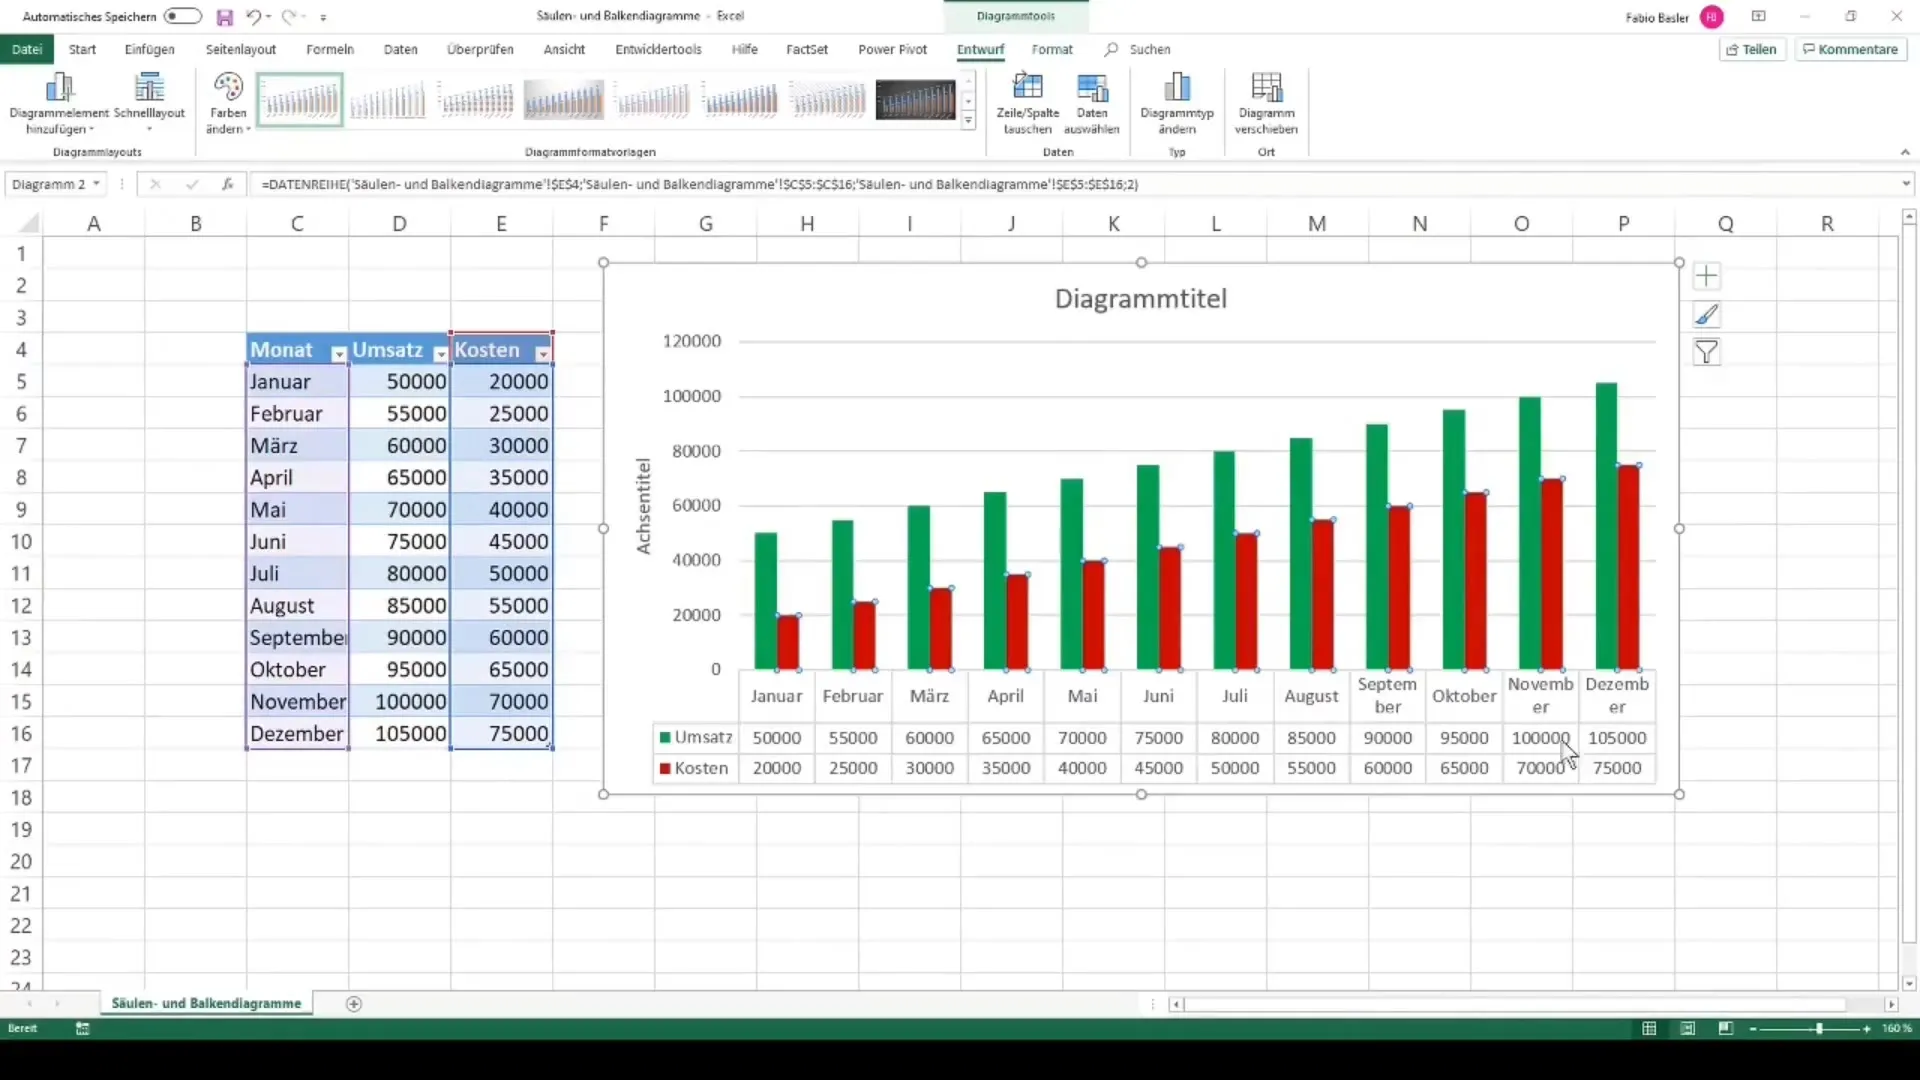
Pie and donut charts are ideal for representing proportions. The process is similar: select data and choose the chart type. Make sure the percentages add up to 100% to ensure a complete picture.
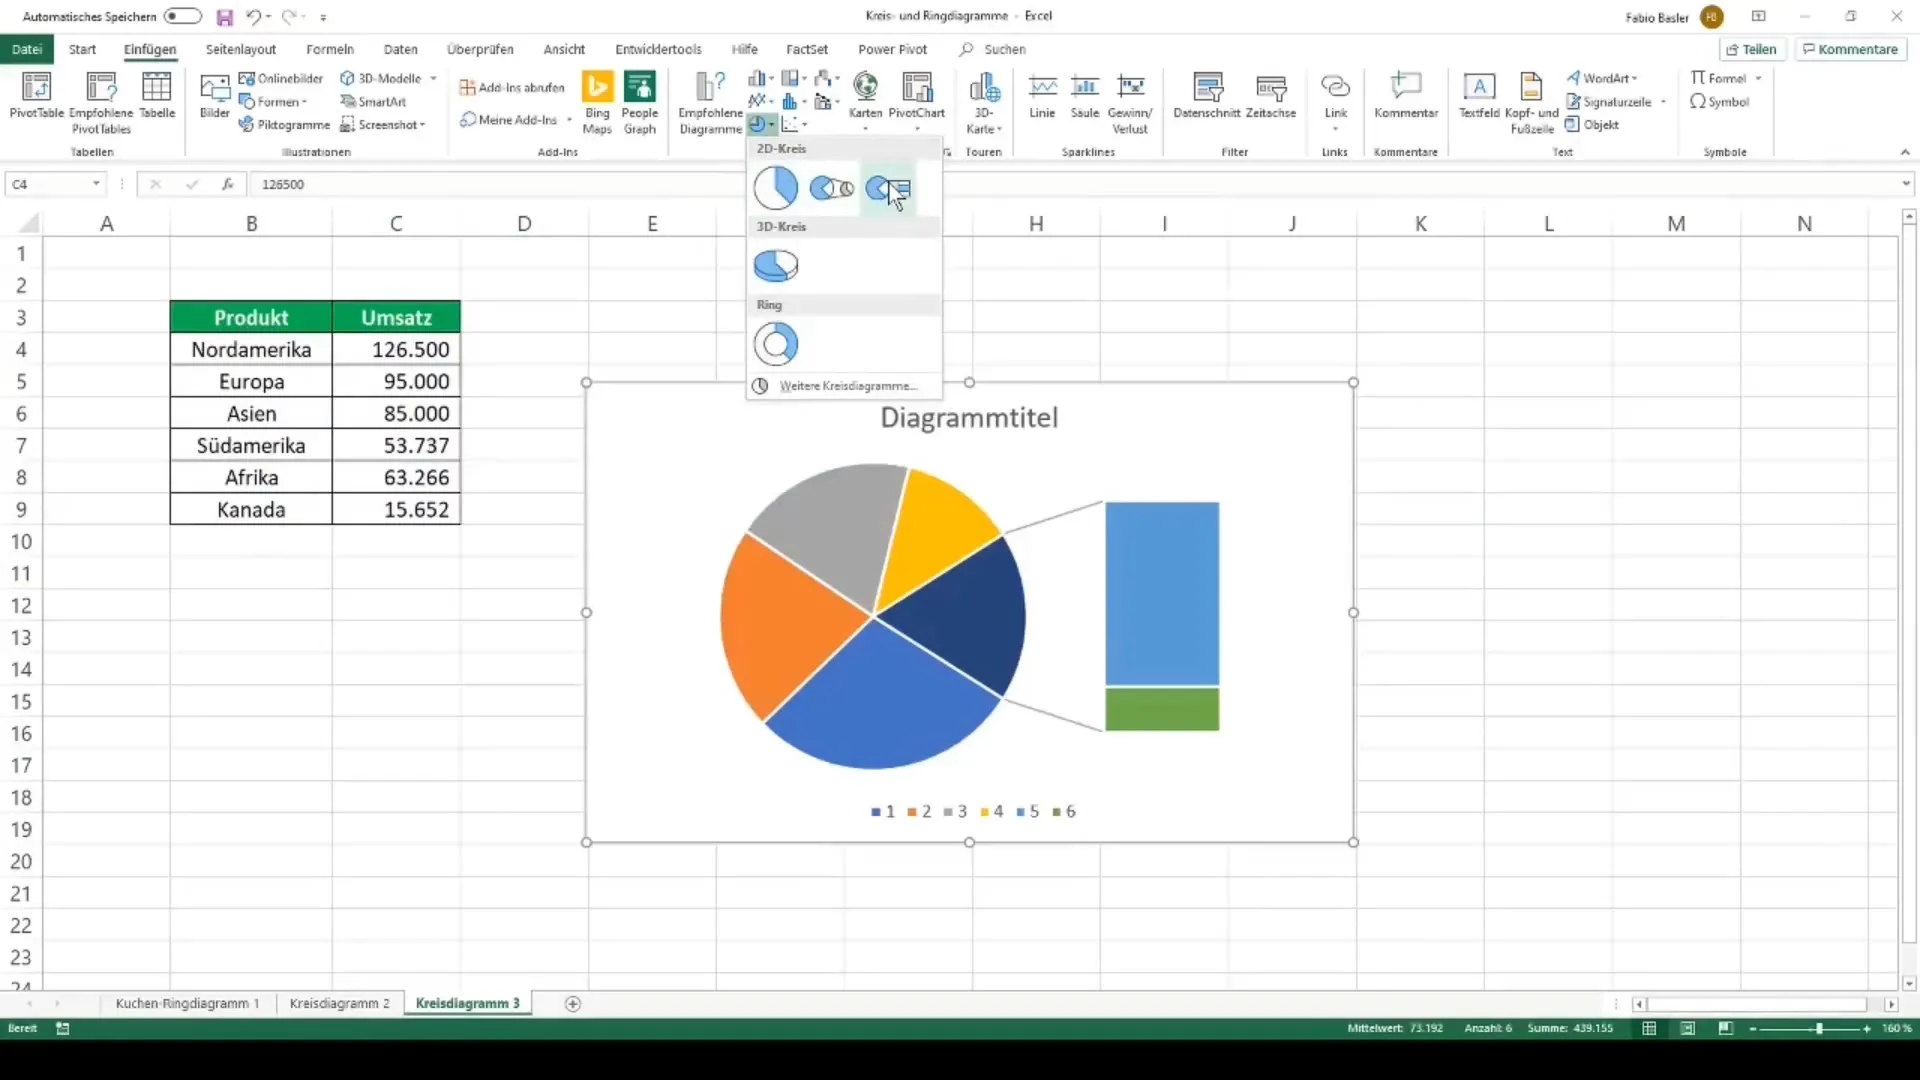
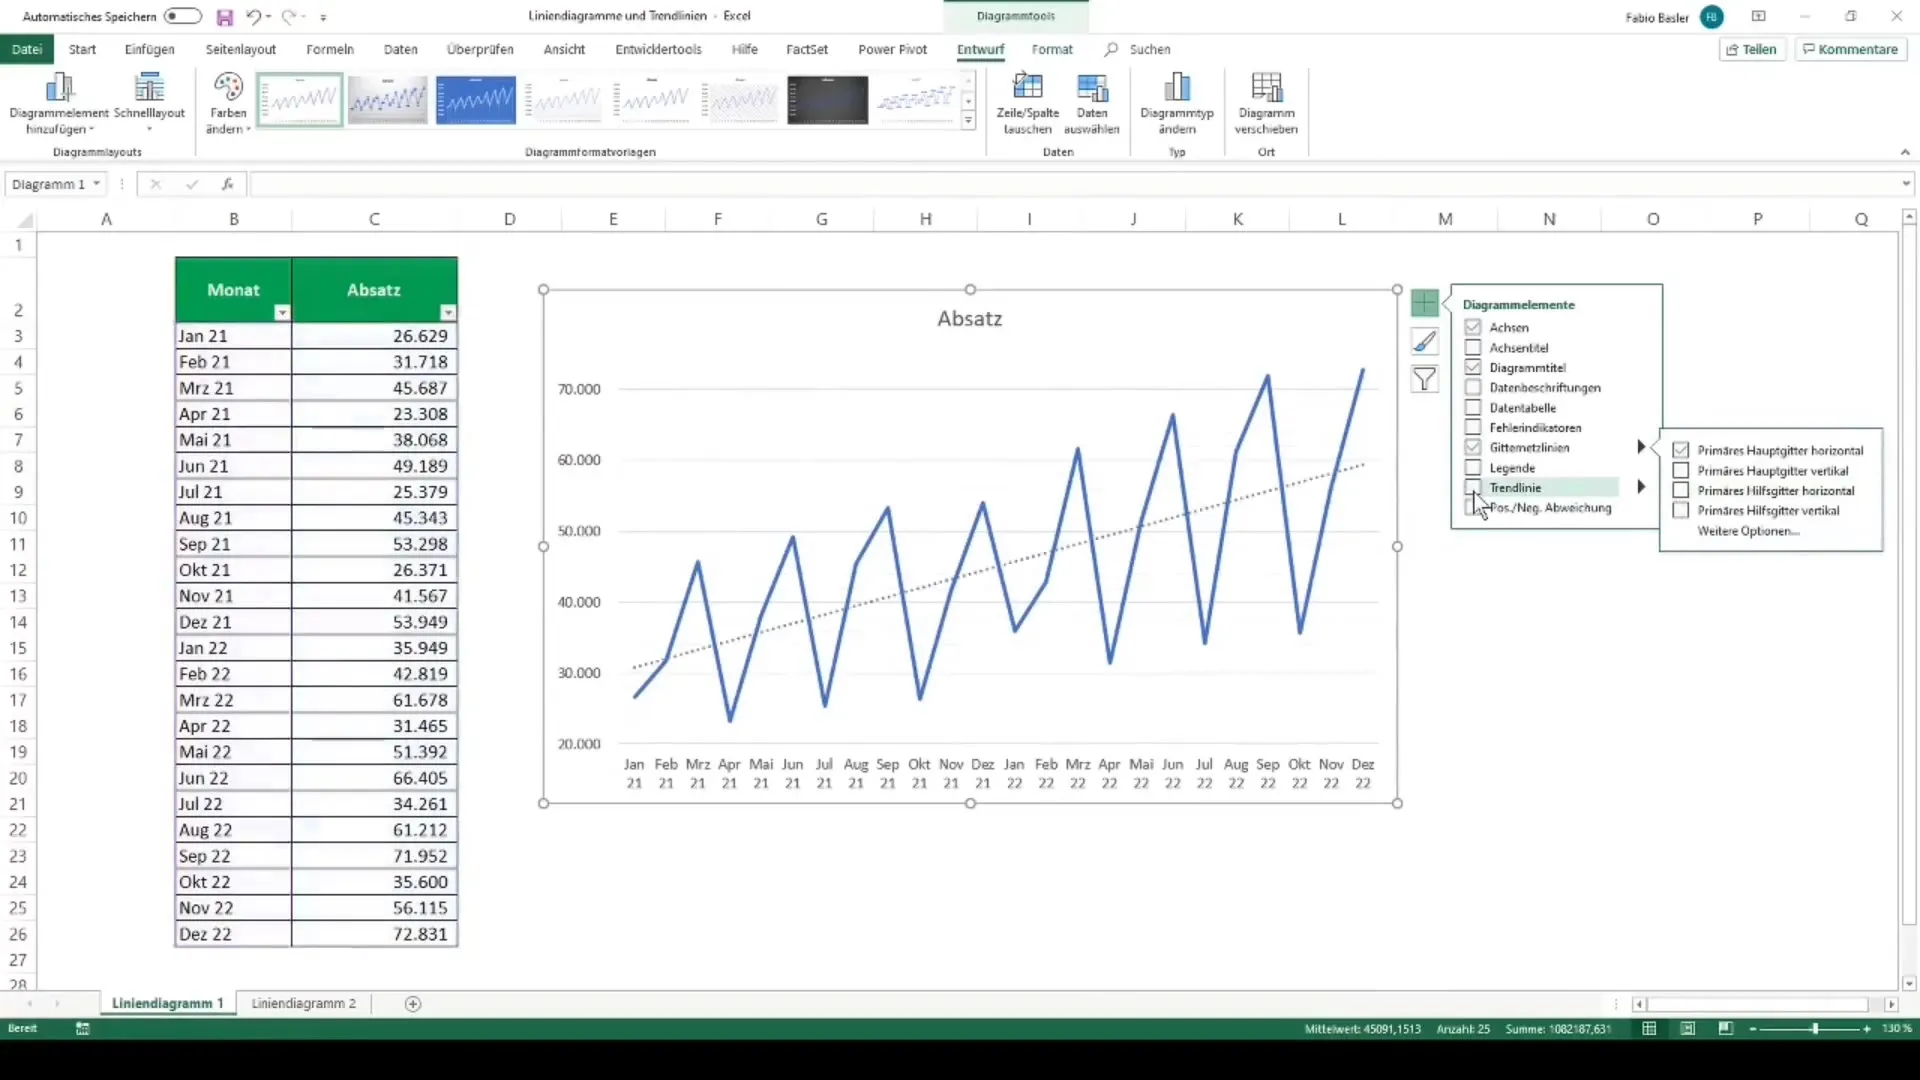
Line charts are great for displaying trends over time. Again, select your data and add the line chart. To refine your analysis, you can add trendlines, which help highlight overall trends in the data.
Advanced Visualizations
Once you have mastered the basic chart types, you can delve into advanced techniques.
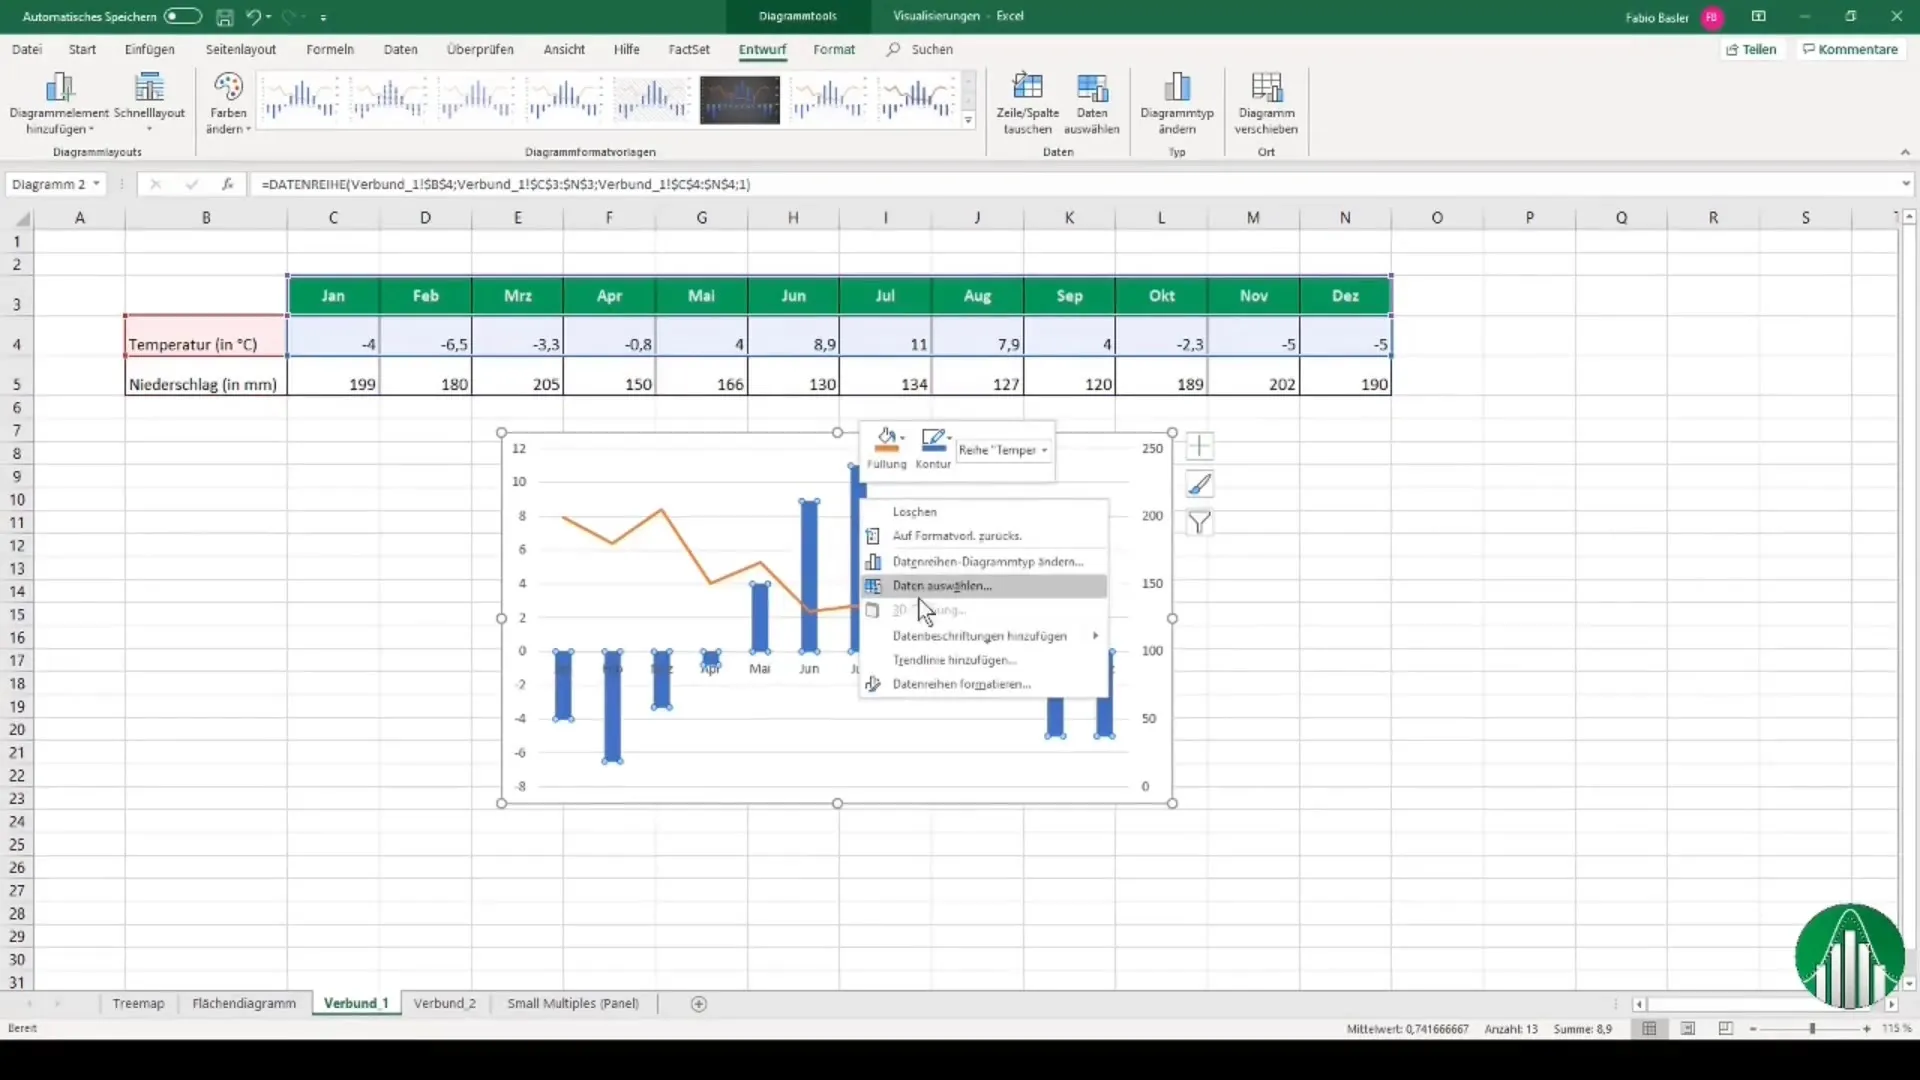
Combo charts allow you to visualize multiple data sets in one chart. This can be particularly useful when comparing different types of data. Make sure to clearly differentiate between the different chart types.
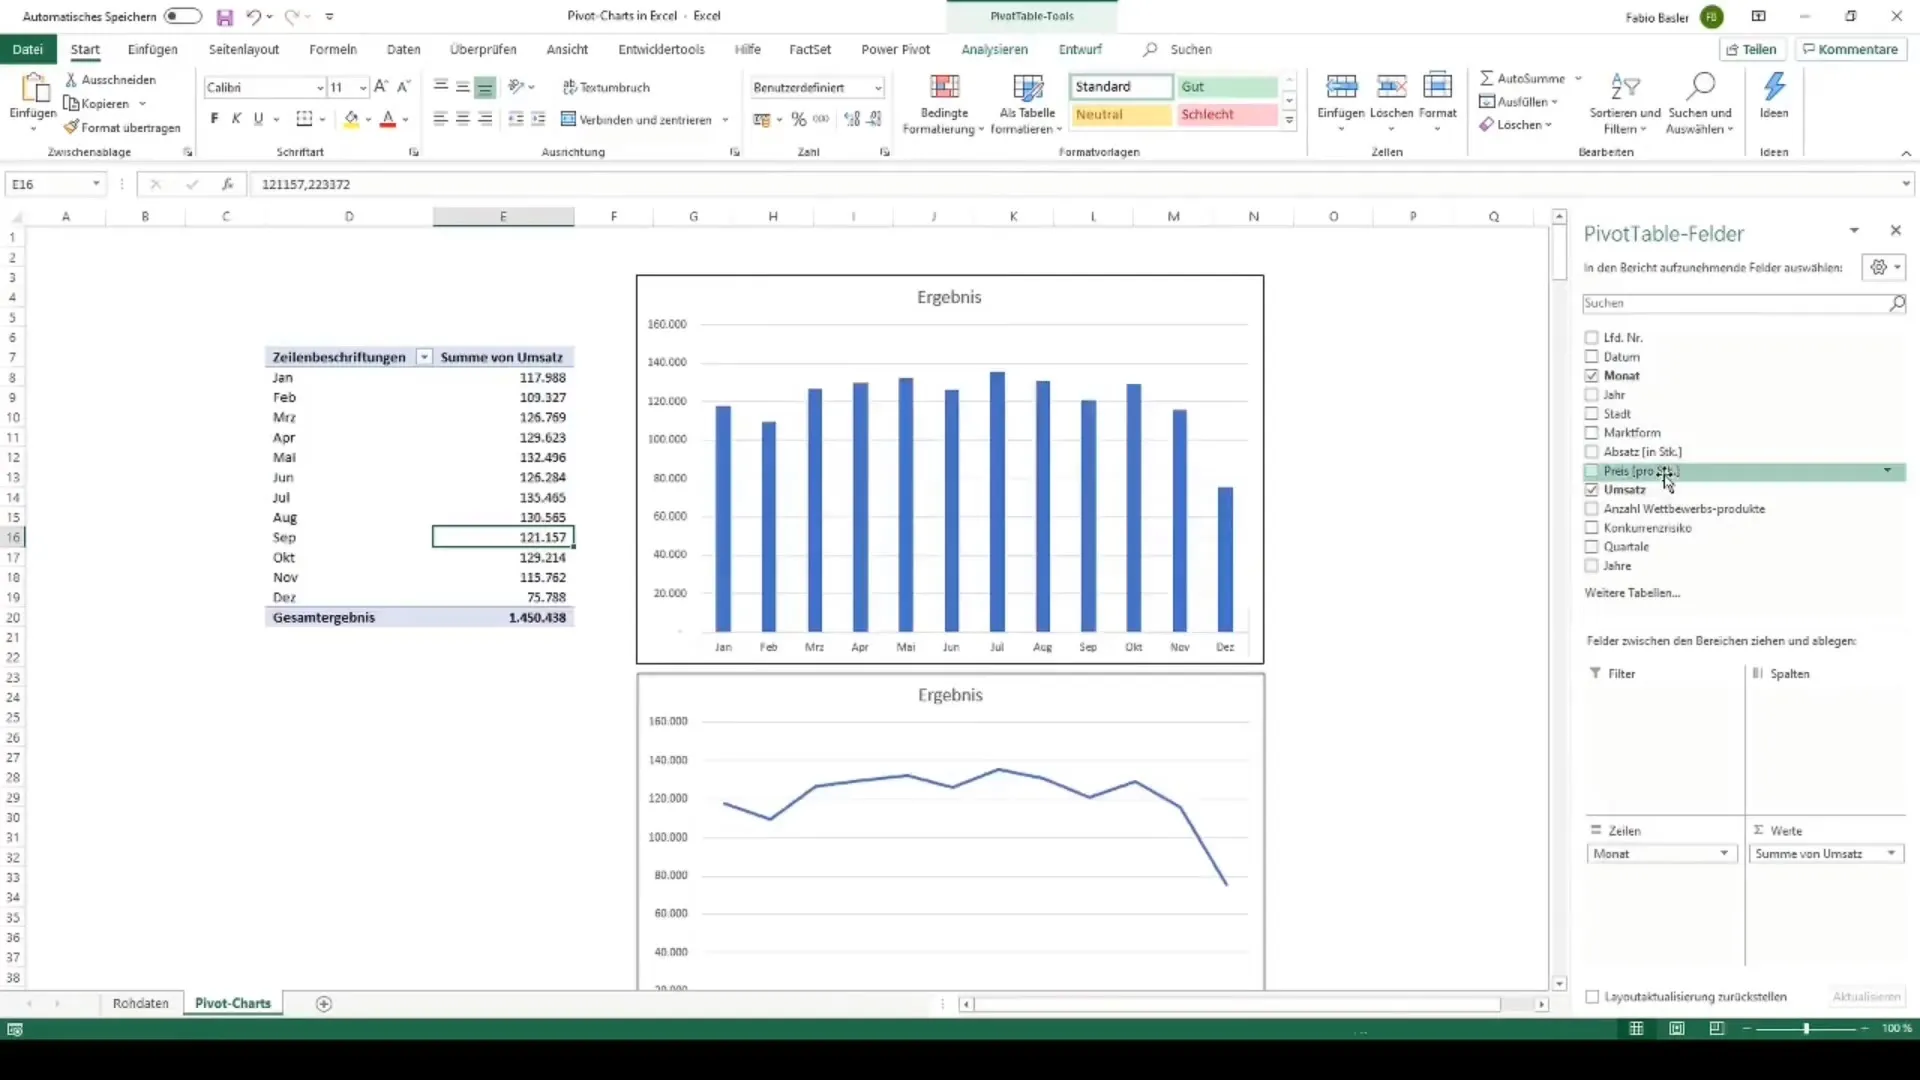
Pivot charts provide the ability to dynamically visualize data coming from a pivot table. This allows you to analyze and present large amounts of data efficiently.
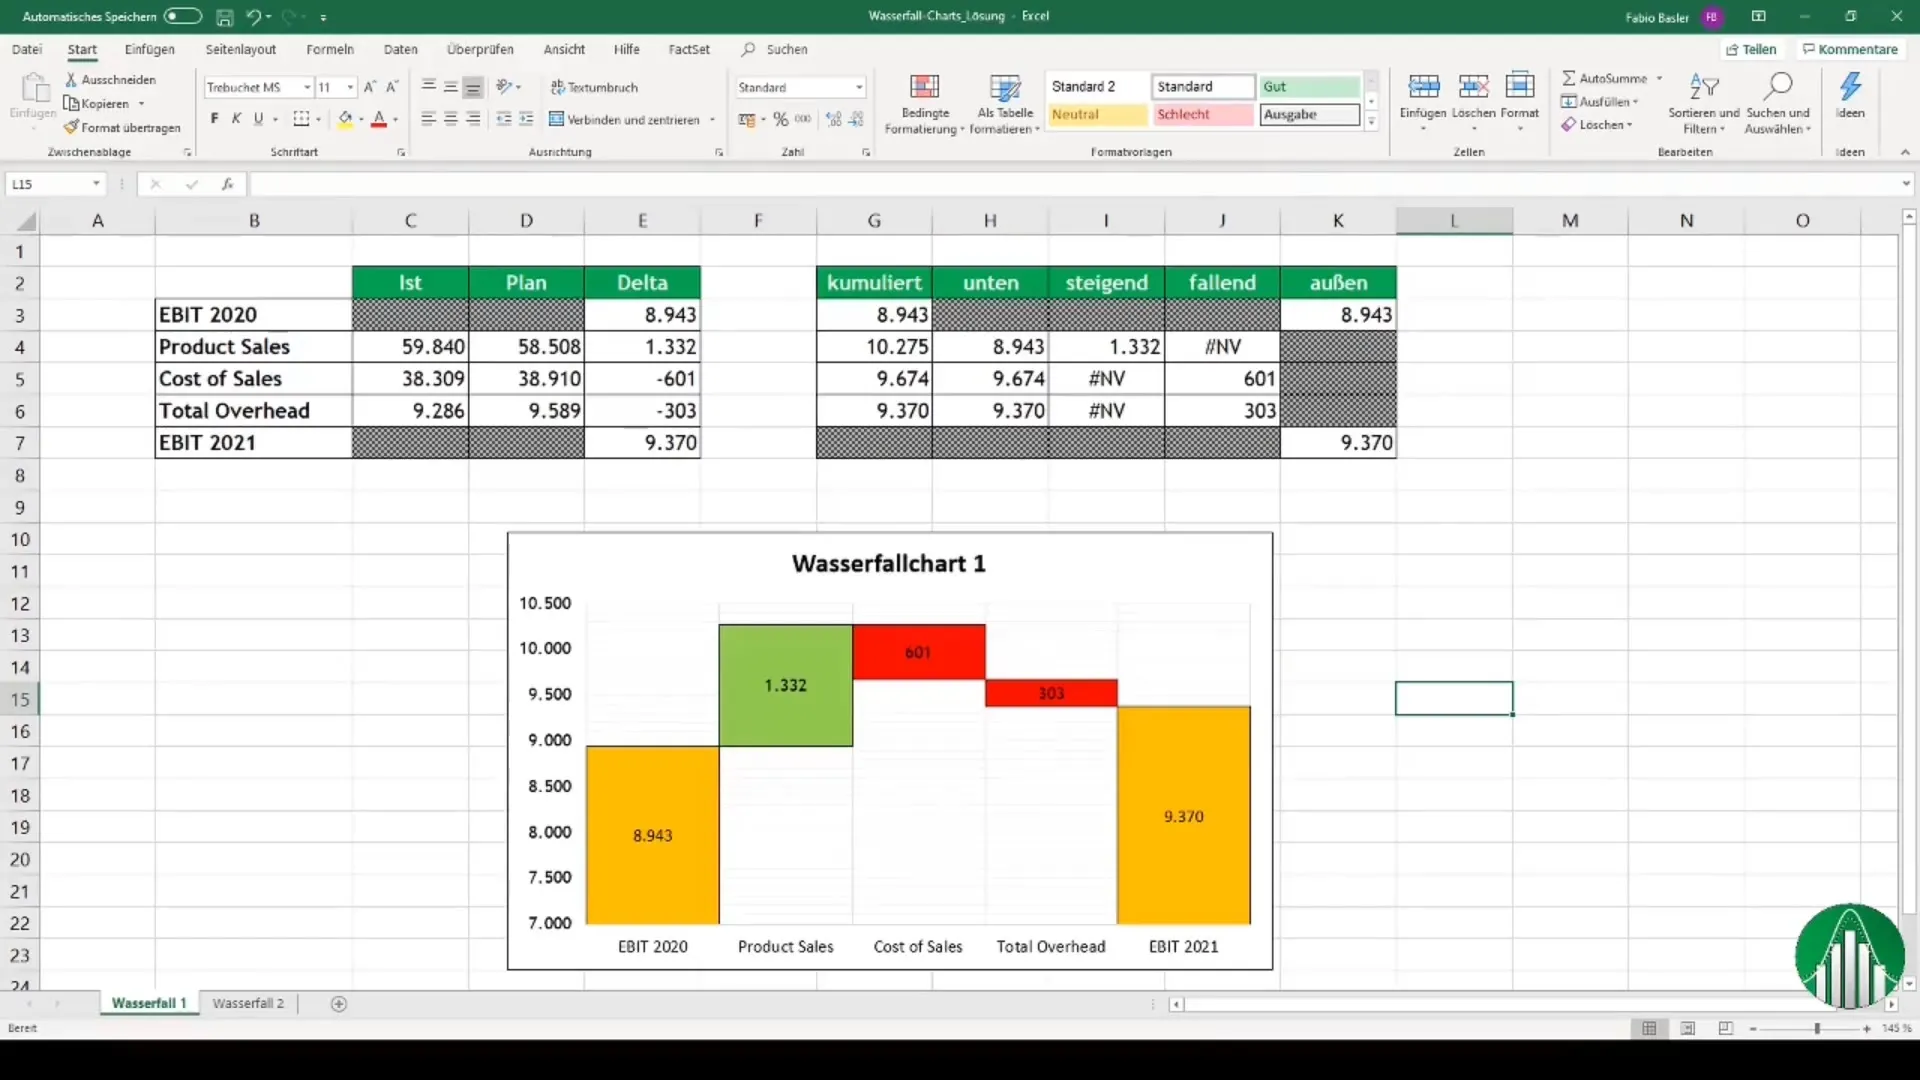
When using waterfall charts, you can graphically represent changes between two values. These charts are particularly useful in reports to provide an overview of gains and losses.
Applying and Linking Charts
Effective handling of charts involves not only their creation but also linking them to other applications. Excel allows you to easily integrate charts into Word documents or PowerPoint presentations. This can be helpful when you want to present or share your results.
Summary
In this tutorial, you have learned how to create and customize various types of charts in Excel. The basic steps include selecting data, deciding on the chart type, and adjusting the design for better readability. You have also gained an overview of advanced visualizations and the ability to link charts with other applications. Now you are ready to create impressive data visualizations with Excel!
Frequently Asked Questions
How do you create a simple chart in Excel?Select the desired data, go to "Insert," and choose the desired chart type.
Which chart types are best for beginners?Column, bar, and pie charts are suitable for beginners.
Can you integrate charts into Word or PowerPoint?Yes, you can easily copy and paste charts from Excel into Word or PowerPoint.
How can I customize my charts?Activate the chart tools by clicking on the chart and edit the design as well as the colors.
What are pivot charts and how do they work?Pivot charts are charts created from pivot tables to dynamically visualize data.

