Visualizations are crucial when it comes to presenting information clearly and engagingly. One way to achieve this is by using SmartArt graphics in Excel. These special diagrams are particularly helpful in presentations, allowing you to present complex information in an easily understandable form. In this guide, you will learn how to insert and customize SmartArt models in Excel to visually present your data.
Key Takeaways
- SmartArt models are graphic representations that work without an underlying data source.
- The selection of SmartArt elements ranges from lists, processes, cycles, hierarchies, and more.
- Adjustments such as text editing, color changes, and resizing are straightforward.
- SmartArt graphics can be easily transferred between Excel and PowerPoint.
Step-by-Step Guide
1. Insert SmartArt Graphics
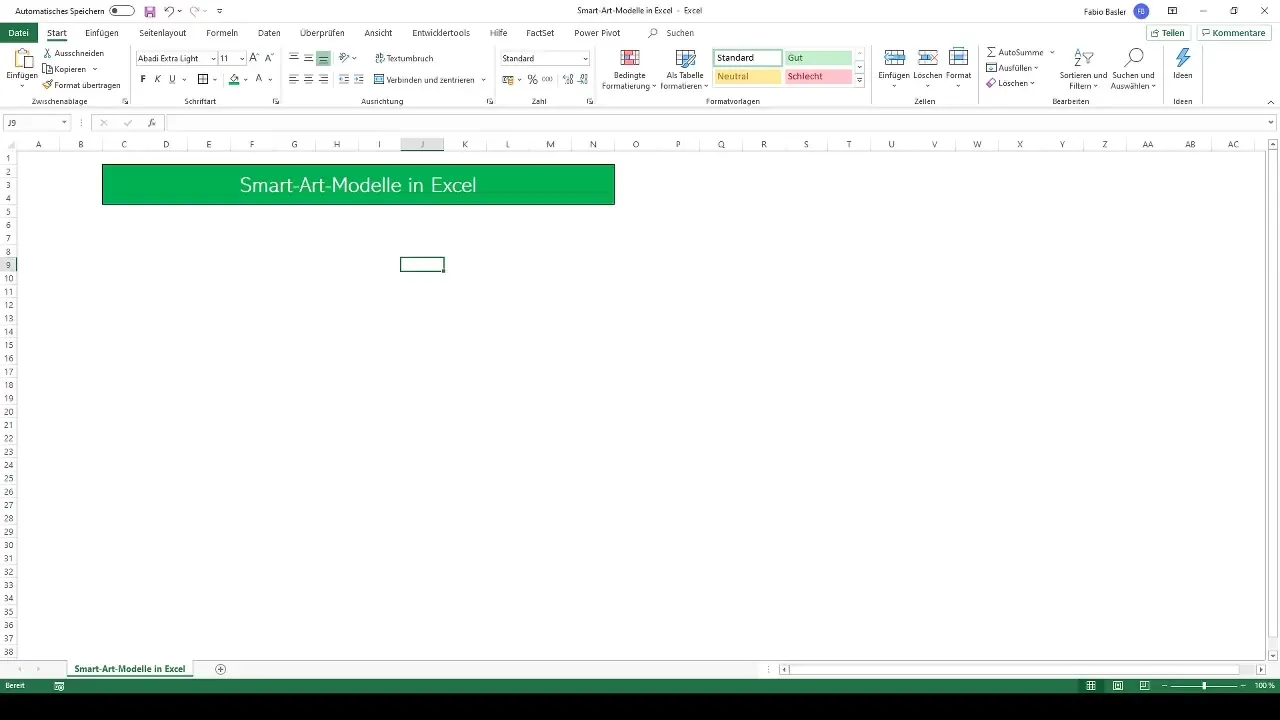
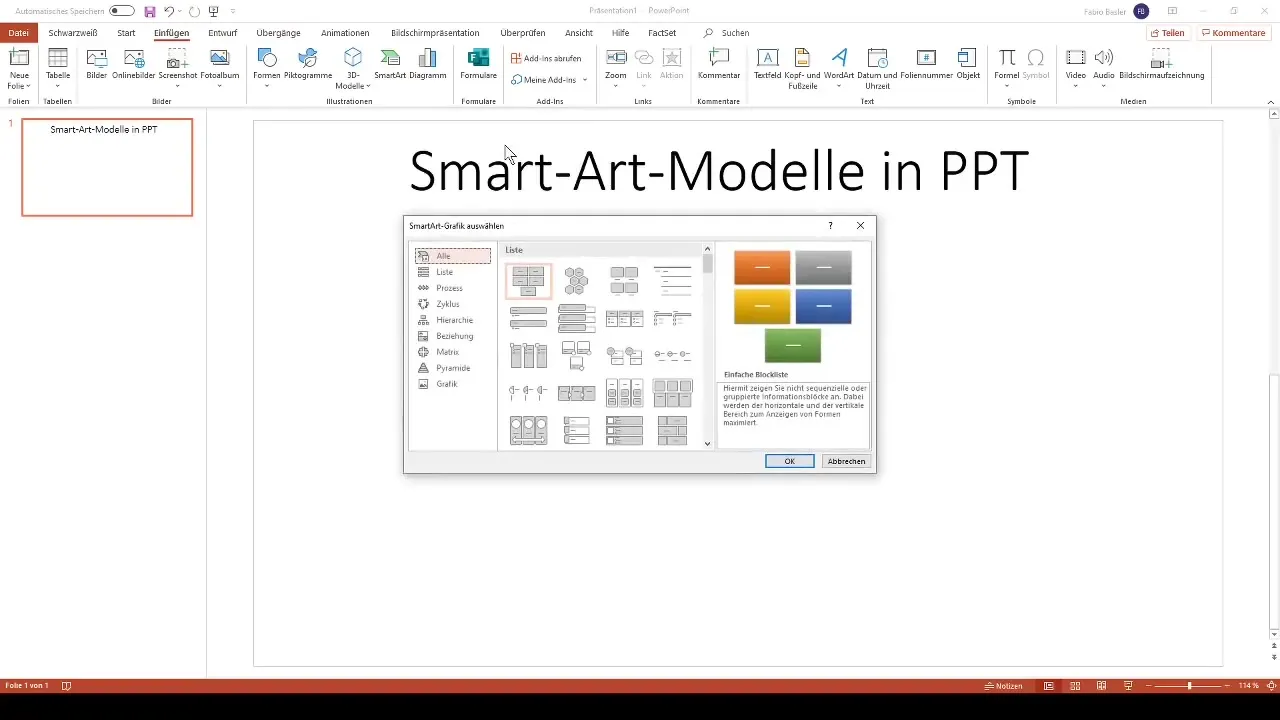
To insert a SmartArt graphic in Excel, first open the application and navigate to the menu bar. Click on the "Insert" tab. There you will find the option "SmartArt," which allows you to select and insert various graphics.
2. Choose the SmartArt Model
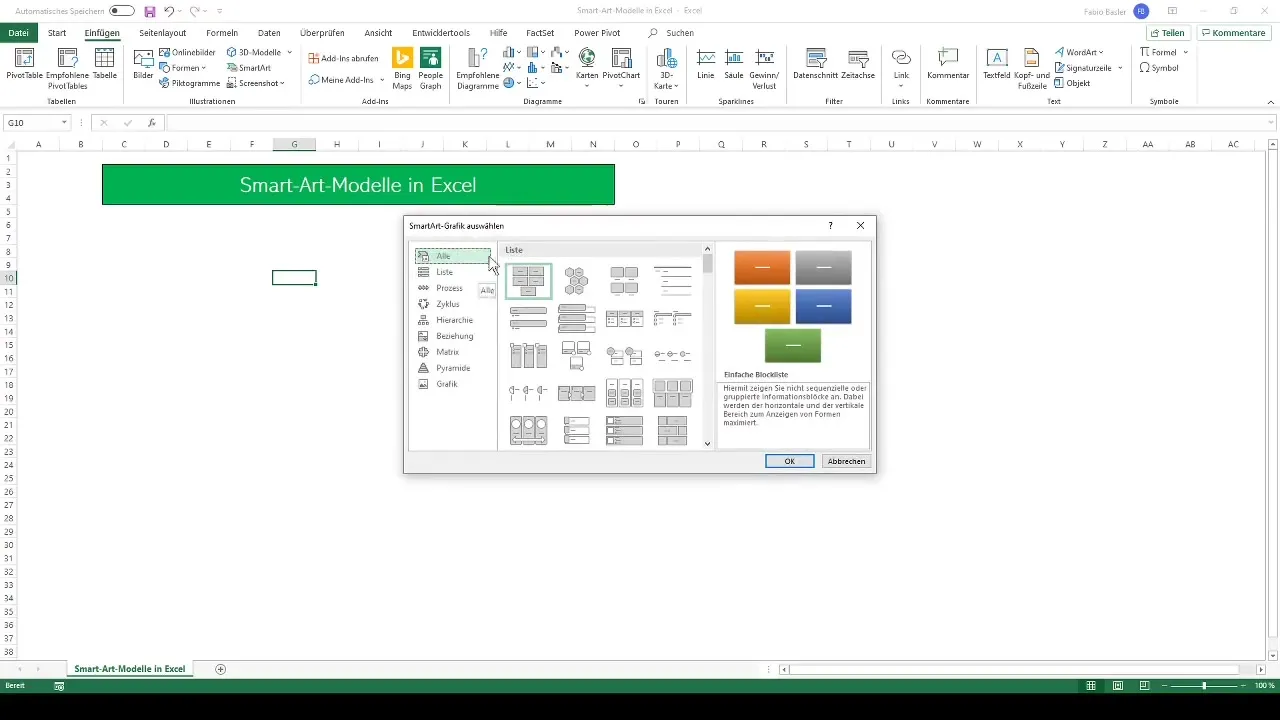
After clicking on "SmartArt," a window will open showing you a variety of graphics. These are divided into different categories, including lists, processes, cycles, and hierarchies. Select the category that best suits your needs. For example, you can choose "List" to create a simple enumeration.
3. Edit the SmartArt Graphic
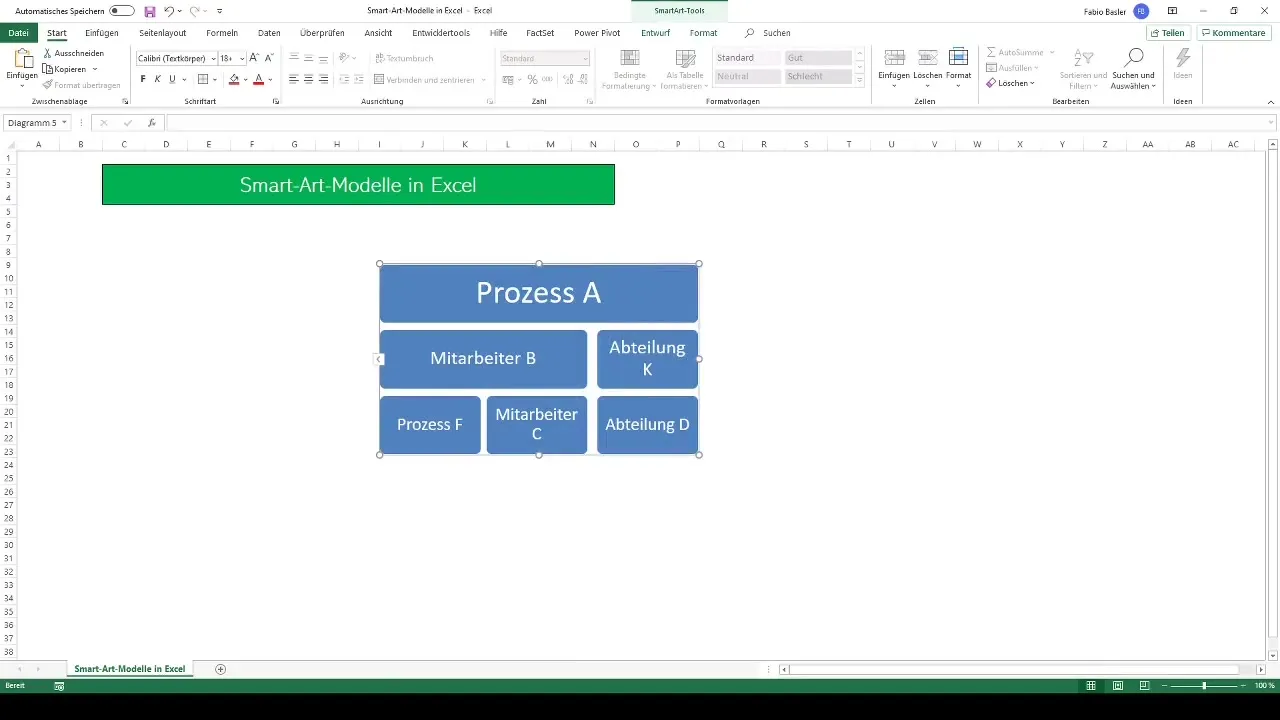
Once you have selected a SmartArt model, you will see it in your Excel document. In the next step, you can fill the graphic with texts. Simply click into the existing text fields and enter the information you want to present. If you are presenting a list or a process, add the corresponding elements one after the other.
4. Customize Colors and Design
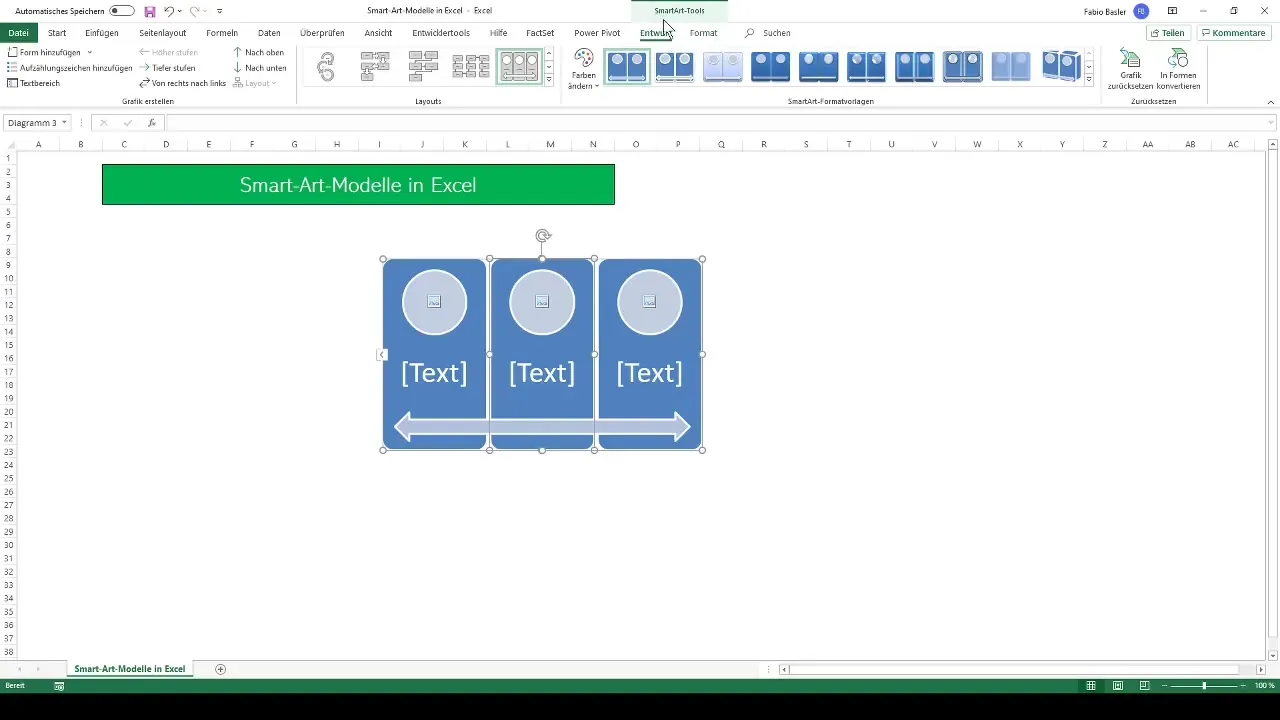
An important aspect of SmartArt is the ability to customize the graphic representation. Click on the SmartArt object, and the "SmartArt Tools" will open in the menu bar. Here you can change colors as well as edit the text area. Experiment with different color palettes to make your graphic visually appealing.
5. Change Size and Position
You can also adjust the size of your SmartArt graphic. Click on the graphic and drag the corners to resize it. You can also simply move it to the left or right to optimize its position in your document. Ensure that the graphic is well placed in the overall context of your table or presentation.
6. Insert Images
To make your SmartArt graphic even more appealing, you can insert images. Go back to the editing options of your SmartArt and choose the option to add images. This can be particularly effective when visualizing a process or concept.
7. Transfer to PowerPoint
Additionally, after creating your SmartArt graphic in Excel, you may want to use it in a PowerPoint presentation. You have the option to copy the graphic and paste it into PowerPoint. Alternatively, you can also take it over as an image or design in PowerPoint.
8. Application in PowerPoint
If you want to further edit your SmartArt graphics in PowerPoint, you can use the same steps as in Excel. PowerPoint offers the same options for inserting and customizing SmartArt graphics, allowing you to work seamlessly between the two programs. This facilitates the creation of coherent presentations that are visually appealing with visual elements.
Summary
In this guide, you have learned how to effectively insert, customize, and integrate SmartArt models in Excel and PowerPoint. Whether for simple lists or complex process overviews, SmartArt offers you a flexible way to visualize your data. Use the presented steps to present your information in an appealing and clear manner.
Frequently Asked Questions
How do I create a SmartArt graphic in Excel?Go to "Insert", click on "SmartArt" and choose the desired model.
Can I insert images into SmartArt?Yes, you can integrate images into the SmartArt graphic to make it more visually appealing.
How do I change the colors of my SmartArt graphic?Click on the graphic and use the "SmartArt Tools" in the menu bar to adjust the colors.
Can I use SmartArt graphics in PowerPoint?Yes, you can copy SmartArt graphics from Excel and paste them into PowerPoint.
Are SmartArt graphics data-driven?No, SmartArt graphics are not based on underlying datasets, but are manually editable.


