With Excel, you can not only analyze data but also create impressive dashboards. One of the functions that helps you with this is PowerView. In this guide, you will learn how to activate and use PowerView to create interactive reports that present your data optimally.
Key Insights
- PowerView is an interactive visualization technology in Excel that has been available since Office 2016.
- You can activate PowerView and add it to the ribbon to access and create reports.
- PowerView allows for creating dynamic dashboards, but in more complex application scenarios, it is often surpassed by Power BI.
Step-by-Step Guide
First, make sure you are using the correct version of Excel to utilize PowerView features. Ensure you have Office 2016 or newer.
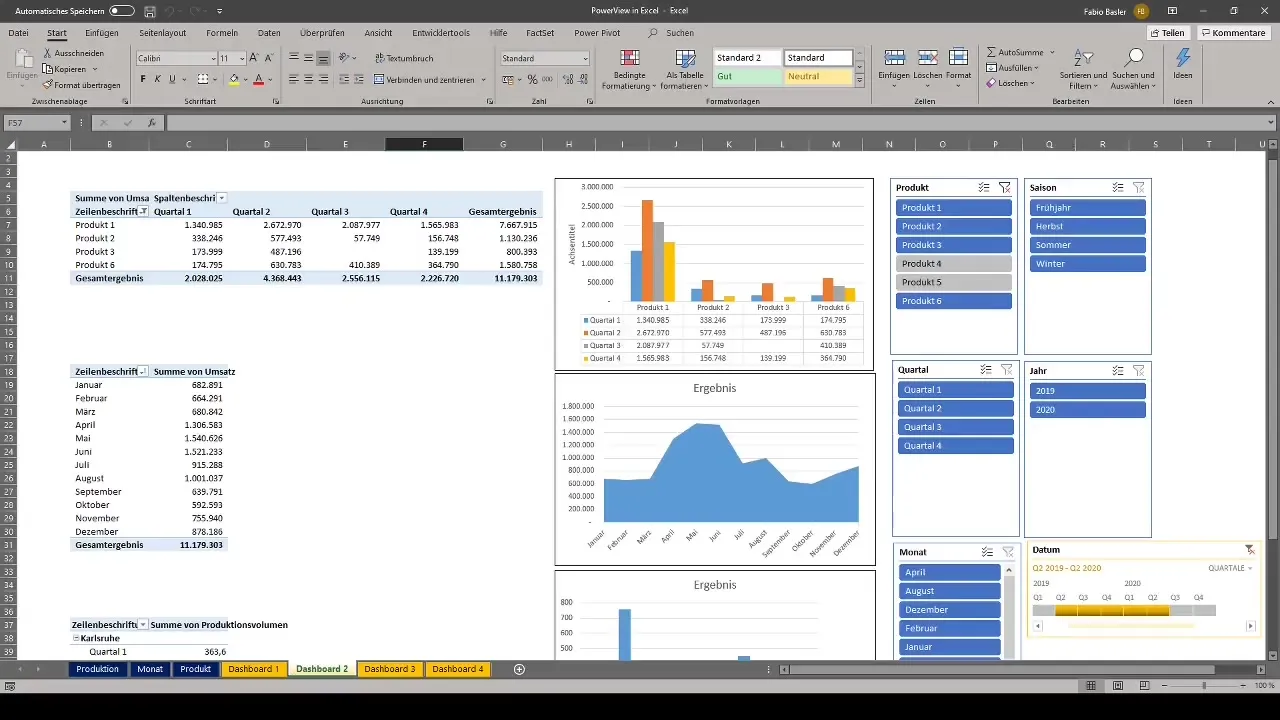
Step 1: Activate PowerView
To activate PowerView in your Excel application, go to "File" and then "Options." Here you will find the option to manage various add-ins.
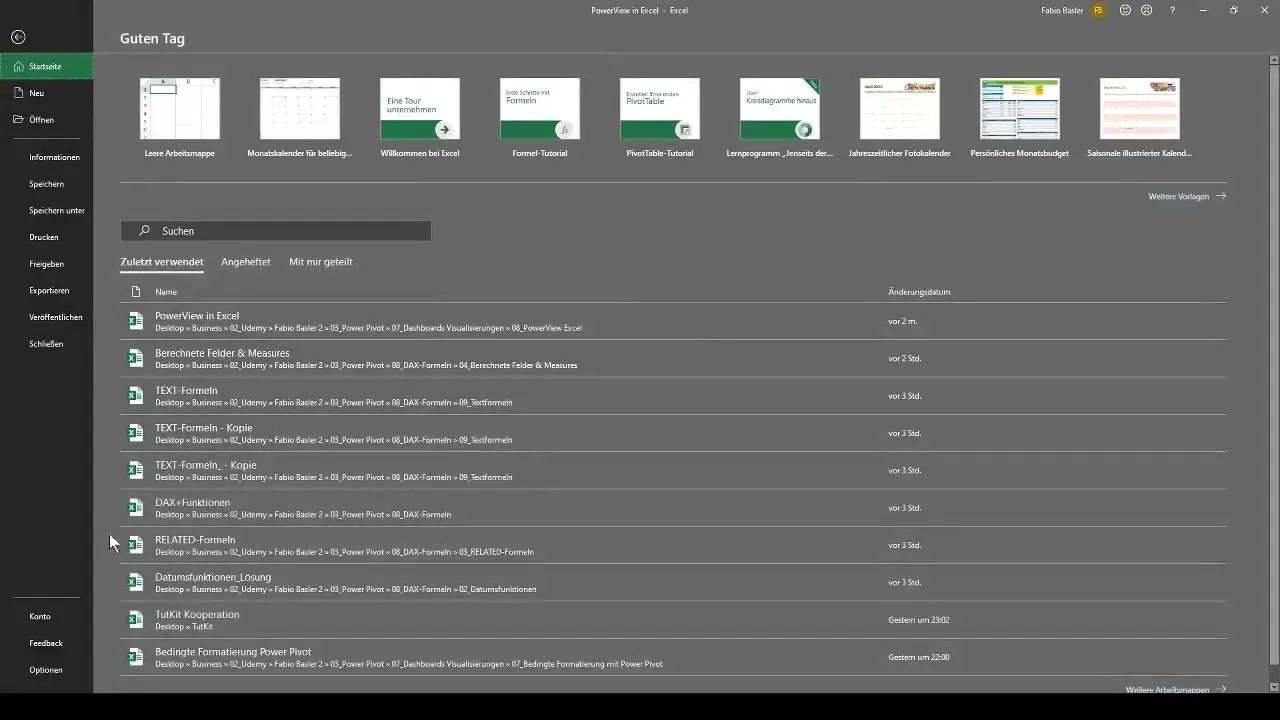
Step 2: Customize the Ribbon
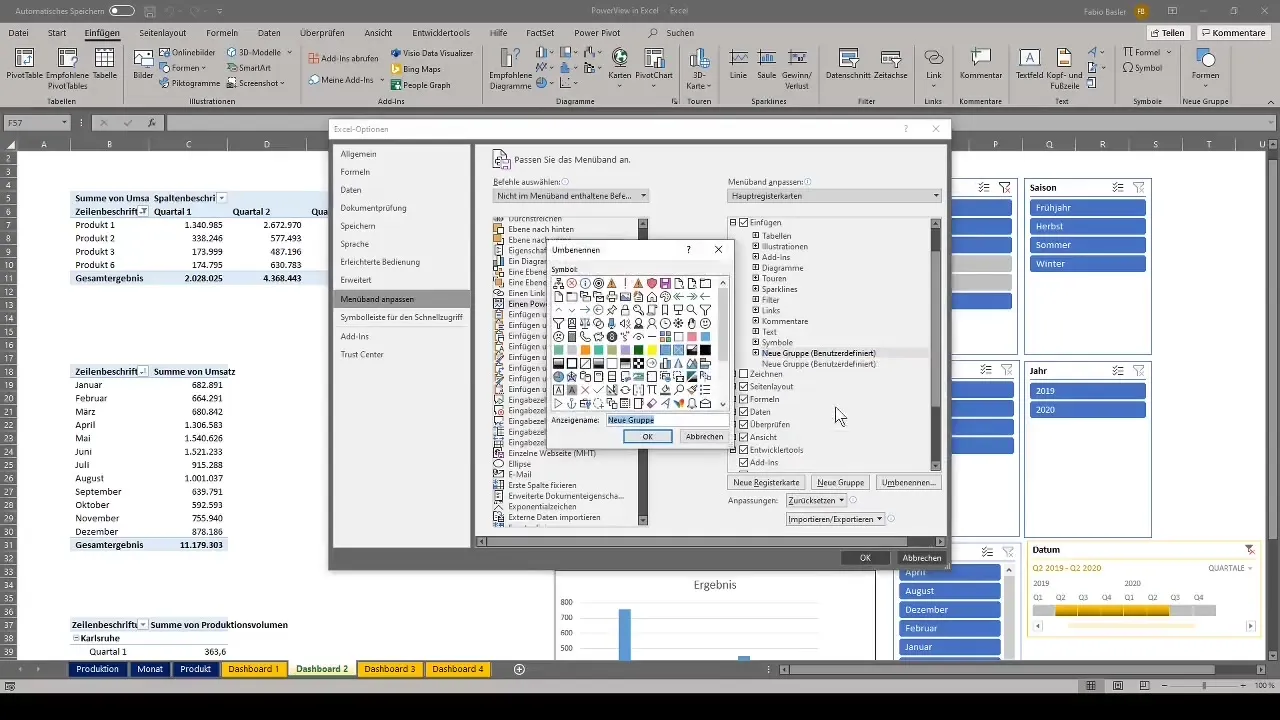
Within the options, navigate to "Customize the Ribbon." Here you can add various commands and functions that are not included in the ribbon by default. Right-click on the ribbon and choose "Customize the Ribbon."
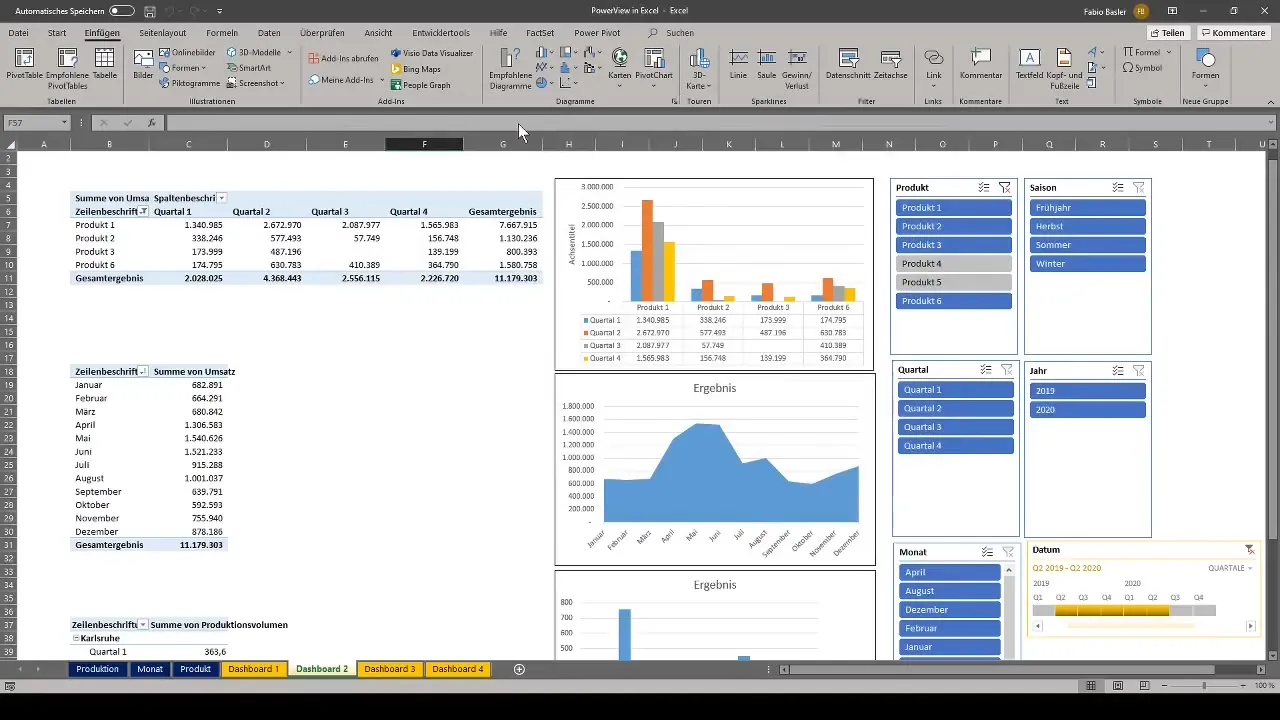
Step 3: Add PowerView to the Symbol List
Look for the PowerView function among the commands not included in the ribbon. It is sorted alphabetically. Once you have found the function, you can add it to your ribbon list by creating a new group.
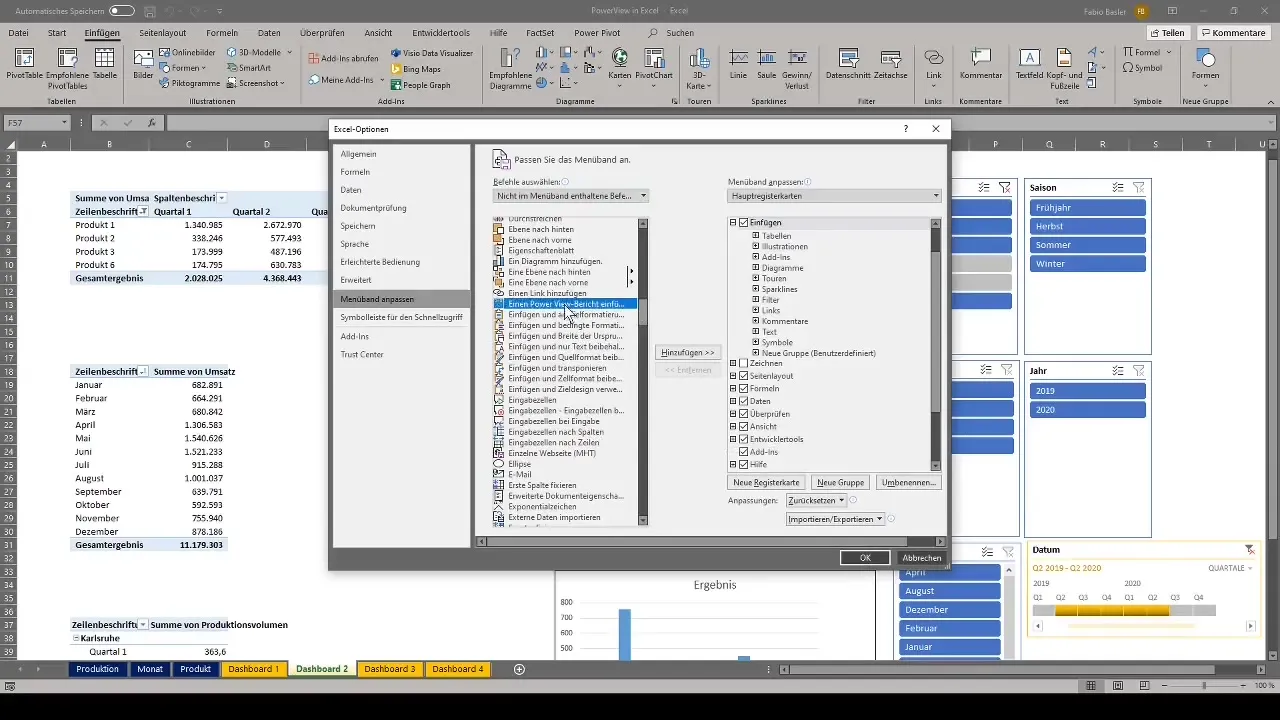
Step 4: Name the Group and Symbols
Name the new group as you wish, for example, "PowerView." You can also choose an icon for this group to make it easier to identify in the ribbon.
Step 5: Start PowerView
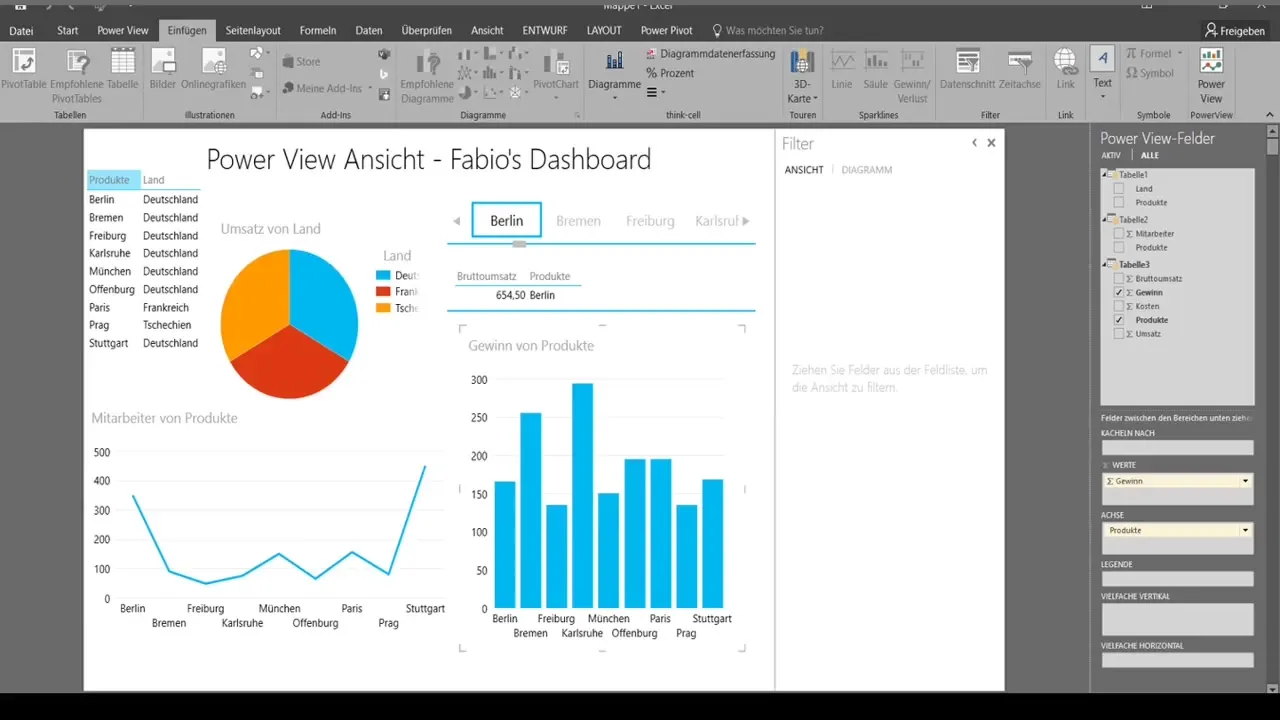
After adding PowerView to the ribbon, go back to your Excel dashboard. Click on the "PowerView" button to open the interactive dashboard interface.
Step 6: Design Reports
Now you can start designing your reports. The PowerView interface offers various visualization options. You can navigate through the field list to select the data sources you want to visualize.
Step 7: Create Visualizations
Use the field buttons to connect the declarative data and create the desired visualizations. PowerView allows you to add interactive elements that engage users and facilitate data analysis.
Step 8: Optimize Reports
Keep in mind that PowerView may occasionally have stability issues, especially with complex reports. If you are not satisfied with the user interface and capabilities of PowerView, consider switching to Power BI.
Summary
PowerView is a powerful tool for creating interactive and dynamic dashboards in Excel. This guide has shown you the necessary steps to activate PowerView and create professional reports. By following the steps described in this guide, you will quickly be able to visualize your data more effectively.
Frequently Asked Questions
How do I activate PowerView in Excel?You activate PowerView under "File" > "Options" > "Customize the Ribbon" and add it.
Can I use PowerView in older versions of Excel?PowerView is available from Office 2016 onwards. Older versions do not support this function.
Why should I use Power BI instead of PowerView?Power BI offers more functionalities and stability when creating complex dashboards.
