Statistical analyses are essential to make informed decisions and predict developments. In this tutorial, you will learn how to apply various statistical methods using Excel to gain data-driven insights. The online course will guide you through three enlightening case studies that illuminate real-world problems and help improve your statistical skills.
Key Takeaways
- Three comprehensive case studies on Portfolio Management, Automotive Suppliers, and Biotechnology.
- Application of descriptive statistics, regression analyses, and hypothesis testing.
- Graphical visualizations and pivot tables to support analyses.
Step-by-Step Guide
Overview of the Case Studies
In the first step, you will get an overview of the three central case studies covered in the course. You will start with the topic of Portfolio Management, followed by an analysis of Automotive Suppliers, and finally Biotechnology. Each case study will help you apply the required statistical methods in a practical context.
Descriptive Statistics in Portfolio Management
The first case study deals with descriptive statistics. Here you will learn how to calculate mean and dispersion indicators to understand central tendencies and variations in your data. You will prepare your data through calculations and analyses. Excel provides you with the necessary tools to efficiently capture the statistics.
Pivot Tables as an Analytical Tool
An important feature of Excel is pivot tables, which help you aggregate and analyze data. In this phase of the case study, you will learn how to use pivot tables to identify relationships in your data. You can easily restructure the data and use pivot functions to visualize different perspectives of the data.

Correlation Calculations and Graphical Visualizations
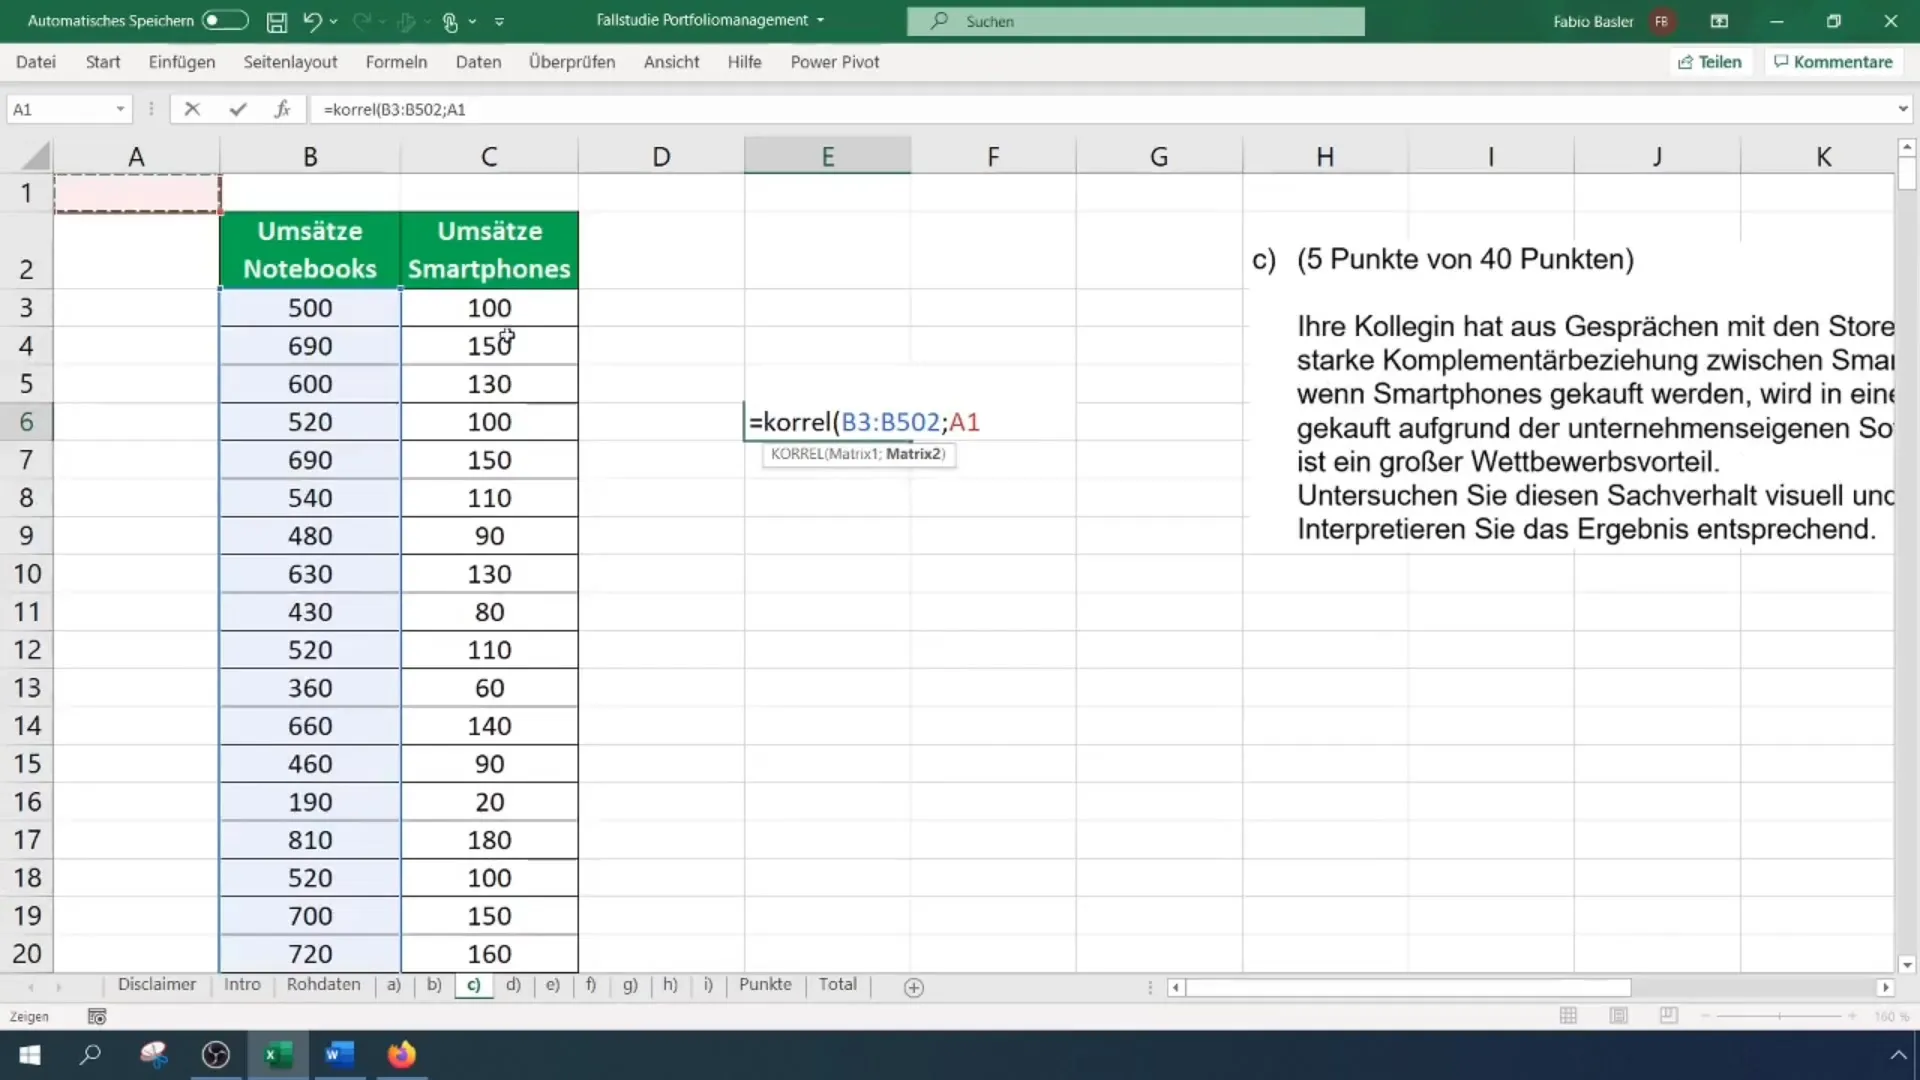
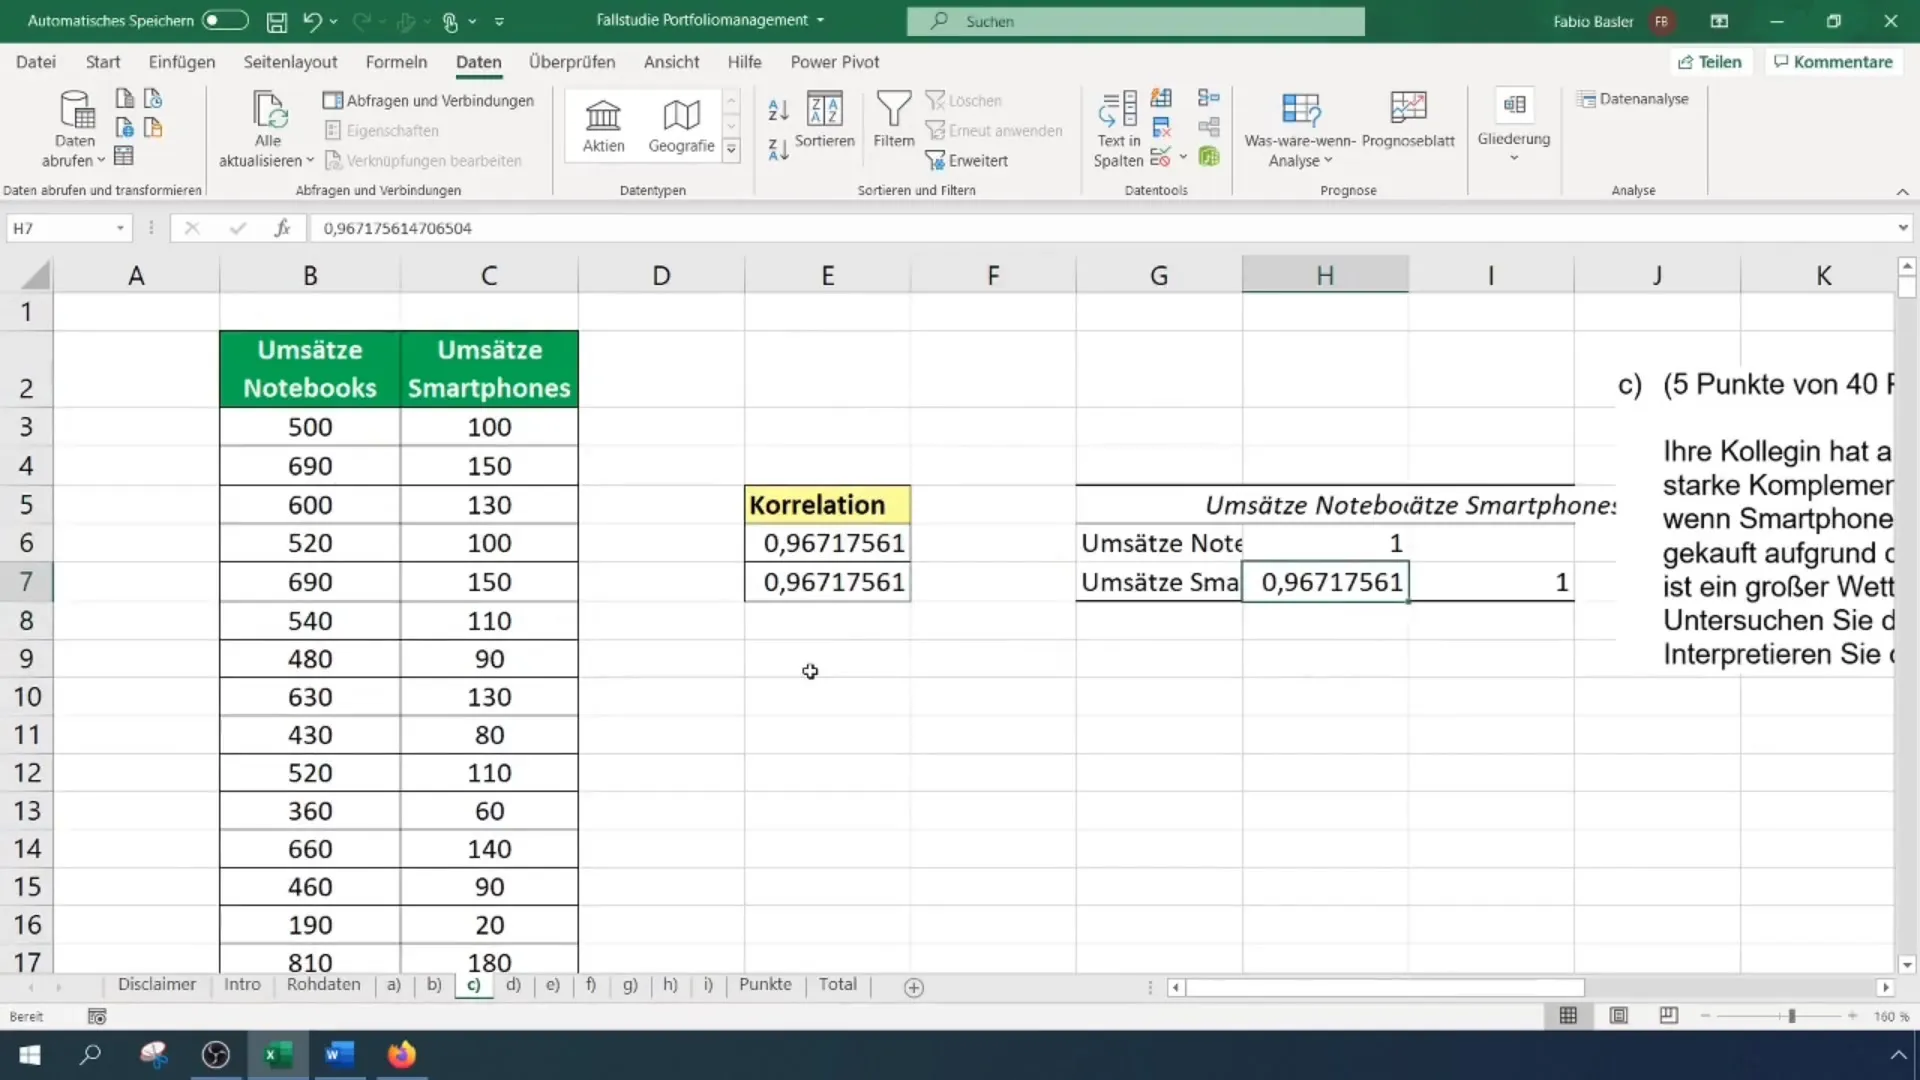
To quantify relationships between variables, you will perform correlation calculations. Excel allows you to easily represent these correlations, enabling you to visually understand important connections. Graphical representations often simplify the interpretation of analysis results.

Conducting Regression Analyses
Another crucial part of the course is conducting regression analyses. You will learn how multiple independent variables can influence a dependent variable. You will also learn how to use Excel resources to calculate regression coefficients. These analyses will help you identify patterns and trends in your data.
Time Series Analysis in the Automotive Supplier Sector
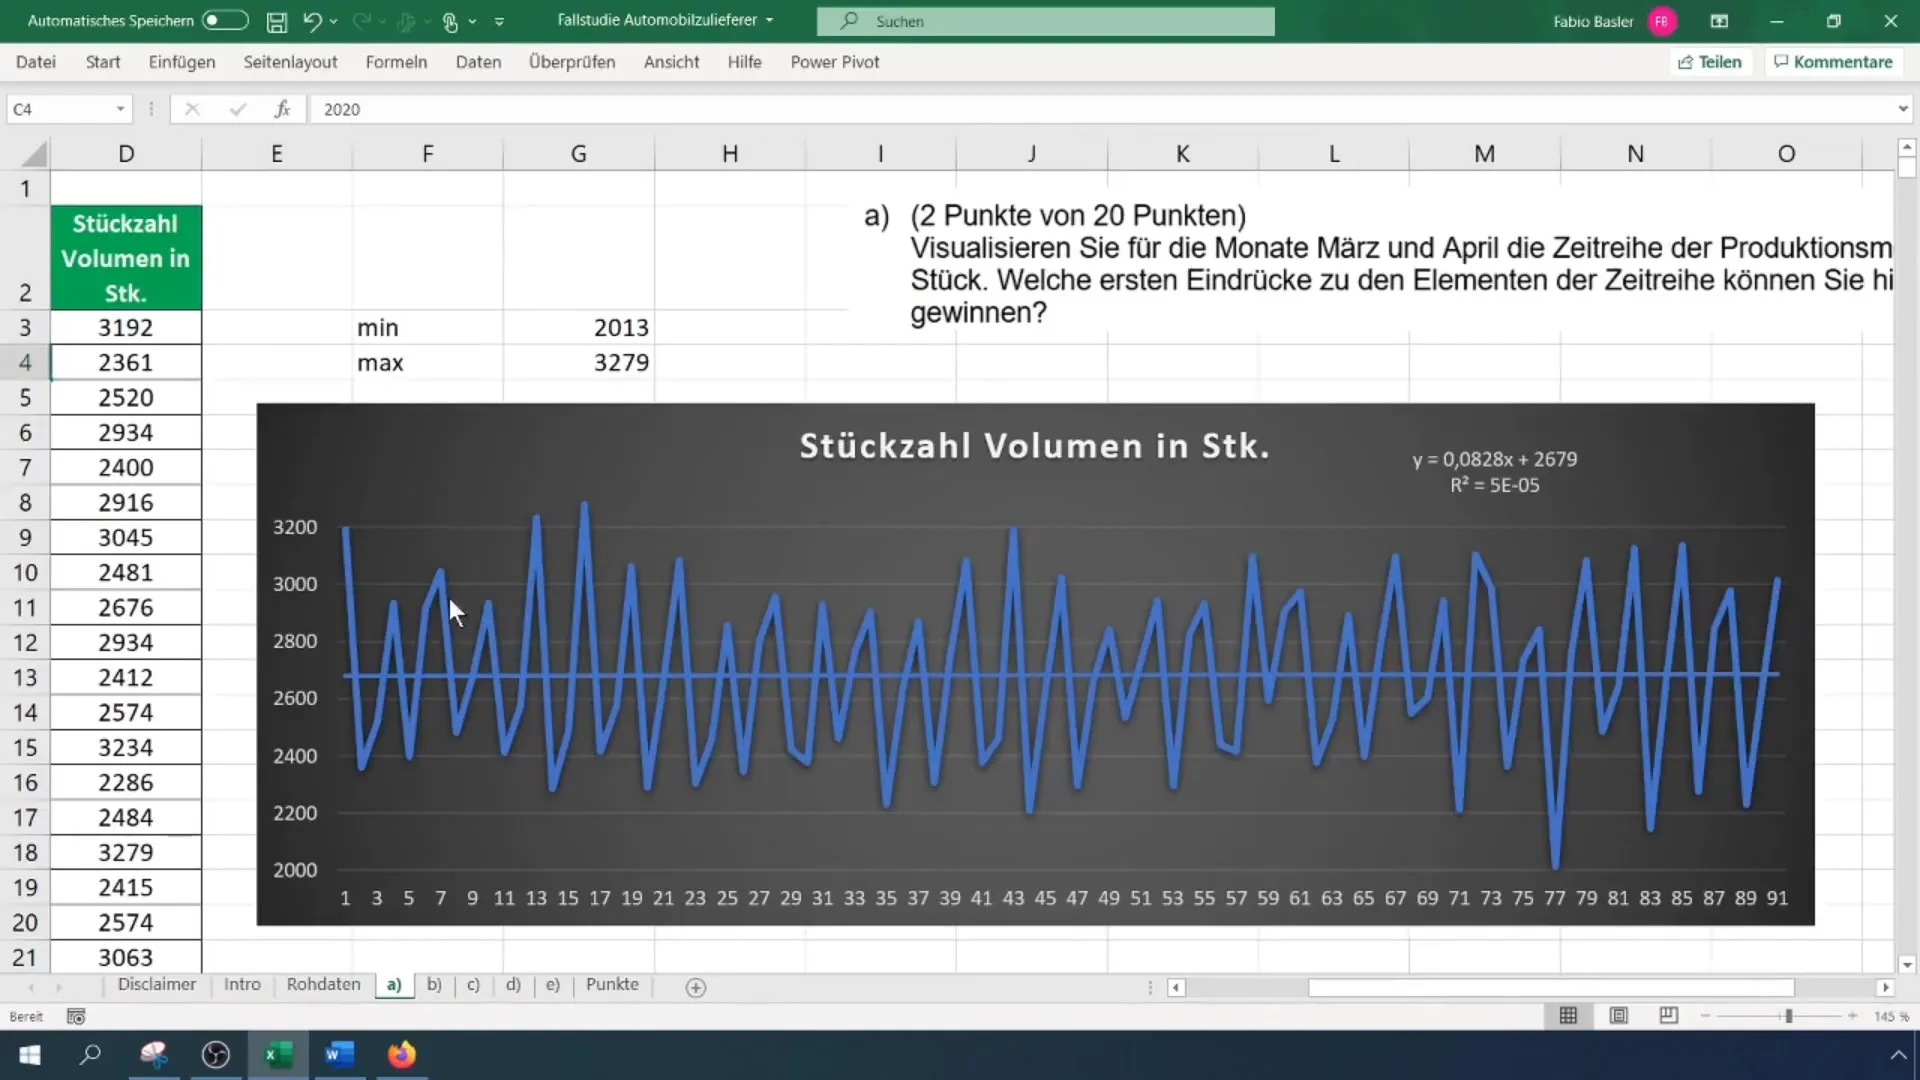
In the second case study, you will focus on time series analysis, particularly suitable for trend analysis. You will learn how to examine historical data and forecast future developments. It is important to quantify the quality of error estimates to make precise predictions.

Inductive Statistics in the Biotechnology Case Study
The third case study covers inductive statistics with a special focus on hypothesis testing. You will analyze various drug compounds and perform different statistical tests to verify your hypotheses. Key tests include those related to expected value, variance, and the normal distribution fitting test.
Summary
Summary - Statistics with Excel: Introduction to the Case Study
The course will teach you basic and advanced statistical methods using Excel necessary for analyzing real case studies. By applying the learned techniques, you can expand your statistical knowledge and successfully apply it in practice. The case studies not only offer theoretical knowledge, but also practical approaches in specific industries.
Frequently Asked Questions
What is the main goal of this course?The main goal is to show you how to use Excel for various statistical analyses.
How many case studies are covered?Three case studies are covered: Portfolio Management, Automotive Suppliers, and Biotechnology.
What are pivot tables?Pivot tables are Excel tools for data analysis that allow restructuring data for better visualization.

