Introduction
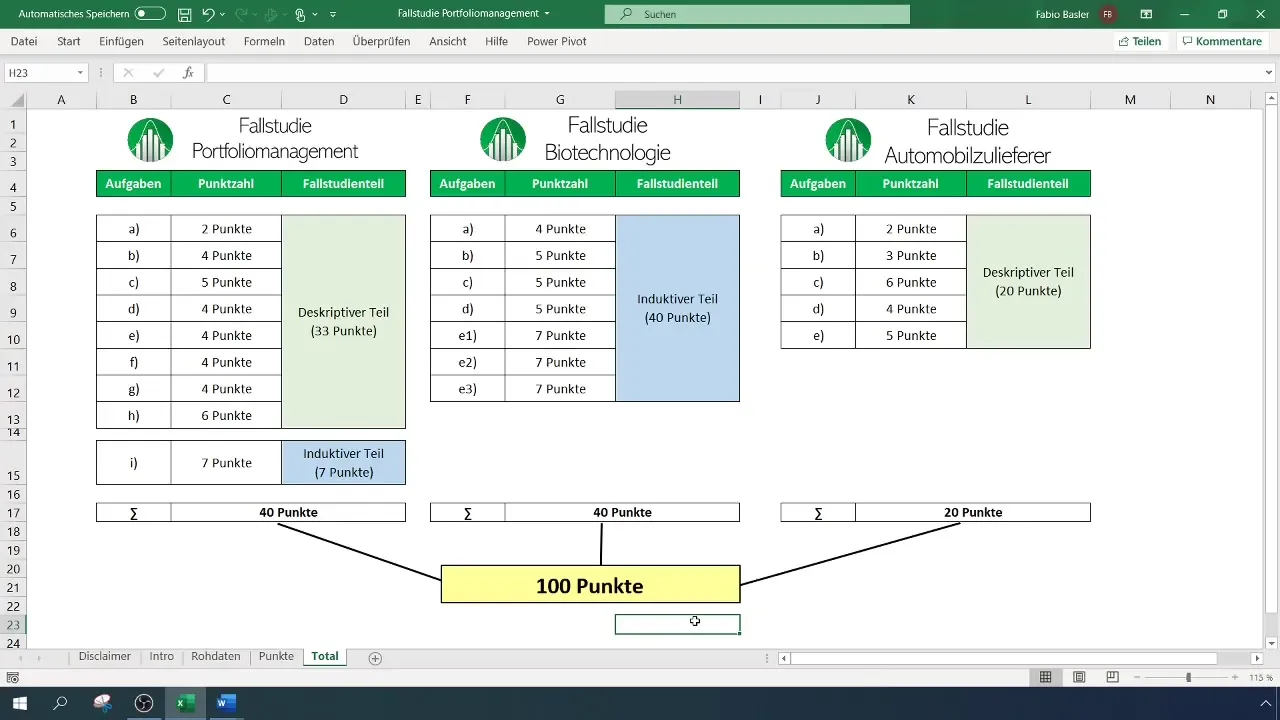
Welcome to this guide where you will discover how to effectively work on case studies in the field of statistics with Excel. This collection of case studies covers three exciting areas: portfolio management, automotive supplier, and biotechnology. The aim of this guide is to provide you with precise step-by-step instructions to efficiently work on the content of each case study. You will learn and apply important data analysis tools of descriptive and inductive statistics.
Key Insights
- You will review and deepen the basics of descriptive and inductive statistics.
- Through practical case studies, you will enhance your Excel skills in data management.
- You will learn specific analysis tools, including regression analysis and statistical hypothesis tests.
- Finally, you will have the opportunity to test and solidify your knowledge through practical exercises.
Step-by-Step Guide
1. Introduction to the Portfolio Management Case Study
Start the portfolio management case study by familiarizing yourself with the problem situation. The fundamental concepts and challenges in portfolio management are discussed before you begin with the specific tasks. Take the time to read and understand the text thoroughly.
In this section, you will learn concepts such as risk, return, and diversification. These basic principles are crucial for understanding the later calculations. It also covers which Excel functions are useful for analyzing the data.
2. Descriptive Statistics
The next step involves performing calculations of descriptive statistics. Here, you will learn how to determine basic metrics such as mean, median, and standard deviation. Use the provided datasets and apply the corresponding Excel formulas.

Try also to calculate measures of dispersion. These measures give you an overview of how spread and variation look within your data. A good understanding of these concepts is important to assess the quality of your data analyses.
3. Regression Analysis
In this phase, you will move on to regression analysis. This is a powerful tool to understand the relationships between different variables. You will learn how to perform this analysis in Excel to draw useful conclusions from your data.
It also covers the relevant formulas and graphs that will help you present your results clearly. Pay particular attention to interpreting the results and the statistical significance.
4. Introduction to the Automotive Supplier Case Study
After working on the portfolio management case study, you will delve into the automotive supplier case study. The focus here is on time series analysis. Dive deep into analyzing the datasets to identify trends and cycles over time.
You will learn various techniques of exponential smoothing and error analysis that will help you better understand the time data and make predictions. Keep in mind the importance of proper data visualization to present your results understandably.
5. Introduction to the Biotechnology Case Study
Finally, we will focus on the biotechnology case study. In this section, you will learn how to conduct statistical hypothesis tests. This includes understanding and applying established hypotheses for comparing means as well as proportional differences.
It is crucial that you understand the basics of estimation theory to make informed decisions and effectively communicate your results. Here, you can also use Excel functions to automate your analyses and minimize sources of error.
6. Conclusion and Knowledge Optimization
Before you reach the end of the collection, take the time to review and reflect on all your results. Consider where you are already confident and where you may still see potential for improvement. You have access to blank documents and raw data sets to further practice your skills.

Take this opportunity to seek critical feedback and solidify your knowledge. Reflecting on what you have learned significantly contributes to your learning success and helps you apply the acquired skills.
Summary
In this guide, you have been taught the basics and specific techniques of descriptive and inductive statistics. Through the three case studies, you have learned practical examples and the opportunity to deepen your Excel skills. Use these experiences to sharpen your understanding of statistical analyses and further develop your skills.
Frequently Asked Questions
How many case studies are included in the collection?There are a total of three case studies included in the collection.
What are the focus areas of the case studies?The case studies cover topics in portfolio management, automotive suppliers, and biotechnology.
Which Excel functionalities are covered?Basic statistical functions, regression analyses, and hypothesis tests are covered.
Are there solution hints for the exercises?Yes, solutions to all three case studies are provided.
Do I need to take notes during the analysis?Yes, it is recommended to take notes during the analysis and to recompute the tasks.


