Introduction
The case study in portfolio management offers you the opportunity to experience descriptive statistics in a practical context. You will learn how to analyze sales figures for smartphones, notebooks, and tablets to gain valuable insights. You will have various statistical methods at your disposal, including regression analysis and tests for normal distribution. By using Excel, you will be able to evaluate data from 500 retail stores and derive strategic decisions.
Main Insights
- You will acquire comprehensive knowledge of descriptive statistics and their application in portfolio management.
- The analysis includes various indicators, including mean and deviation indicators.
- Based on raw data, you can directly derive recommendations for management.
Step-by-Step Guide
To effectively apply descriptive statistics, we should systematically go through the procedure.
Step 1: Understand the Problem Situation
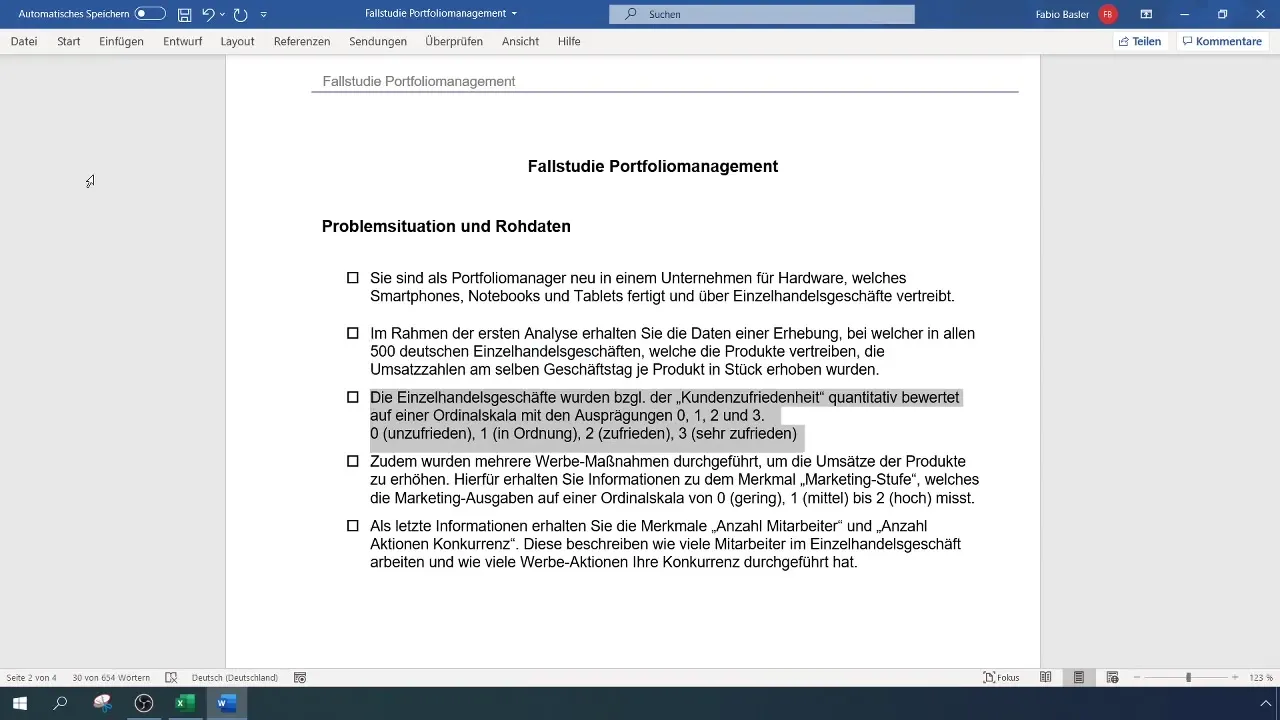
Before working with statistics, it is important to understand the problem situation in the context of the company. You are a new portfolio manager in a company that produces hardware products such as smartphones, notebooks, and tablets. The goal of your initial analysis is to examine the sales figures of these products from 500 retail stores and evaluate quantitative and qualitative data on customer satisfaction and marketing efforts.

Step 2: Analyze the Raw Data
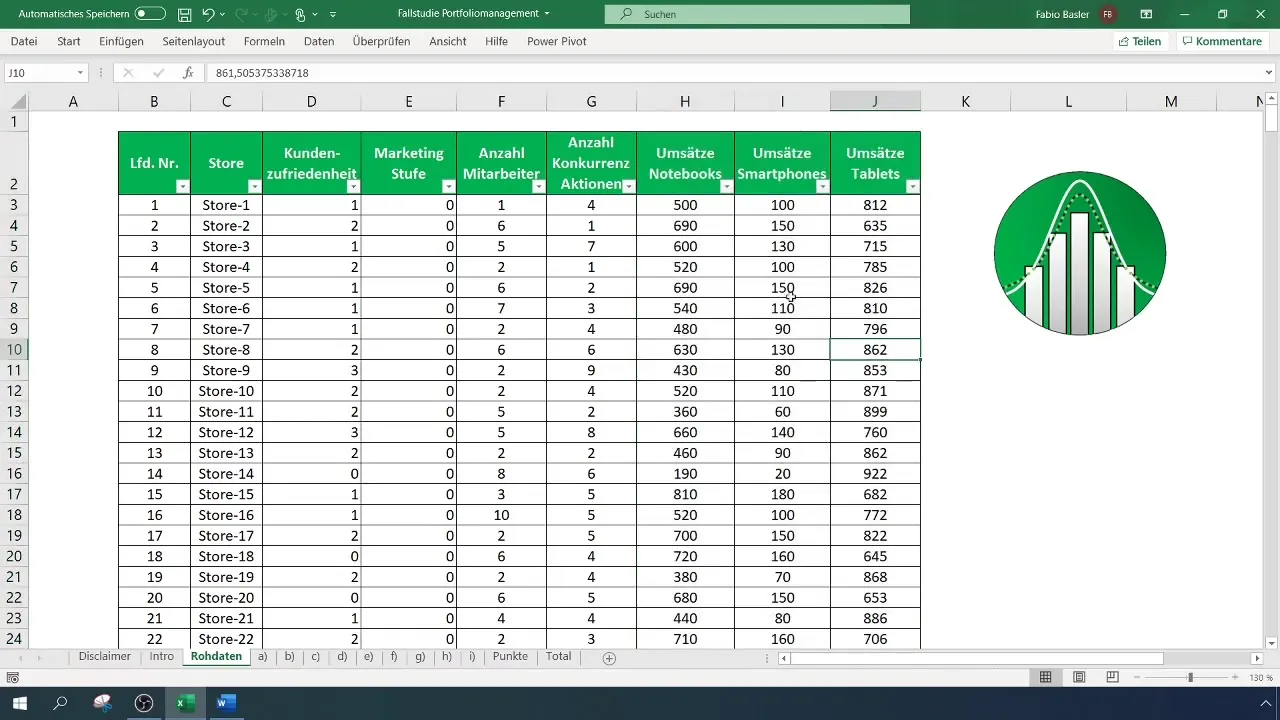
In Excel, you have access to raw data relating to nine characteristics. These include the number of sales outlets, customer satisfaction, and marketing expenses. The data was collected on an ordinal scale, with 0 representing high dissatisfaction and 3 representing very high satisfaction. Marketing expenses are also classified on a non-metric scale.
Step 3: Understand Customer Satisfaction
Customer satisfaction plays a central role in the analysis. By evaluating on an ordinal scale, you can understand how satisfied customers are with the products. This information is crucial for further planning and strategy development.

Step 4: Consider Marketing Expenses
Additionally, it is crucial to examine the marketing expenses of individual stores. These data are also recorded on an ordinal scale. You can categorize expenses into three categories: low, medium, and high. This information helps you better understand the impact of marketing efforts on customer satisfaction and sales.
Step 5: Analyze Sales Figures
The sales figures of the products are key to your analysis. These are recorded in euros and range from €110 to €3,330 per store. It is important to correlate sales figures with other characteristics to gain insights into customer purchasing behavior.

Step 6: Conduct Regression Analysis
By applying regression analysis, you can examine the relationships between different variables. In particular, you should analyze the influence of marketing expenses and customer satisfaction on sales figures. A multivariate analysis could provide valuable insights for future decisions.
Step 7: Test for Normal Distribution
An important element of inductive statistics that you should not overlook is testing for normal distribution. This allows you to check if your data follows a normal distribution, which is a requirement for many statistical tests.
Step 8: Derive Actionable Recommendations
After analyzing and understanding the data, you can now compile strategic actionable recommendations. This could involve adjusting marketing strategies or improving customer satisfaction. The goal is to increase sales figures and overall efficiency of portfolio management.

Summary
By applying descriptive statistics in Excel, you were able to gain valuable insights into the sales figures of hardware products in retail. You learned how to analyze customer satisfaction and marketing expenses to support strategic decisions.
Frequently Asked Questions
What is descriptive statistics?Descriptive statistics deals with summarizing and describing data.
How to perform a regression analysis?In Excel, you can use the regression function or utilize add-ins like the Data Analyzer.
What is an ordinal scale?An ordinal scale measures variables in a rank-ordered sequence, for example, from dissatisfied to very satisfied.
How to test for normal distribution?You can use the Shapiro-Wilk test or the D'Agostino curve in Excel.
How can I improve customer satisfaction?By implementing targeted marketing strategies and customer surveys, you can enhance satisfaction levels.


