You are ready to deepen your knowledge in statistical analysis with Excel, specifically in dispersion analysis. In this tutorial, you will learn how to quantify and compare revenue fluctuations for different product categories, such as smartphones and notebooks. You will apply various statistical metrics to efficiently determine the existing differences and variabilities. This analysis can provide you with valuable insights and support your decision-making in the context of product portfolio management.
Key Insights
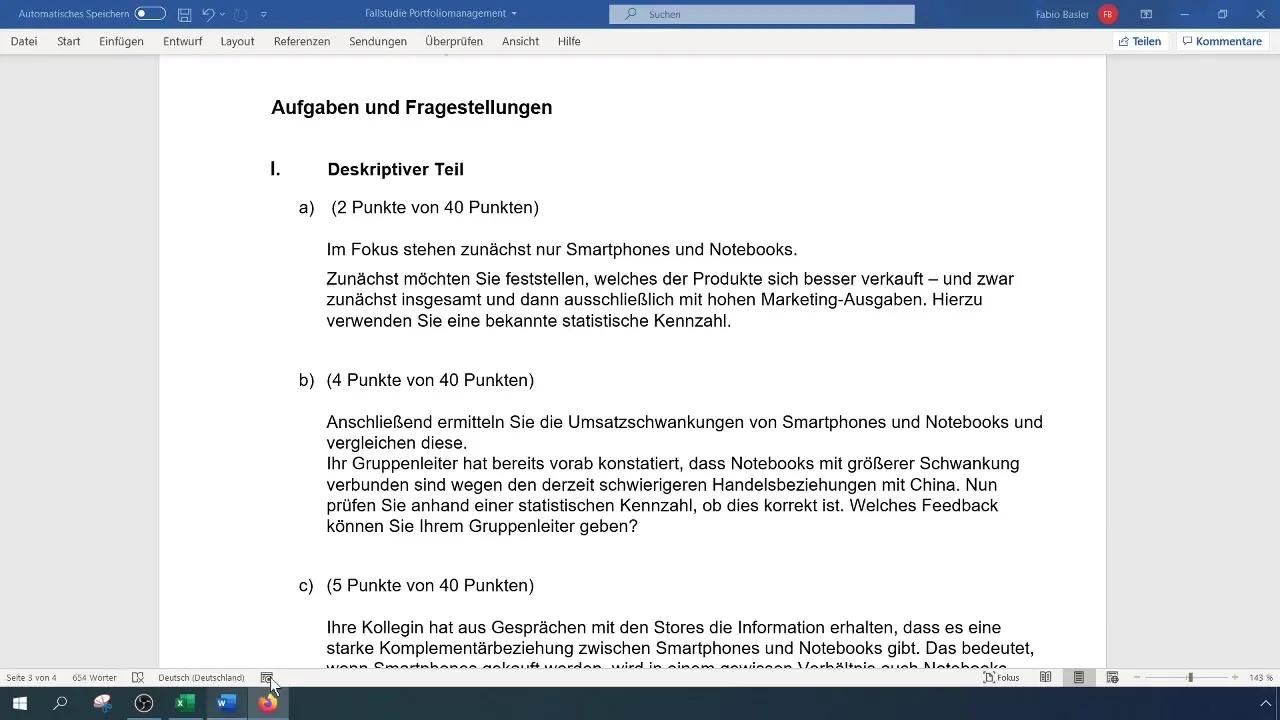
The analysis of revenue fluctuations shows how much a product's revenues deviate from its average. You will calculate basic statistical measures such as variance, standard deviation, and coefficient of variation. These metrics help assess the stability of revenues and provide comparison values between different products.
Step-by-Step Guide
Step 1: Prepare Data
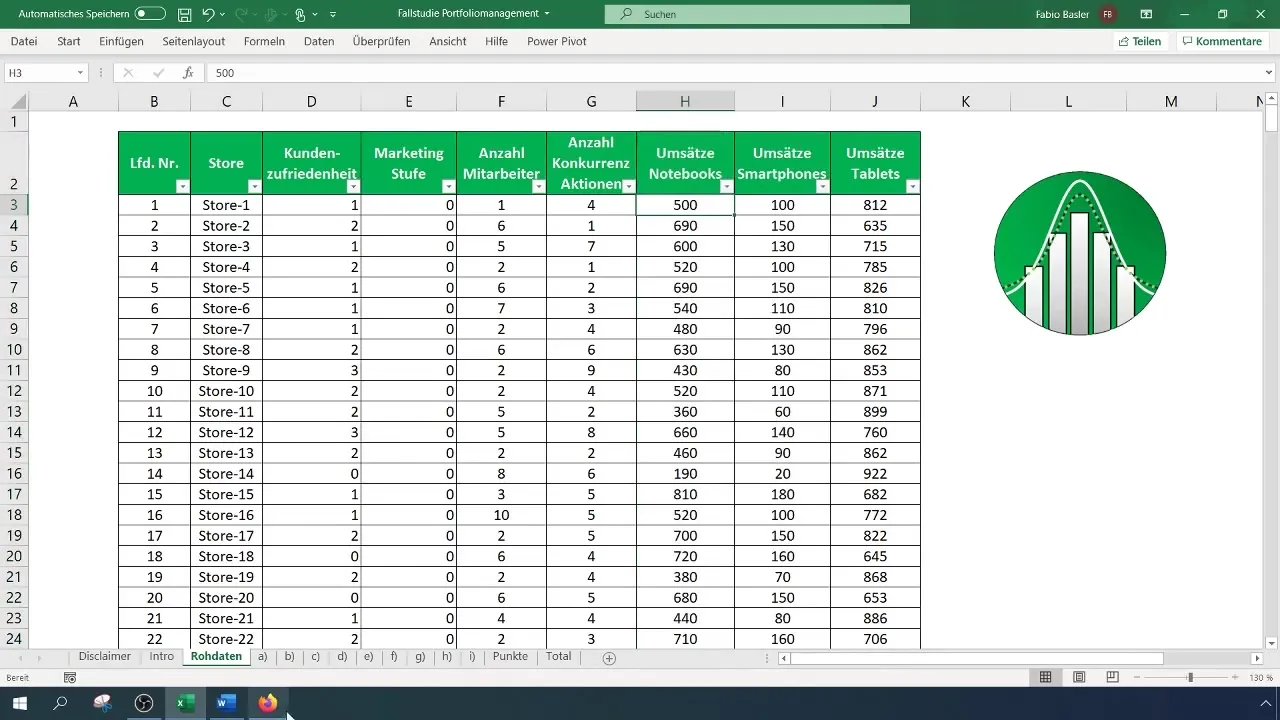
To carry out the analysis sensibly, your data must be appropriately structured. Ensure that you have the revenue data for smartphones and notebooks in an Excel document. Begin by copying the data into two separate columns to ensure clarity.
Step 2: Calculate Mean
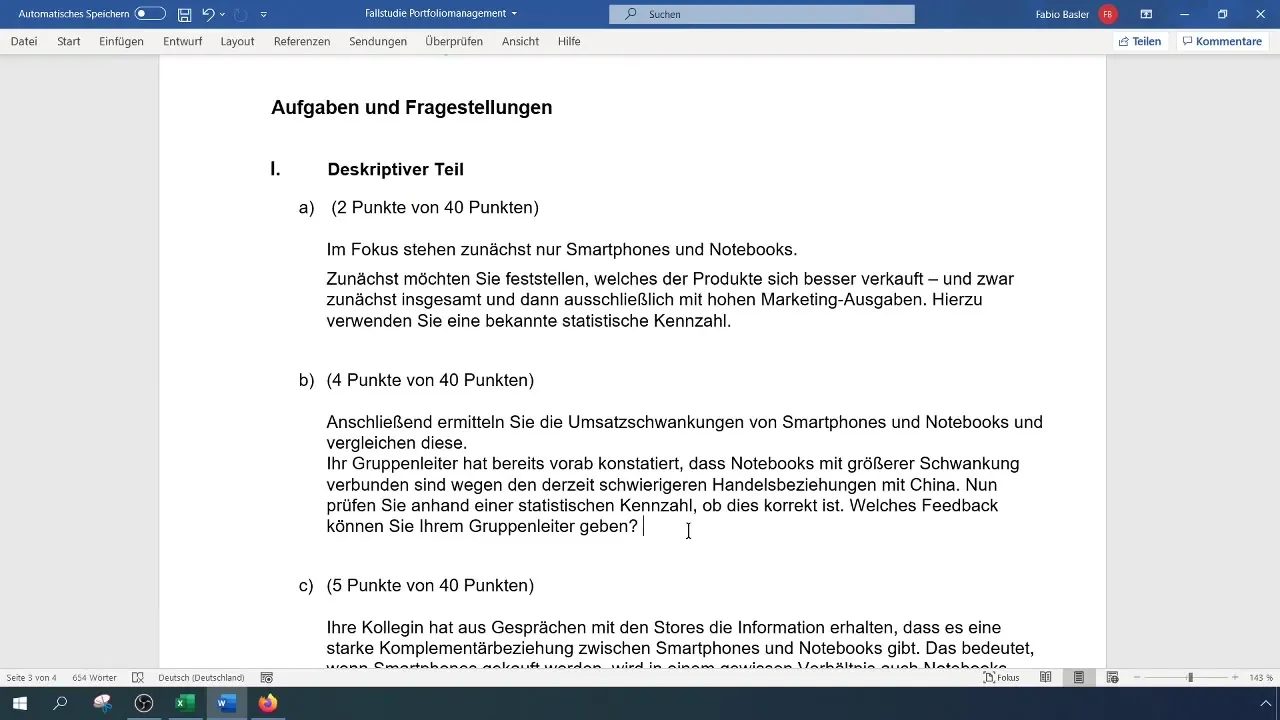
Next, calculate the mean of revenues for both product categories. Use the formula =AVERAGE(range), where "range" indicates the cells containing your revenue data. This metric gives you an initial idea of the average revenue each product can generate.
Step 3: Calculate Variance
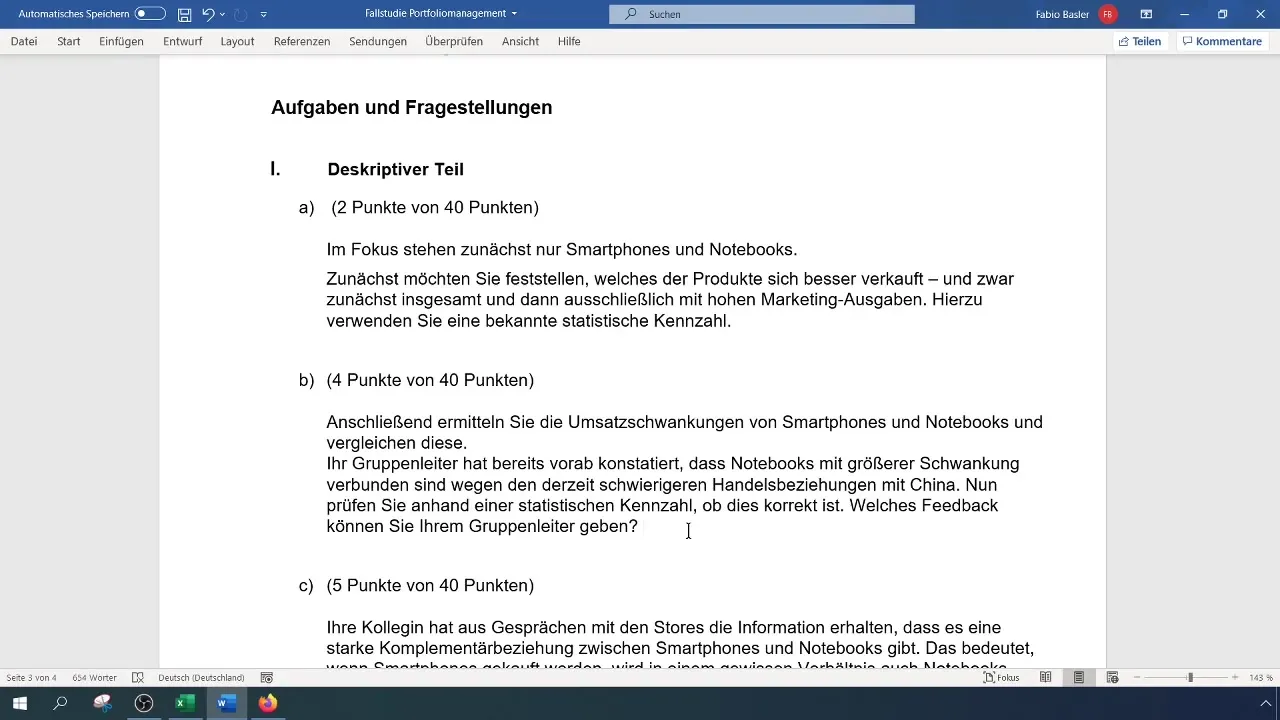
Variance quantifies the dispersion of your revenue values. You can calculate it using the formula =VAR.P(range) for a population and =VAR.S(range) for a sample. A higher value indicates larger deviations of individual values from the mean.
Step 4: Calculate Standard Deviation
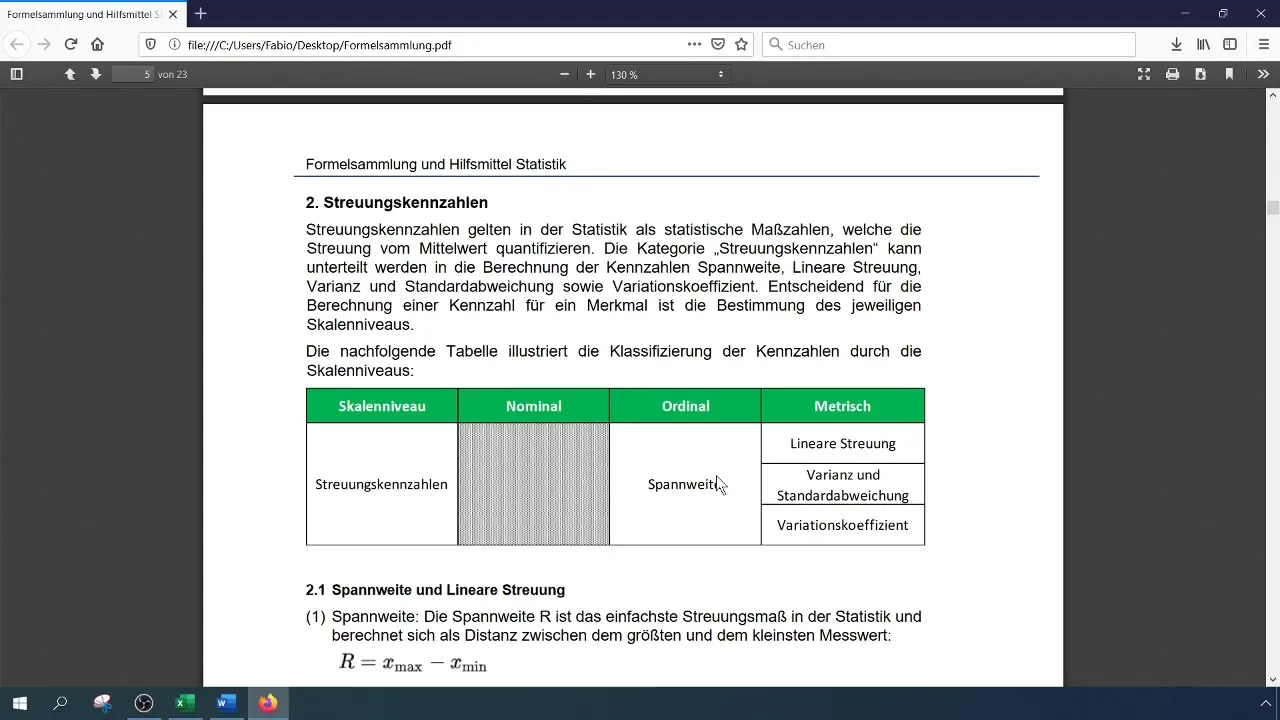
The standard deviation is the square root of variance. In Excel, you can calculate it using the formula =STDEV.P(range) for the population. It shows you how much the individual values fluctuate around the mean.
Step 5: Determine Coefficient of Variation
The coefficient of variation (CV) is a relative measure that relates standard deviation to the mean. Calculate it using the formula =STDEV.P(range) / AVERAGE(range). A high CV value indicates high fluctuations relative to the mean.
Step 6: Analyze and Interpret Results
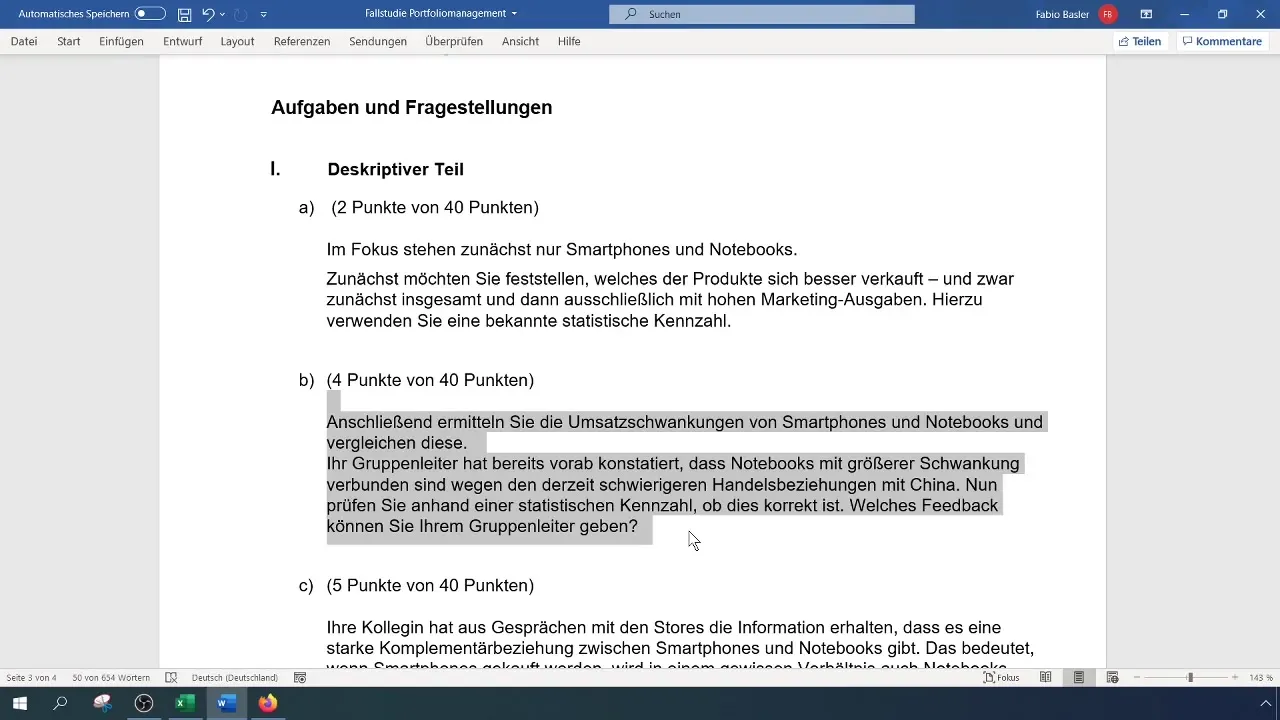
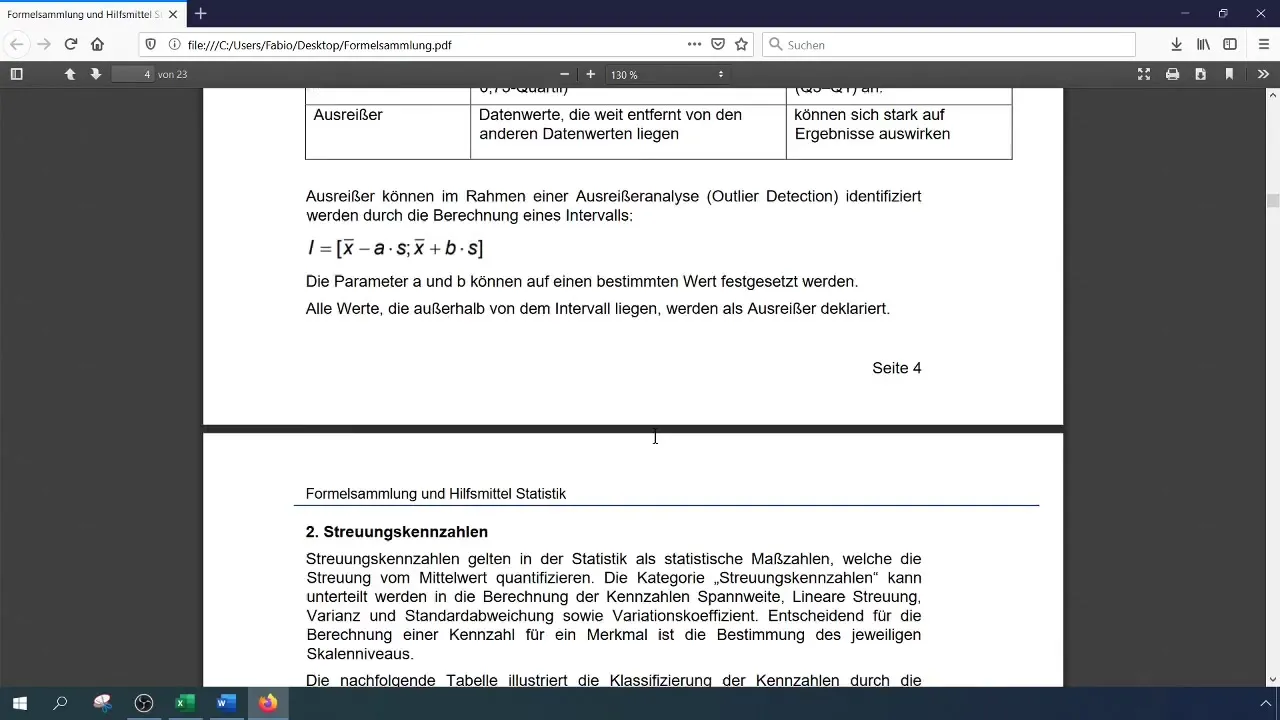
After calculating the metrics, analyze the results. A high coefficient of variation (e.g., ≥ 0.65) indicates high revenue fluctuations. Also, consider specific outliers in your data that may lead to these fluctuations.
Step 7: Use Pivot Tables
If you want an overview of the calculations, you can also use pivot tables. Select your raw data, go to the "Insert" menu, and choose "PivotTable." The pivot table allows you to display revenue data more structuredly and provides automatic calculations for averages and standard deviations.
Step 8: Adjust Calculation in Pivot Tables
Within the pivot table, you can adjust the settings to obtain the mean and standard deviation of revenues. Right-click within the pivot field and select "Value Field Settings." There, you can choose to calculate the mean for revenues to achieve a clear presentation.
Step 9: Confirm Manual Calculation
Please note that the coefficient of variation cannot be directly calculated in pivot tables. Instead, you should manually calculate the standard deviation by the mean, giving you the opportunity to verify the consistency of your values here as well.
Step 10: Feedback and Documentation
Summarize your results in a short documentation. Make sure to consider the essential points of your analysis as well as any feedback or specific comments from your group leader.
Summary
In this guide, you have learned how to analyze revenue fluctuations for smartphones and notebooks using basic statistical measures such as mean, variance, standard deviation, and coefficient of variation. You have seen how to calculate these in Excel and further analyze them using pivot tables. The results will help you make informed decisions in the product management field.
Frequently Asked Questions
How to calculate the mean in Excel?You can calculate the mean using the formula =AVERAGE(range), where "range" specifies the cells containing your revenue data.
What is the difference between variance and standard deviation?Variance measures the spread of values, while standard deviation is the square root of variance and represents the spread in the same units as the original data.
Can I calculate coefficient of variation in pivot tables?No, the coefficient of variation is not directly available in pivot tables. You need to manually calculate it by dividing the standard deviation by the mean.
What do high coefficients of variation indicate?High coefficients of variation (e.g. ≥ 0.65) indicate strong fluctuations in revenue values compared to the average.
How can I identify outliers in my data?You can identify outliers by examining the fluctuations in isolation and checking if individual values significantly deviate from the mean.


