Statistics is an important tool for analysis in many areas. This tutorial shows you how to perform the Spearman rank correlation analysis in Excel. With this method, you can efficiently quantify the relationship between ordinal variables. We are looking at the relationship between customer satisfaction and marketing level.
Main Findings
- The Spearman rank correlation analysis is particularly suitable for ordinal scaled data.
- The use of Excel allows for a quick calculation and visualization of the rank correlation.
- A weak positive correlation between marketing levels and customer satisfaction indicates that increased investments in marketing do not necessarily lead to higher satisfaction.
Step-by-Step Guide
First, you need to insert the relevant data. We focus on customer satisfaction and marketing levels. This data was collected as part of a case study.
Here, you can start by copying the data from your raw dataset and pasting it into a new worksheet. Make sure to clearly define the column headings. It could be helpful to name the columns as "Customer Satisfaction" and "Marketing Level".

After copying the data, it is important to check the scale levels of your variables. Customer satisfaction is ordinally scaled, while marketing levels are also categorised ordinally. You should verify that you understand this correctly to avoid errors in later calculations.

Next, you need to prepare the data for rank correlation analysis. You need the ranks of the variables. In Excel, you can do this using the "RANK.EQ" or "RANK.AVG" functions. These functions assign a rank to each number with respect to a set matrix. Make sure you are working in the correct range.

To calculate the ranks for customer satisfaction, which we denote here as Variable X1, first select the relevant cell. For the first observation, this means selecting the cell for customer satisfaction and then selecting the matrix for rank calculation. It is important to fix the reference for the entire matrix so that the reference does not change when you drag the formula downwards.
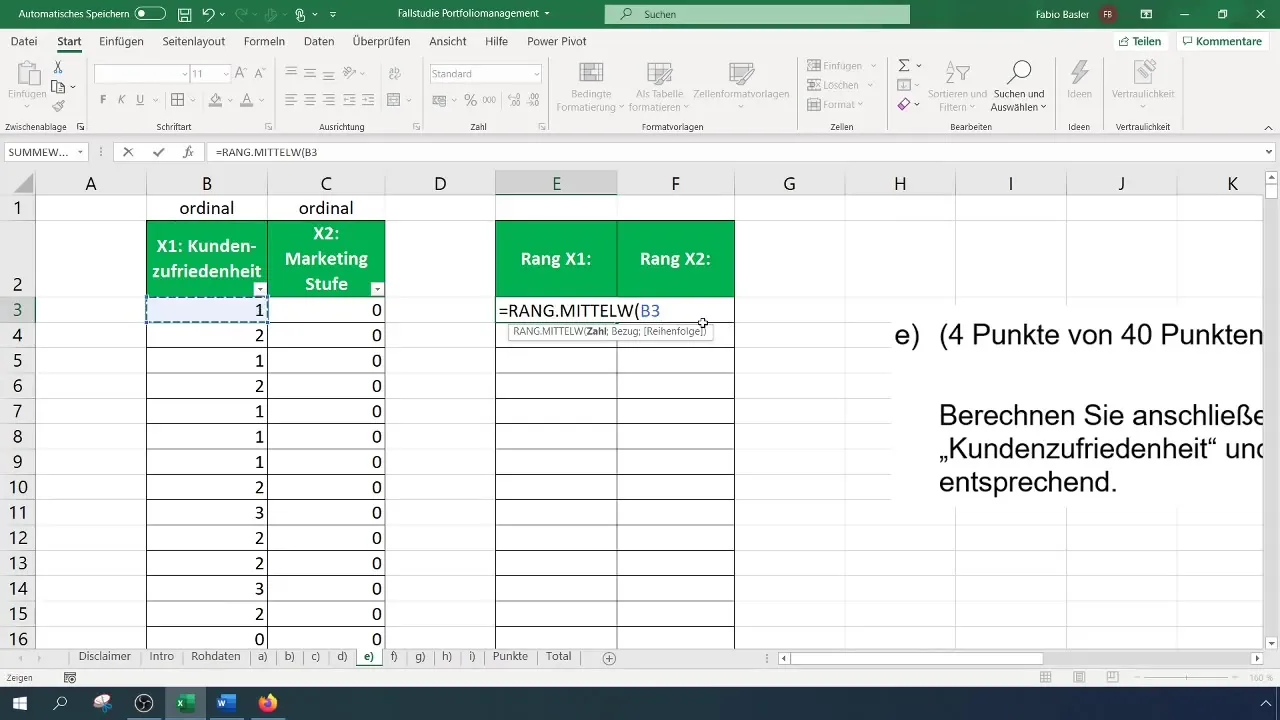
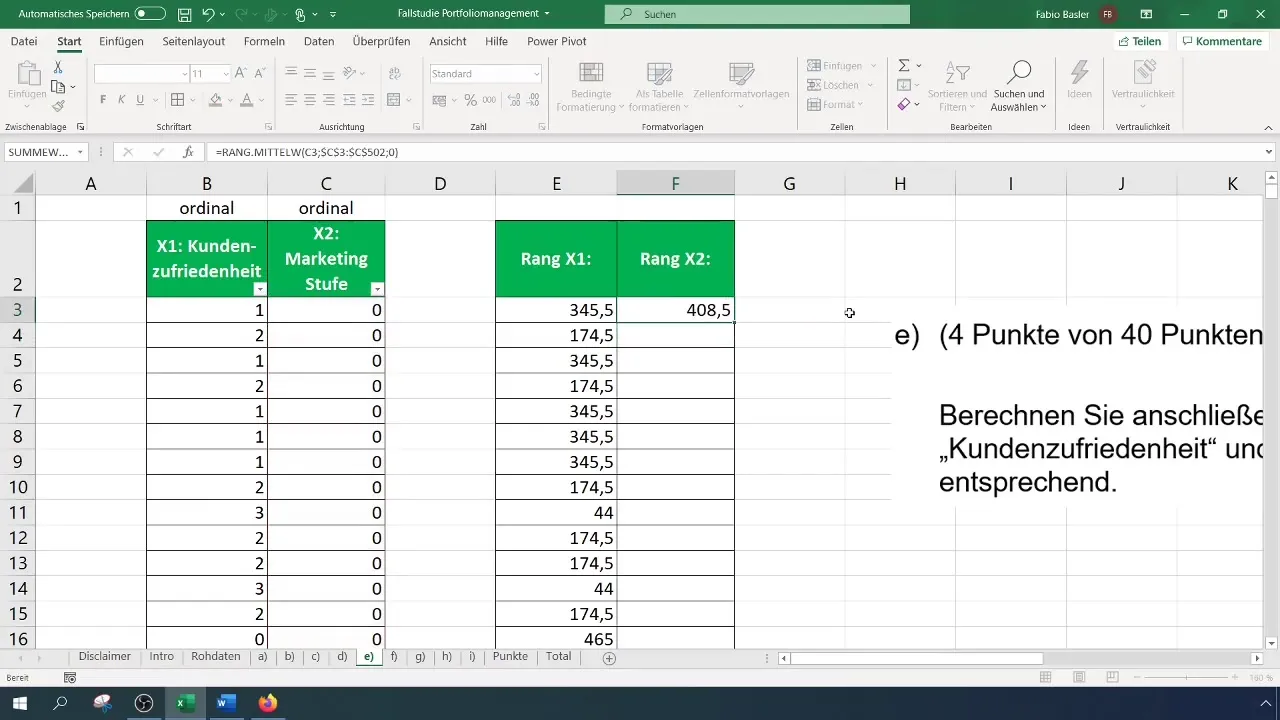
To calculate the ranks for the marketing level (X2), you repeat the same process. Here too, it is important to keep the entire data range fixed so that the formula functions correctly when copied downwards. These steps ensure that the ranks for each variable are correctly determined.
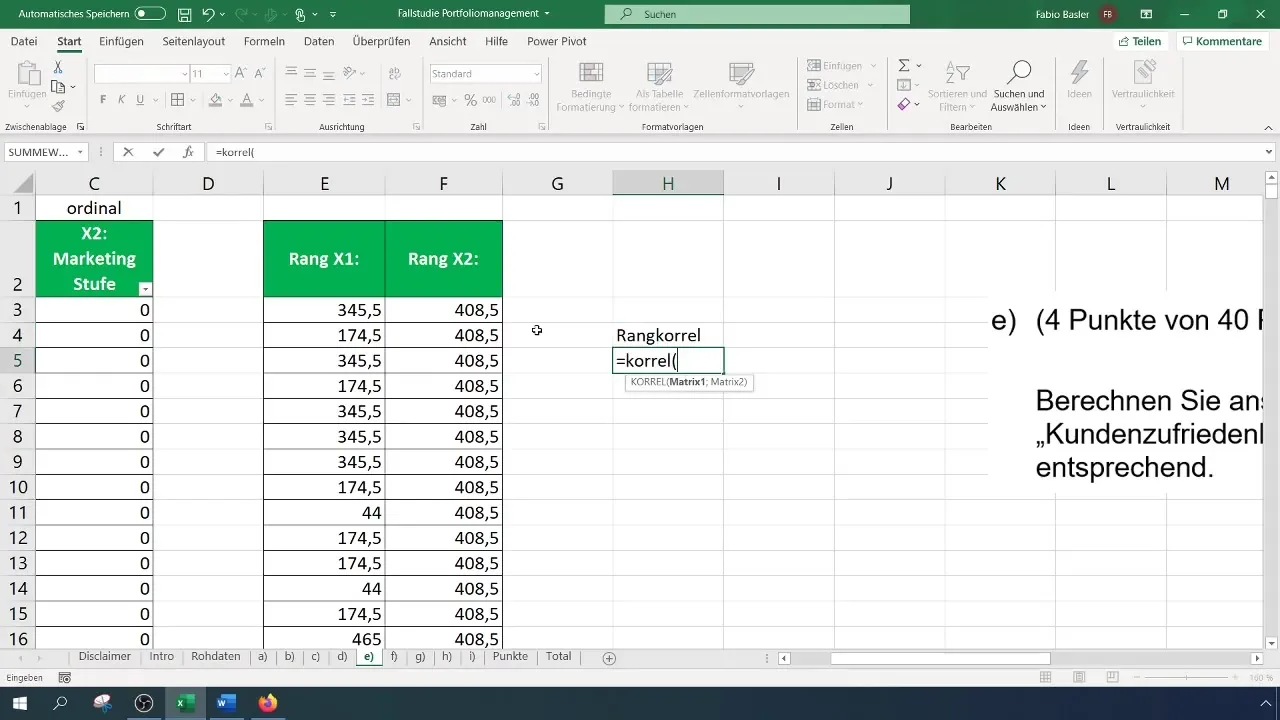
Once you have the ranks for both variables, you can calculate the rank correlation. This is done using the "CORREL" function. This function allows you to select the ranks of both X1 and X2 and calculate the correlation. The result will indicate the strength of the relationship between the two variables.
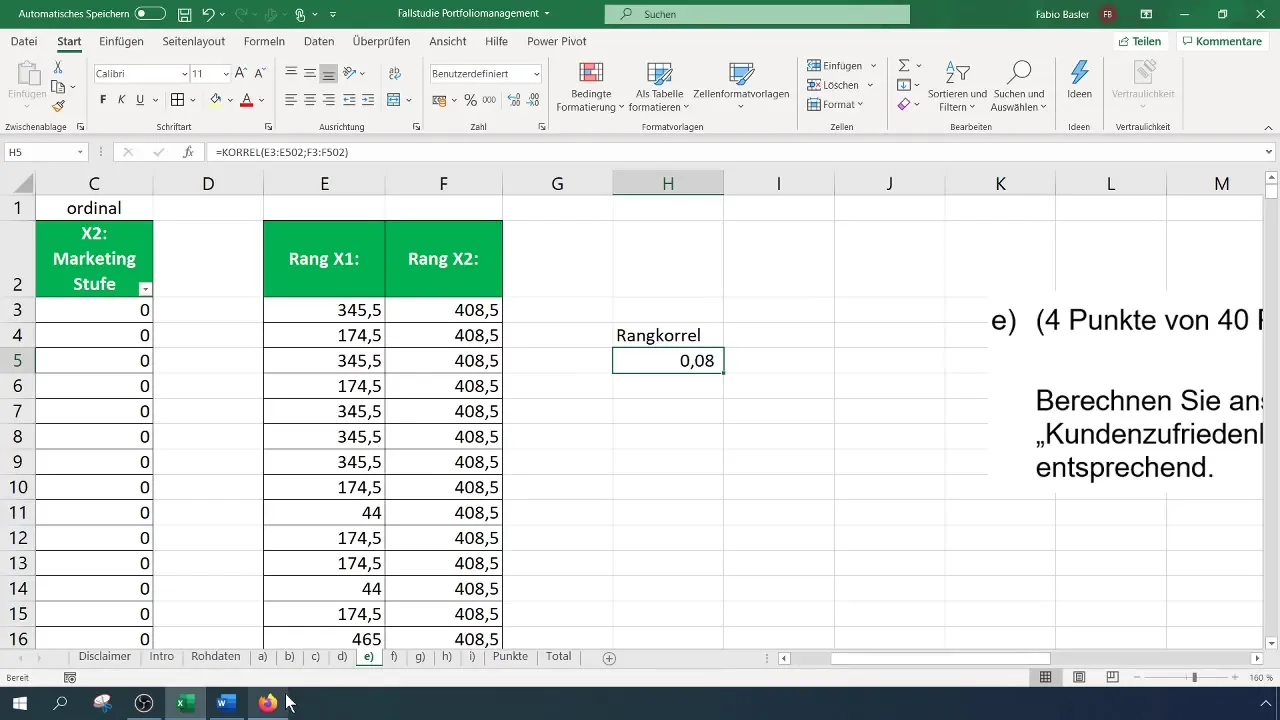
In your case, the correlation is 0.082, indicating a weak positive correlation. This number shows that while there is a trend for higher marketing expenses to lead to better customer satisfaction, this relationship is not strong.
Finally, you should document the interpretation of your results. A table could help you to clarify where the rank correlation stands and to clearly illustrate the relationship between the two variables.
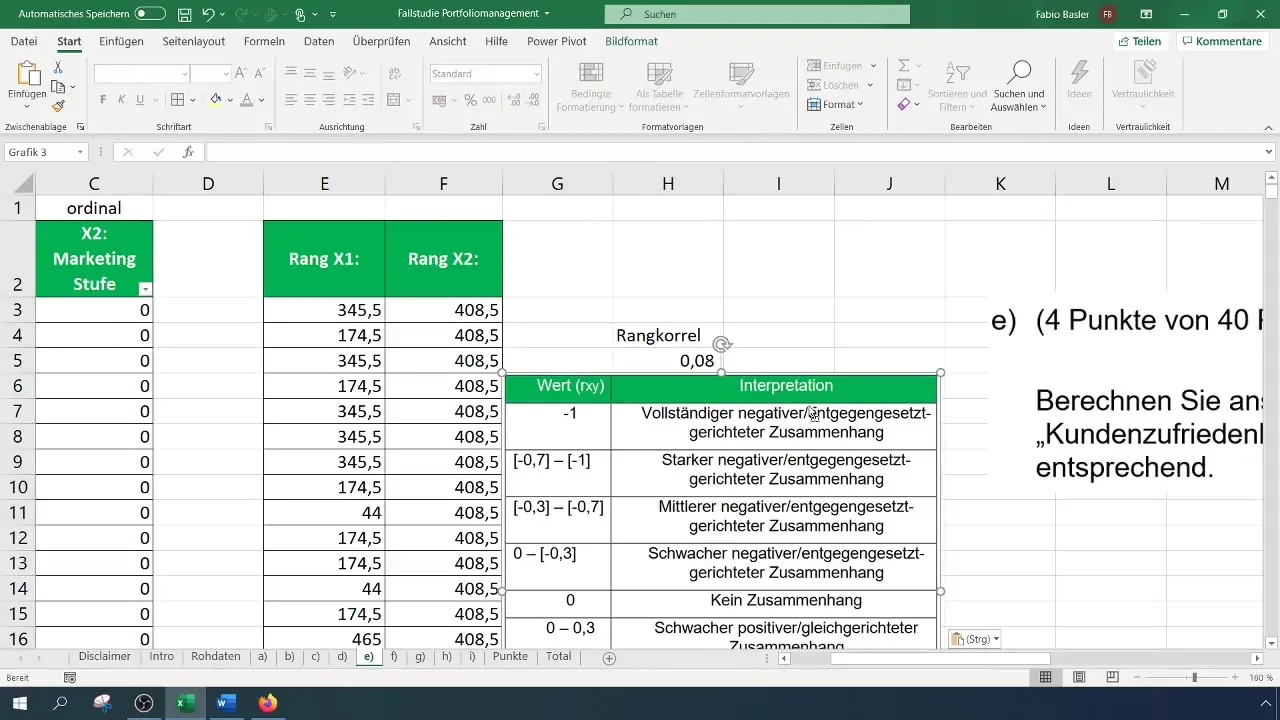
The approach of rank correlation analysis helps to gain qualitative insights into quantitative data and shows you how marketing expenses could vary without directly increasing customer satisfaction.
Summary
In this guide, you learned how to perform rank correlation analysis in Excel. First, you prepared your data correctly, then determined the ranks of both variables. Finally, you calculated the rank correlation to quantify the relationship between marketing level and customer satisfaction.
Frequently Asked Questions
How different are Spearman and Kendall?Spearman and Kendall are both rank correlation coefficients, but they are calculated differently. Spearman is based on rank differences, while Kendall uses the number of matches and mismatches.
How do I choose the appropriate correlation?The choice of correlation depends on the type of data. For ordinal scaled data, Spearman is suitable, and for metric data, Pearson is often used.
Could I use regression instead of correlation?Yes, regression can be useful to examine the influence of one or more independent variables on a dependent variable, while correlation only shows a relationship.


