The analysis of time series is an essential part of statistics, especially in areas such as production planning. To forecast trends and future developments, Excel comes into play as a powerful tool. In this tutorial, you will learn how to work with the TREND function in Excel to gain valuable insights from your data.
Main Insights
- The TREND function in Excel allows you to estimate future values based on historical data.
- There are various ways to represent and analyze trendlines in Excel.
- You can use both graphical and mathematical methods to identify trends in your data.
Step-by-Step Guide
First, you need a suitable data set. In this tutorial, we refer to production numbers in a time series. To utilize the TREND function, follow these steps:
Step 1: Data Preparation
Open your Excel document containing the relevant production data you wish to analyze.
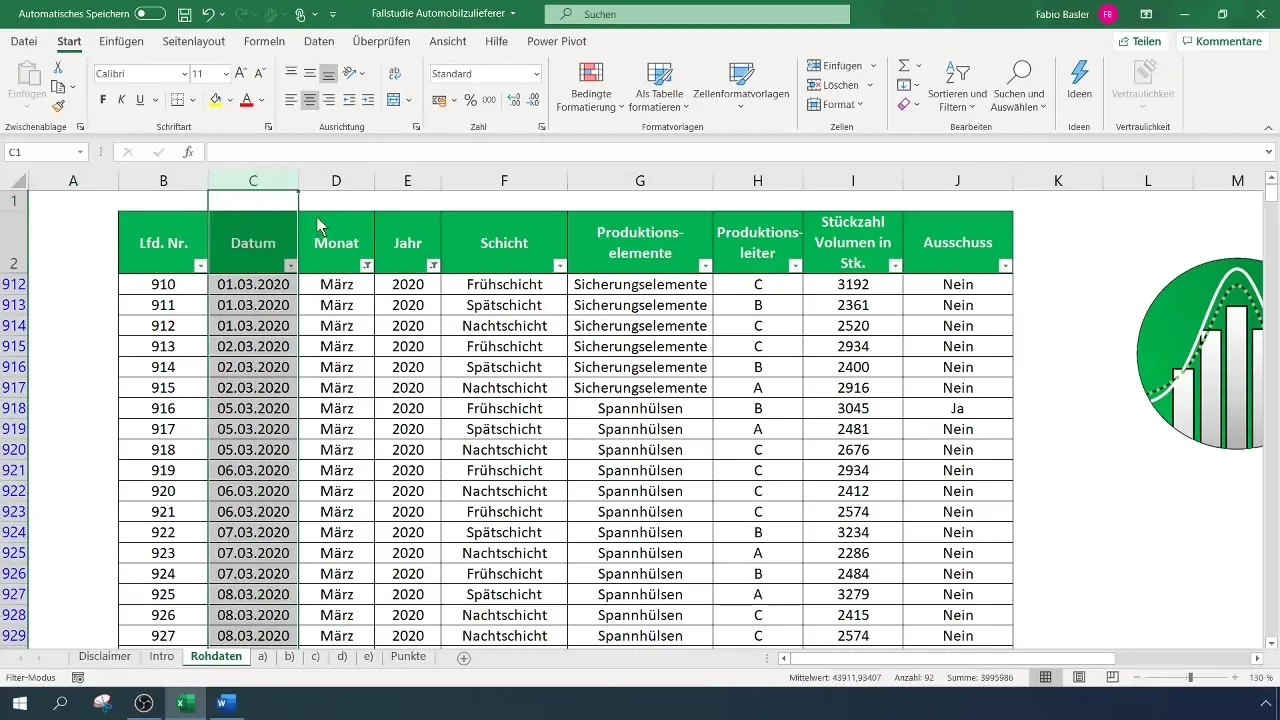
In the case of this tutorial, we used production numbers from a raw data list for the months of March and April 2020. Ensure you have all relevant data in a table that is sorted chronologically.
Step 2: Selecting and Copying the Data
Select the entire data range relevant for trend calculation. You can select the top left corner of the data range to highlight all data.
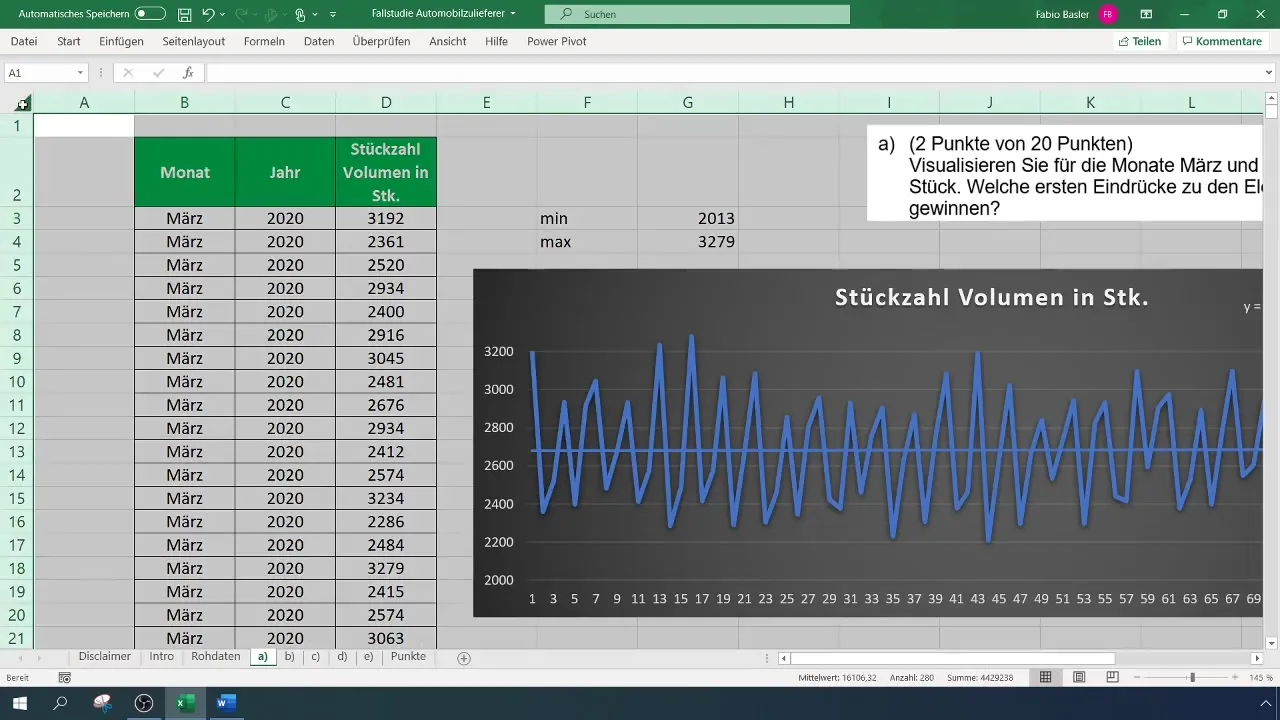
Copy the data (right-click and then “Copy”) to paste it into a new workbook or another tab.
Step 3: Inserting the Data
Switch to the worksheet where you want to insert the data, for example, sheet B. Paste the copied data here.
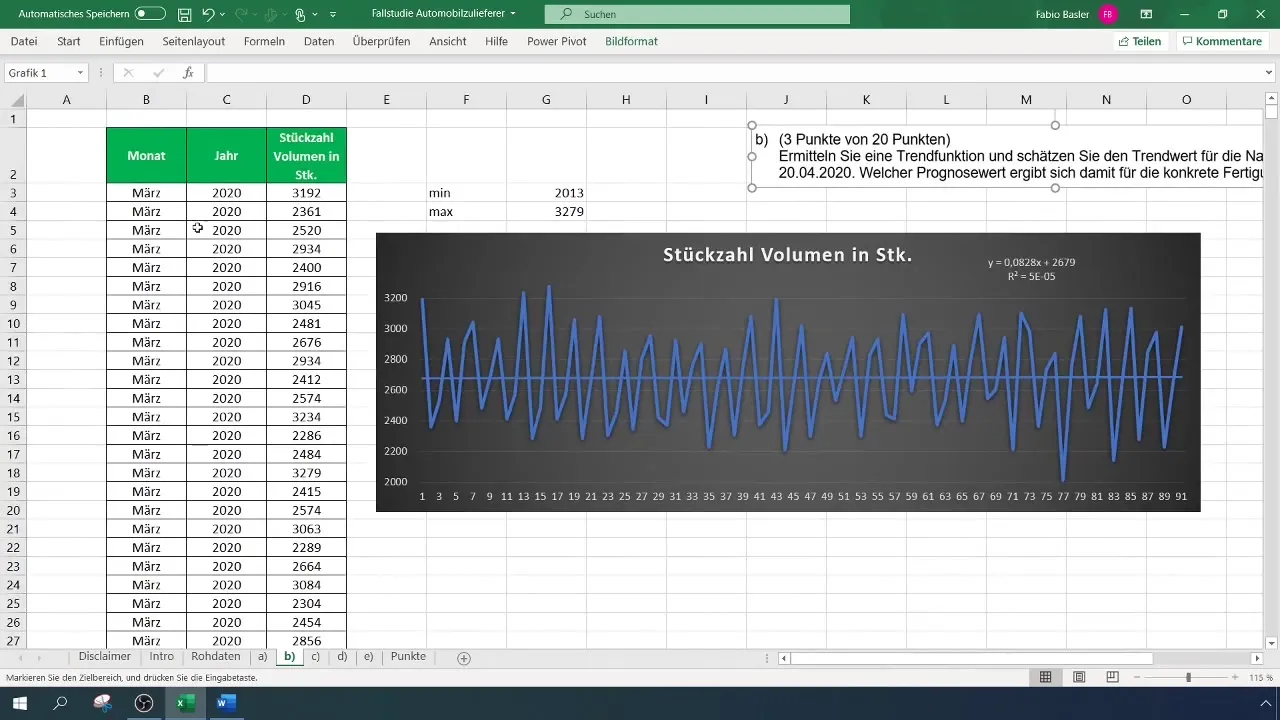
Now you have all the necessary data in your worksheet for further analysis.
Step 4: Calculating the Trendline
To calculate the trendline, activate the chart already created for your time series. Click on the plus icon in the top right corner of the chart to add the “Trendline.”
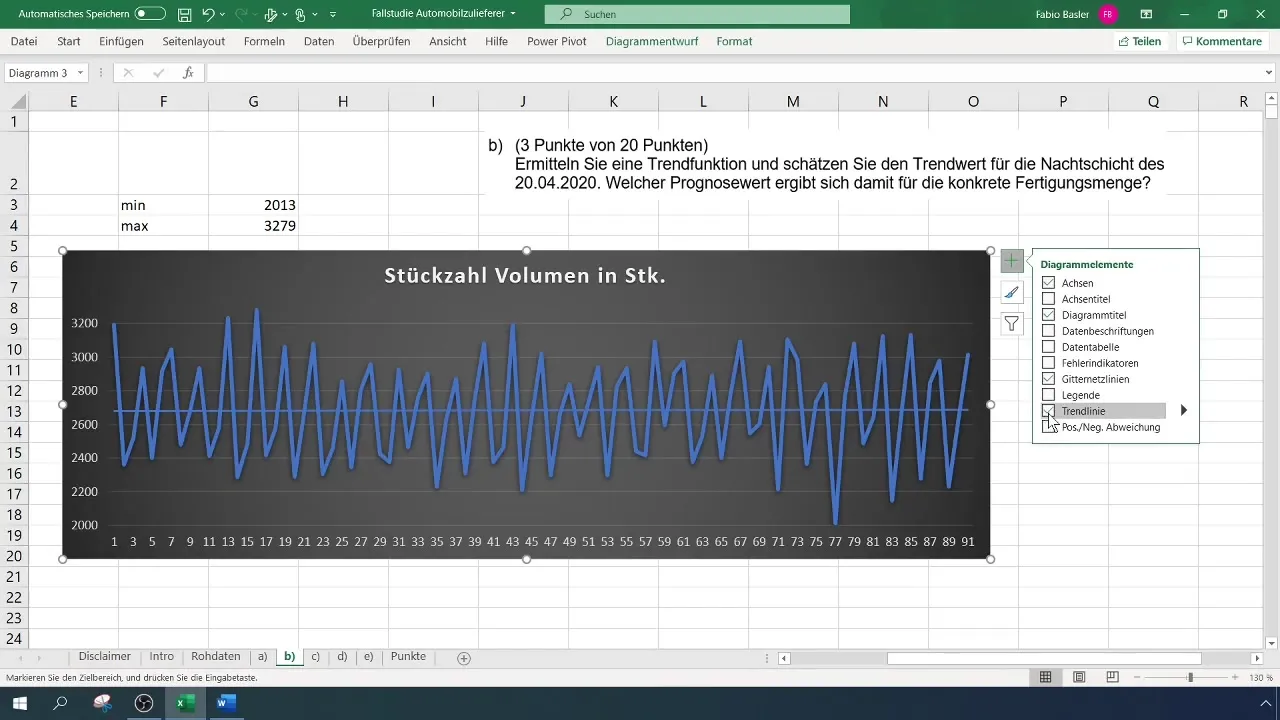
Choose “More Options” to explore different types of trendlines. Typically, the linear trendline is recommended for simple calculations.
Step 5: Displaying the Trendline Formula
Check the “Display Equation on Chart” box to show the mathematical equation of the trendline on the chart. This gives you access to the specific trend function formula.
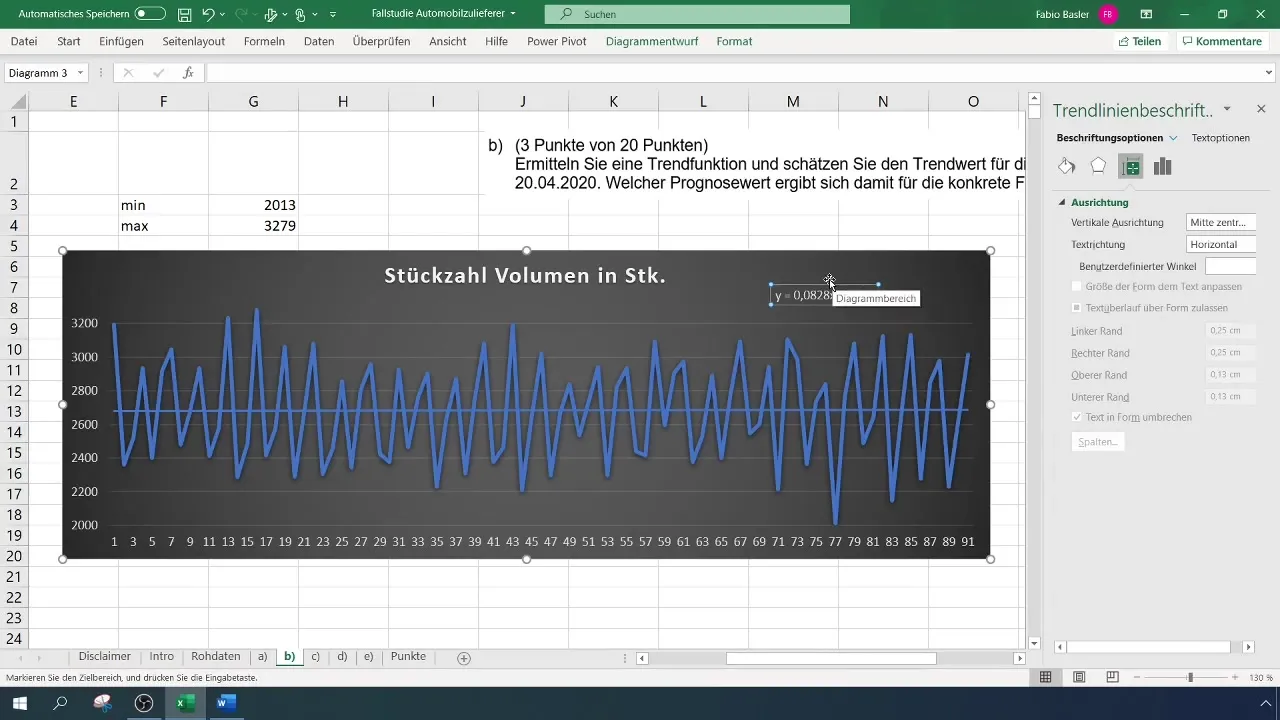
This formula helps you understand how the trendline was calculated and how you can use this information to make forecasts.
Step 6: Manually Calculating the Trendline
To manually calculate the trendline, add columns to consider the date and sequential number of the data. Highlight the relevant data to calculate the axis intercepts and slopes.
Enter the formula for the axis intercept and slope in Excel. The structure of the formulas is: =SLOPE(Y-Values, X-Values) and =INTERCEPT(Y-Values, X-Values).
Step 7: Forecasting Future Values
Now that you have defined the trend function, you can make forecasts for a specific period. Create a new column next to your existing data and calculate the forecasted quantities by applying the trend formula.
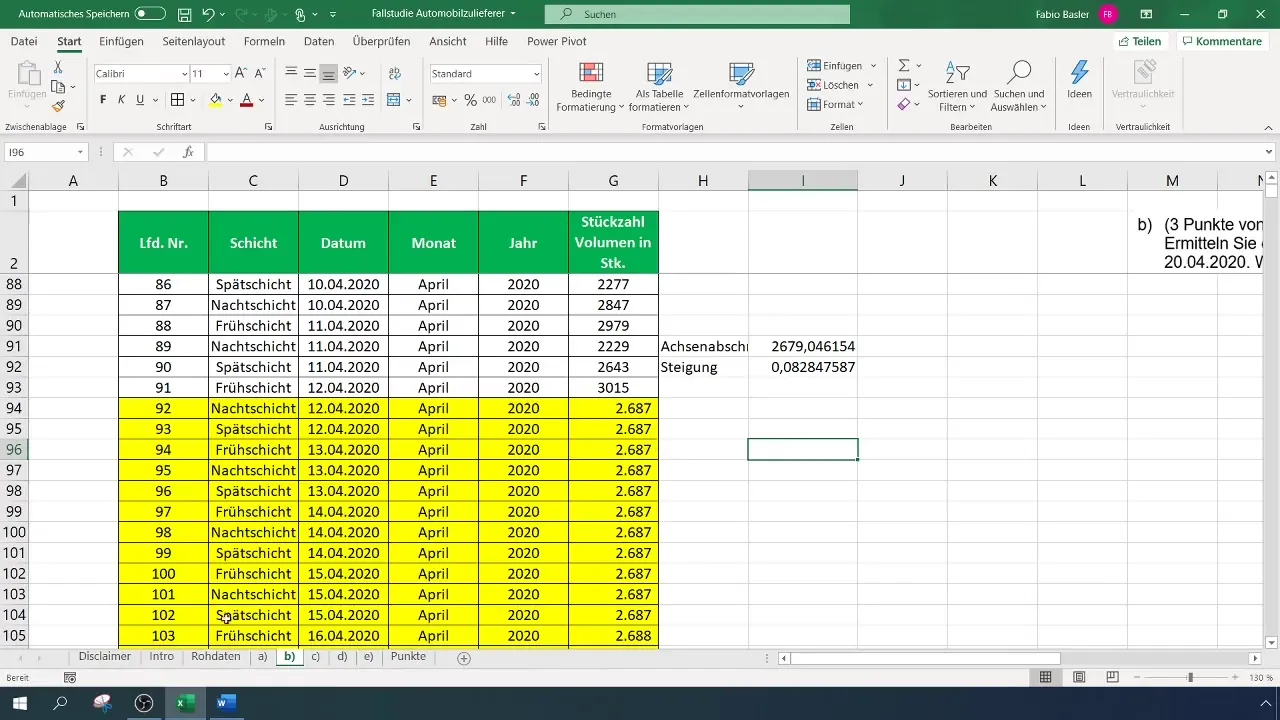
Make sure that the values for the axis intercept and the slope are absolutely fixed so that you can drag them across the entire column. You can achieve this by using the "F4" key.
Step 8: Final Review and Formatting
Format the completed data to present it clearly and concisely. You can use various Excel formatting options for this, such as the thousand separator or adjusting the decimal places.
By following these steps, you have now taken all the necessary steps to use the trend function in Excel and create valuable forecasts.
Summary
With the right approach, you are now able to identify trend functions with Excel and estimate forecasts. You have acquired instrumental knowledge in data visualization and trendline calculation. These techniques will help you make informed decisions based on your production data.
Frequently Asked Questions
What is a trend function in Excel?A trend function in Excel helps estimate and analyze future values based on existing data.
How do I add a trendline in Excel?You can add a trendline through the chart menu and the options for trendlines.
Can I manually calculate trendlines?Yes, you can manually calculate the trendline in Excel by using the appropriate formulas for axis intercept and slope.


